|
|
市場調査レポート
商品コード
1502374
フロス浮選装置の世界市場 2024-2028Global froth flotation equipment market 2024-2028 |
||||||
|
|||||||
カスタマイズ可能
|
|||||||


| フロス浮選装置の世界市場 2024-2028 |
|
出版日: 2024年05月20日
発行: TechNavio
ページ情報: 英文 159 Pages
納期: 即納可能
|

全表示
- 概要
- 図表
- 目次
Technavio社は、フロス浮選装置市場をモニターしており、2023年から2028年にかけて8,260万米ドル、予測期間中のCAGRは4.36%で成長すると予測しています。
当レポートでは、フロス浮選装置市場の全体的な分析、市場規模・予測、動向、成長促進要因、課題、約25のベンダーを網羅したベンダー分析などを掲載しています。
現在の市場シナリオ、最新動向と促進要因、市場環境全体に関する最新分析を提供しています。市場は、鉱物・鉱石処理用途からの高い需要、鉱業におけるフロス浮選の需要増加、良鉱種への需要増加が牽引しています。
| 市場範囲 | |
|---|---|
| 基準年 | 2024 |
| 終了年 | 2028 |
| 予測期間 | 2024-2028 |
| 成長モメンタム | 加速 |
| 前年比2024年 | 4.12% |
| CAGR | 4.36% |
| 増分額 | 8,260万米ドル |
本調査では、新技術の進歩が今後数年間のフロス浮選装置市場成長を牽引する主な要因の1つであるとしています。また、淡水資源の枯渇による廃水処理の増加、環境保護と排出規制への関心の高まりが、市場の大きな需要につながります。
目次
第1章 エグゼクティブサマリー
- 市場概要
第2章 市場情勢
- 市場エコシステム
- 市場の特徴
- バリューチェーン分析
第3章 市場規模の評価
- 市場の定義
- 市場セグメント分析
- 市場規模 2023
- 市場の見通し 2023-2028
第4章 市場規模実績
- 世界フロス浮選装置市場 2018-2022
- タイプ別セグメント分析 2018-2022
- 用途別セグメント分析 2018-2022
- 地域別セグメント分析 2018-2022
- 国別セグメント分析 2018-2022
第5章 ファイブフォース分析
- ファイブフォースの要約
- 買い手の交渉力
- 供給企業の交渉力
- 新規参入業者の脅威
- 代替品の脅威
- 競争の脅威
- 市況
第6章 市場セグメンテーション:タイプ別
- 市場セグメンテーション
- 比較:タイプ別
- フリーフロー浮選:市場規模と予測 2023-2028
- 細胞間浮選:市場規模と予測 2023-2028
- 市場機会:タイプ別
第7章 市場セグメンテーション:用途別
- 市場セグメンテーション
- 比較:用途別
- 鉱物および鉱石処理:市場規模と予測 2023-2028
- 廃水処理:市場規模と予測 2023-2028
- 紙のリサイクル:市場規模と予測 2023-2028
- 市場機会:用途別
第8章 顧客情勢
- 顧客情勢の概要
第9章 地域別情勢
- 地域別セグメンテーション
- 地域別比較
- アジア太平洋:市場規模と予測 2023-2028
- 欧州:市場規模と予測 2023-2028
- 北米:市場規模と予測 2023-2028
- 南米:市場規模と予測 2023-2028
- 中東・アフリカ:市場規模と予測 2023-2028
- 中国:市場規模と予測 2023-2028
- 米国:市場規模と予測 2023-2028
- オーストラリア:市場規模と予測 2023-2028
- インド:市場規模と予測 2023-2028
- カナダ:市場規模と予測 2023-2028
- 市場機会:地域別
第10章 促進要因・課題・機会・抑制要因
- 市場促進要因
- 市場の課題
- 促進要因と課題の影響
- 市場の機会・抑制要因
第11章 競合情勢
- 概要
- 競合情勢
- 混乱の状況
- 業界のリスク
第12章 競合分析
- 企業プロファイル
- 企業の市場ポジショニング
- Della Toffola Spa
- Derek Parnaby Cyclones Ltd.
- Eriez Manufacturing Co.
- FLSmidth and Co. AS
- Henan Fote Heavy Machinery Co. Ltd.
- Jiangxi Shicheng Mine Machinery Factory
- Metso Outotec Corp.
- Prominer(Shanghai)Mining Technology Co., Ltd.
- SGS SA
- Tenova Spa
- Westpro Machinery Co.
- Yantai Jinpeng Mining Machinery Co. Ltd.
- Zhengzhou Zhongding Heavy Duty Machine Manufacturing Co. Ltd.
第13章 付録
Exhibits:
- Exhibits1: Executive Summary - Chart on Market Overview
- Exhibits2: Executive Summary - Data Table on Market Overview
- Exhibits3: Executive Summary - Chart on Global Market Characteristics
- Exhibits4: Executive Summary - Chart on Market by Geography
- Exhibits5: Executive Summary - Chart on Market Segmentation by Type
- Exhibits6: Executive Summary - Chart on Market Segmentation by Application
- Exhibits7: Executive Summary - Chart on Incremental Growth
- Exhibits8: Executive Summary - Data Table on Incremental Growth
- Exhibits9: Executive Summary - Chart on Company Market Positioning
- Exhibits10: Parent Market
- Exhibits11: Data Table on - Parent Market
- Exhibits12: Market characteristics analysis
- Exhibits13: Value Chain Analysis
- Exhibits14: Offerings of companies included in the market definition
- Exhibits15: Market segments
- Exhibits16: Chart on Global - Market size and forecast 2023-2028 ($ million)
- Exhibits17: Data Table on Global - Market size and forecast 2023-2028 ($ million)
- Exhibits18: Chart on Global Market: Year-over-year growth 2023-2028 (%)
- Exhibits19: Data Table on Global Market: Year-over-year growth 2023-2028 (%)
- Exhibits20: Historic Market Size - Data Table on Global Froth Flotation Equipment Market 2018 - 2022 ($ million)
- Exhibits21: Historic Market Size - Type Segment 2018 - 2022 ($ million)
- Exhibits22: Historic Market Size - Application Segment 2018 - 2022 ($ million)
- Exhibits23: Historic Market Size - Geography Segment 2018 - 2022 ($ million)
- Exhibits24: Historic Market Size - Country Segment 2018 - 2022 ($ million)
- Exhibits25: Five forces analysis - Comparison between 2023 and 2028
- Exhibits26: Bargaining power of buyers - Impact of key factors 2023 and 2028
- Exhibits27: Bargaining power of suppliers - Impact of key factors in 2023 and 2028
- Exhibits28: Threat of new entrants - Impact of key factors in 2023 and 2028
- Exhibits29: Threat of substitutes - Impact of key factors in 2023 and 2028
- Exhibits30: Threat of rivalry - Impact of key factors in 2023 and 2028
- Exhibits31: Chart on Market condition - Five forces 2023 and 2028
- Exhibits32: Chart on Type - Market share 2023-2028 (%)
- Exhibits33: Data Table on Type - Market share 2023-2028 (%)
- Exhibits34: Chart on Comparison by Type
- Exhibits35: Data Table on Comparison by Type
- Exhibits36: Chart on Free-flow flotation - Market size and forecast 2023-2028 ($ million)
- Exhibits37: Data Table on Free-flow flotation - Market size and forecast 2023-2028 ($ million)
- Exhibits38: Chart on Free-flow flotation - Year-over-year growth 2023-2028 (%)
- Exhibits39: Data Table on Free-flow flotation - Year-over-year growth 2023-2028 (%)
- Exhibits40: Chart on Cell-to-cell flotation - Market size and forecast 2023-2028 ($ million)
- Exhibits41: Data Table on Cell-to-cell flotation - Market size and forecast 2023-2028 ($ million)
- Exhibits42: Chart on Cell-to-cell flotation - Year-over-year growth 2023-2028 (%)
- Exhibits43: Data Table on Cell-to-cell flotation - Year-over-year growth 2023-2028 (%)
- Exhibits44: Market opportunity by Type ($ million)
- Exhibits45: Data Table on Market opportunity by Type ($ million)
- Exhibits46: Chart on Application - Market share 2023-2028 (%)
- Exhibits47: Data Table on Application - Market share 2023-2028 (%)
- Exhibits48: Chart on Comparison by Application
- Exhibits49: Data Table on Comparison by Application
- Exhibits50: Chart on Mineral and ore processing - Market size and forecast 2023-2028 ($ million)
- Exhibits51: Data Table on Mineral and ore processing - Market size and forecast 2023-2028 ($ million)
- Exhibits52: Chart on Mineral and ore processing - Year-over-year growth 2023-2028 (%)
- Exhibits53: Data Table on Mineral and ore processing - Year-over-year growth 2023-2028 (%)
- Exhibits54: Chart on Wastewater treatment - Market size and forecast 2023-2028 ($ million)
- Exhibits55: Data Table on Wastewater treatment - Market size and forecast 2023-2028 ($ million)
- Exhibits56: Chart on Wastewater treatment - Year-over-year growth 2023-2028 (%)
- Exhibits57: Data Table on Wastewater treatment - Year-over-year growth 2023-2028 (%)
- Exhibits58: Chart on Paper recycling - Market size and forecast 2023-2028 ($ million)
- Exhibits59: Data Table on Paper recycling - Market size and forecast 2023-2028 ($ million)
- Exhibits60: Chart on Paper recycling - Year-over-year growth 2023-2028 (%)
- Exhibits61: Data Table on Paper recycling - Year-over-year growth 2023-2028 (%)
- Exhibits62: Market opportunity by Application ($ million)
- Exhibits63: Data Table on Market opportunity by Application ($ million)
- Exhibits64: Analysis of price sensitivity, lifecycle, customer purchase basket, adoption rates, and purchase criteria
- Exhibits65: Chart on Market share By Geographical Landscape2023-2028 (%)
- Exhibits66: Data Table on Market share By Geographical Landscape2023-2028 (%)
- Exhibits67: Chart on Geographic comparison
- Exhibits68: Data Table on Geographic comparison
- Exhibits69: Chart on APAC - Market size and forecast 2023-2028 ($ million)
- Exhibits70: Data Table on APAC - Market size and forecast 2023-2028 ($ million)
- Exhibits71: Chart on APAC - Year-over-year growth 2023-2028 (%)
- Exhibits72: Data Table on APAC - Year-over-year growth 2023-2028 (%)
- Exhibits73: Chart on Europe - Market size and forecast 2023-2028 ($ million)
- Exhibits74: Data Table on Europe - Market size and forecast 2023-2028 ($ million)
- Exhibits75: Chart on Europe - Year-over-year growth 2023-2028 (%)
- Exhibits76: Data Table on Europe - Year-over-year growth 2023-2028 (%)
- Exhibits77: Chart on North America - Market size and forecast 2023-2028 ($ million)
- Exhibits78: Data Table on North America - Market size and forecast 2023-2028 ($ million)
- Exhibits79: Chart on North America - Year-over-year growth 2023-2028 (%)
- Exhibits80: Data Table on North America - Year-over-year growth 2023-2028 (%)
- Exhibits81: Chart on South America - Market size and forecast 2023-2028 ($ million)
- Exhibits82: Data Table on South America - Market size and forecast 2023-2028 ($ million)
- Exhibits83: Chart on South America - Year-over-year growth 2023-2028 (%)
- Exhibits84: Data Table on South America - Year-over-year growth 2023-2028 (%)
- Exhibits85: Chart on Middle East and Africa - Market size and forecast 2023-2028 ($ million)
- Exhibits86: Data Table on Middle East and Africa - Market size and forecast 2023-2028 ($ million)
- Exhibits87: Chart on Middle East and Africa - Year-over-year growth 2023-2028 (%)
- Exhibits88: Data Table on Middle East and Africa - Year-over-year growth 2023-2028 (%)
- Exhibits89: Chart on China - Market size and forecast 2023-2028 ($ million)
- Exhibits90: Data Table on China - Market size and forecast 2023-2028 ($ million)
- Exhibits91: Chart on China - Year-over-year growth 2023-2028 (%)
- Exhibits92: Data Table on China - Year-over-year growth 2023-2028 (%)
- Exhibits93: Chart on US - Market size and forecast 2023-2028 ($ million)
- Exhibits94: Data Table on US - Market size and forecast 2023-2028 ($ million)
- Exhibits95: Chart on US - Year-over-year growth 2023-2028 (%)
- Exhibits96: Data Table on US - Year-over-year growth 2023-2028 (%)
- Exhibits97: Chart on Australia - Market size and forecast 2023-2028 ($ million)
- Exhibits98: Data Table on Australia - Market size and forecast 2023-2028 ($ million)
- Exhibits99: Chart on Australia - Year-over-year growth 2023-2028 (%)
- Exhibits100: Data Table on Australia - Year-over-year growth 2023-2028 (%)
- Exhibits101: Chart on India - Market size and forecast 2023-2028 ($ million)
- Exhibits102: Data Table on India - Market size and forecast 2023-2028 ($ million)
- Exhibits103: Chart on India - Year-over-year growth 2023-2028 (%)
- Exhibits104: Data Table on India - Year-over-year growth 2023-2028 (%)
- Exhibits105: Chart on Canada - Market size and forecast 2023-2028 ($ million)
- Exhibits106: Data Table on Canada - Market size and forecast 2023-2028 ($ million)
- Exhibits107: Chart on Canada - Year-over-year growth 2023-2028 (%)
- Exhibits108: Data Table on Canada - Year-over-year growth 2023-2028 (%)
- Exhibits109: Market opportunity By Geographical Landscape($ million)
- Exhibits110: Data Tables on Market opportunity By Geographical Landscape($ million)
- Exhibits111: Impact of drivers and challenges in 2023 and 2028
- Exhibits112: Overview on criticality of inputs and factors of differentiation
- Exhibits113: Overview on factors of disruption
- Exhibits114: Impact of key risks on business
- Exhibits115: Companies covered
- Exhibits116: Matrix on companies position and classification
- Exhibits117: Della Toffola Spa - Overview
- Exhibits118: Della Toffola Spa - Product / Service
- Exhibits119: Della Toffola Spa - Key offerings
- Exhibits120: Derek Parnaby Cyclones Ltd. - Overview
- Exhibits121: Derek Parnaby Cyclones Ltd. - Product / Service
- Exhibits122: Derek Parnaby Cyclones Ltd. - Key offerings
- Exhibits123: Eriez Manufacturing Co. - Overview
- Exhibits124: Eriez Manufacturing Co. - Product / Service
- Exhibits125: Eriez Manufacturing Co. - Key offerings
- Exhibits126: FLSmidth and Co. AS - Overview
- Exhibits127: FLSmidth and Co. AS - Business segments
- Exhibits128: FLSmidth and Co. AS - Key news
- Exhibits129: FLSmidth and Co. AS - Key offerings
- Exhibits130: FLSmidth and Co. AS - Segment focus
- Exhibits131: Henan Fote Heavy Machinery Co. Ltd. - Overview
- Exhibits132: Henan Fote Heavy Machinery Co. Ltd. - Product / Service
- Exhibits133: Henan Fote Heavy Machinery Co. Ltd. - Key offerings
- Exhibits134: Jiangxi Shicheng Mine Machinery Factory - Overview
- Exhibits135: Jiangxi Shicheng Mine Machinery Factory - Product / Service
- Exhibits136: Jiangxi Shicheng Mine Machinery Factory - Key offerings
- Exhibits137: Metso Outotec Corp. - Overview
- Exhibits138: Metso Outotec Corp. - Business segments
- Exhibits139: Metso Outotec Corp. - Key news
- Exhibits140: Metso Outotec Corp. - Key offerings
- Exhibits141: Metso Outotec Corp. - Segment focus
- Exhibits142: Prominer (Shanghai) Mining Technology Co., Ltd. - Overview
- Exhibits143: Prominer (Shanghai) Mining Technology Co., Ltd. - Product / Service
- Exhibits144: Prominer (Shanghai) Mining Technology Co., Ltd. - Key offerings
- Exhibits145: SGS SA - Overview
- Exhibits146: SGS SA - Business segments
- Exhibits147: SGS SA - Key news
- Exhibits148: SGS SA - Key offerings
- Exhibits149: SGS SA - Segment focus
- Exhibits150: Tenova Spa - Overview
- Exhibits151: Tenova Spa - Product / Service
- Exhibits152: Tenova Spa - Key offerings
- Exhibits153: Westpro Machinery Co. - Overview
- Exhibits154: Westpro Machinery Co. - Product / Service
- Exhibits155: Westpro Machinery Co. - Key offerings
- Exhibits156: Yantai Jinpeng Mining Machinery Co. Ltd. - Overview
- Exhibits157: Yantai Jinpeng Mining Machinery Co. Ltd. - Product / Service
- Exhibits158: Yantai Jinpeng Mining Machinery Co. Ltd. - Key offerings
- Exhibits159: Zhengzhou Zhongding Heavy Duty Machine Manufacturing Co. Ltd. - Overview
- Exhibits160: Zhengzhou Zhongding Heavy Duty Machine Manufacturing Co. Ltd. - Product / Service
- Exhibits161: Zhengzhou Zhongding Heavy Duty Machine Manufacturing Co. Ltd. - Key offerings
- Exhibits162: Inclusions checklist
- Exhibits163: Exclusions checklist
- Exhibits164: Currency conversion rates for US$
- Exhibits165: Research methodology
- Exhibits166: Information sources
- Exhibits167: Data validation
- Exhibits168: Validation techniques employed for market sizing
- Exhibits169: Data synthesis
- Exhibits170: 360 degree market analysis
- Exhibits171: List of abbreviations
Technavio has been monitoring the froth flotation equipment market and is forecast to grow by USD 82.6 mn during 2023-2028, accelerating at a CAGR of 4.36% during the forecast period. Our report on the froth flotation equipment market provides a holistic analysis, market size and forecast, trends, growth drivers, and challenges, as well as vendor analysis covering around 25 vendors.
The report offers an up-to-date analysis regarding the current market scenario, the latest trends and drivers, and the overall market environment. The market is driven by high demand from mineral and ore processing applications, increasing demand for froth flotation in mining industry, and increasing demand for good ore grades.
Technavio's froth flotation equipment market is segmented as below:
| Market Scope | |
|---|---|
| Base Year | 2024 |
| End Year | 2028 |
| Series Year | 2024-2028 |
| Growth Momentum | Accelerate |
| YOY 2024 | 4.12% |
| CAGR | 4.36% |
| Incremental Value | $82.6mn |
By Type
- Free-flow flotation
- Cell-to-cell flotation
By Application
- Mineral and ore processing
- Wastewater treatment
- Paper recycling
By Geography
- APAC
- Europe
- North America
- South America
- Middle East and Africa
This study identifies the new technology advancements as one of the prime reasons driving the froth flotation equipment market growth during the next few years. Also, increase in wastewater treatment due to depleting freshwater resources and increasing focus on conserving environment and emission control will lead to sizable demand in the market.
Technavio presents a detailed picture of the market by the way of study, synthesis, and summation of data from multiple sources by an analysis of key parameters. Our report on the froth flotation equipment market covers the following areas:
- Froth flotation equipment market sizing
- Froth flotation equipment market forecast
- Froth flotation equipment market industry analysis
Technavio's robust vendor analysis is designed to help clients improve their market position, and in line with this, this report provides a detailed analysis of several leading froth flotation equipment market vendors that include Della Toffola Spa, Derek Parnaby Cyclones Ltd., Eriez Manufacturing Co., FLSmidth and Co. AS, Henan Fote Heavy Machinery Co. Ltd., Jiangxi Shicheng Mine Machinery Factory, Metso Outotec Corp., Prominer (Shanghai) Mining Technology Co., Ltd., SGS SA, Tenova Spa, Westpro Machinery Co., Yantai Jinpeng Mining Machinery Co. Ltd., and Zhengzhou Zhongding Heavy Duty Machine Manufacturing Co. Ltd.. Also, the froth flotation equipment market analysis report includes information on upcoming trends and challenges that will influence market growth. This is to help companies strategize and leverage all forthcoming growth opportunities.
The study was conducted using an objective combination of primary and secondary information including inputs from key participants in the industry. The report contains a comprehensive market and vendor landscape in addition to an analysis of the key vendors.
Technavio presents a detailed picture of the market by the way of study, synthesis, and summation of data from multiple sources by an analysis of key parameters such as profit, pricing, competition, and promotions. It presents various market facets by identifying the key industry influencers. The data presented is comprehensive, reliable, and a result of extensive research - both primary and secondary. Technavio's market research reports provide a complete competitive landscape and an in-depth vendor selection methodology and analysis using qualitative and quantitative research to forecast accurate market growth.
Table of Contents
1 Executive Summary
- 1.1 Market overview
- Executive Summary - Chart on Market Overview
- Executive Summary - Data Table on Market Overview
- Executive Summary - Chart on Global Market Characteristics
- Executive Summary - Chart on Market by Geography
- Executive Summary - Chart on Market Segmentation by Type
- Executive Summary - Chart on Market Segmentation by Application
- Executive Summary - Chart on Incremental Growth
- Executive Summary - Data Table on Incremental Growth
- Executive Summary - Chart on Company Market Positioning
2 Market Landscape
- 2.1 Market ecosystem
- Parent Market
- Data Table on - Parent Market
- 2.2 Market characteristics
- Market characteristics analysis
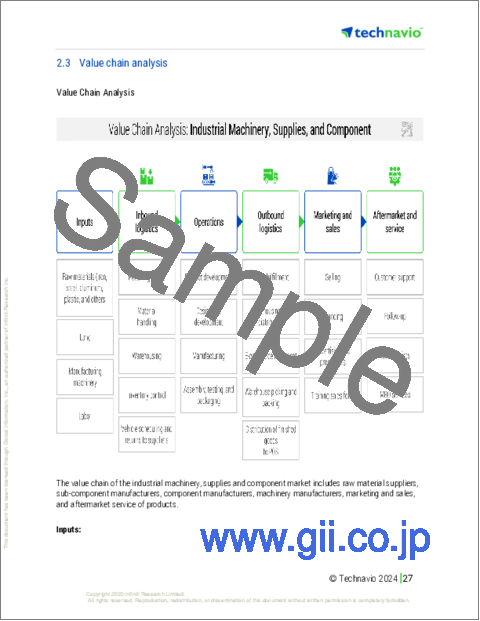
- 2.3 Value chain analysis
- Value Chain Analysis
3 Market Sizing
- 3.1 Market definition
- Offerings of companies included in the market definition
- 3.2 Market segment analysis
- Market segments
- 3.3 Market size 2023
- 3.4 Market outlook: Forecast for 2023-2028
- Chart on Global - Market size and forecast 2023-2028 ($ million)
- Data Table on Global - Market size and forecast 2023-2028 ($ million)
- Chart on Global Market: Year-over-year growth 2023-2028 (%)
- Data Table on Global Market: Year-over-year growth 2023-2028 (%)
4 Historic Market Size
- 4.1 Global Froth Flotation Equipment Market 2018 - 2022
- Historic Market Size - Data Table on Global Froth Flotation Equipment Market 2018 - 2022 ($ million)
- 4.2 Type segment analysis 2018 - 2022
- Historic Market Size - Type Segment 2018 - 2022 ($ million)
- 4.3 Application segment analysis 2018 - 2022
- Historic Market Size - Application Segment 2018 - 2022 ($ million)
- 4.4 Geography segment analysis 2018 - 2022
- Historic Market Size - Geography Segment 2018 - 2022 ($ million)
- 4.5 Country segment analysis 2018 - 2022
- Historic Market Size - Country Segment 2018 - 2022 ($ million)
5 Five Forces Analysis
- 5.1 Five forces summary
- Five forces analysis - Comparison between 2023 and 2028
- 5.2 Bargaining power of buyers
- Bargaining power of buyers - Impact of key factors 2023 and 2028
- 5.3 Bargaining power of suppliers
- Bargaining power of suppliers - Impact of key factors in 2023 and 2028
- 5.4 Threat of new entrants
- Threat of new entrants - Impact of key factors in 2023 and 2028
- 5.5 Threat of substitutes
- Threat of substitutes - Impact of key factors in 2023 and 2028
- 5.6 Threat of rivalry
- Threat of rivalry - Impact of key factors in 2023 and 2028
- 5.7 Market condition
- Chart on Market condition - Five forces 2023 and 2028
6 Market Segmentation by Type
- 6.1 Market segments
- Chart on Type - Market share 2023-2028 (%)
- Data Table on Type - Market share 2023-2028 (%)
- 6.2 Comparison by Type
- Chart on Comparison by Type
- Data Table on Comparison by Type
- 6.3 Free-flow flotation - Market size and forecast 2023-2028
- Chart on Free-flow flotation - Market size and forecast 2023-2028 ($ million)
- Data Table on Free-flow flotation - Market size and forecast 2023-2028 ($ million)
- Chart on Free-flow flotation - Year-over-year growth 2023-2028 (%)
- Data Table on Free-flow flotation - Year-over-year growth 2023-2028 (%)
- 6.4 Cell-to-cell flotation - Market size and forecast 2023-2028
- Chart on Cell-to-cell flotation - Market size and forecast 2023-2028 ($ million)
- Data Table on Cell-to-cell flotation - Market size and forecast 2023-2028 ($ million)
- Chart on Cell-to-cell flotation - Year-over-year growth 2023-2028 (%)
- Data Table on Cell-to-cell flotation - Year-over-year growth 2023-2028 (%)
- 6.5 Market opportunity by Type
- Market opportunity by Type ($ million)
- Data Table on Market opportunity by Type ($ million)
7 Market Segmentation by Application
- 7.1 Market segments
- Chart on Application - Market share 2023-2028 (%)
- Data Table on Application - Market share 2023-2028 (%)
- 7.2 Comparison by Application
- Chart on Comparison by Application
- Data Table on Comparison by Application
- 7.3 Mineral and ore processing - Market size and forecast 2023-2028
- Chart on Mineral and ore processing - Market size and forecast 2023-2028 ($ million)
- Data Table on Mineral and ore processing - Market size and forecast 2023-2028 ($ million)
- Chart on Mineral and ore processing - Year-over-year growth 2023-2028 (%)
- Data Table on Mineral and ore processing - Year-over-year growth 2023-2028 (%)
- 7.4 Wastewater treatment - Market size and forecast 2023-2028
- Chart on Wastewater treatment - Market size and forecast 2023-2028 ($ million)
- Data Table on Wastewater treatment - Market size and forecast 2023-2028 ($ million)
- Chart on Wastewater treatment - Year-over-year growth 2023-2028 (%)
- Data Table on Wastewater treatment - Year-over-year growth 2023-2028 (%)
- 7.5 Paper recycling - Market size and forecast 2023-2028
- Chart on Paper recycling - Market size and forecast 2023-2028 ($ million)
- Data Table on Paper recycling - Market size and forecast 2023-2028 ($ million)
- Chart on Paper recycling - Year-over-year growth 2023-2028 (%)
- Data Table on Paper recycling - Year-over-year growth 2023-2028 (%)
- 7.6 Market opportunity by Application
- Market opportunity by Application ($ million)
- Data Table on Market opportunity by Application ($ million)
8 Customer Landscape
- 8.1 Customer landscape overview
- Analysis of price sensitivity, lifecycle, customer purchase basket, adoption rates, and purchase criteria
9 Geographic Landscape
- 9.1 Geographic segmentation
- Chart on Market share By Geographical Landscape2023-2028 (%)
- Data Table on Market share By Geographical Landscape2023-2028 (%)
- 9.2 Geographic comparison
- Chart on Geographic comparison
- Data Table on Geographic comparison
- 9.3 APAC - Market size and forecast 2023-2028
- Chart on APAC - Market size and forecast 2023-2028 ($ million)
- Data Table on APAC - Market size and forecast 2023-2028 ($ million)
- Chart on APAC - Year-over-year growth 2023-2028 (%)
- Data Table on APAC - Year-over-year growth 2023-2028 (%)
- 9.4 Europe - Market size and forecast 2023-2028
- Chart on Europe - Market size and forecast 2023-2028 ($ million)
- Data Table on Europe - Market size and forecast 2023-2028 ($ million)
- Chart on Europe - Year-over-year growth 2023-2028 (%)
- Data Table on Europe - Year-over-year growth 2023-2028 (%)
- 9.5 North America - Market size and forecast 2023-2028
- Chart on North America - Market size and forecast 2023-2028 ($ million)
- Data Table on North America - Market size and forecast 2023-2028 ($ million)
- Chart on North America - Year-over-year growth 2023-2028 (%)
- Data Table on North America - Year-over-year growth 2023-2028 (%)
- 9.6 South America - Market size and forecast 2023-2028
- Chart on South America - Market size and forecast 2023-2028 ($ million)
- Data Table on South America - Market size and forecast 2023-2028 ($ million)
- Chart on South America - Year-over-year growth 2023-2028 (%)
- Data Table on South America - Year-over-year growth 2023-2028 (%)
- 9.7 Middle East and Africa - Market size and forecast 2023-2028
- Chart on Middle East and Africa - Market size and forecast 2023-2028 ($ million)
- Data Table on Middle East and Africa - Market size and forecast 2023-2028 ($ million)
- Chart on Middle East and Africa - Year-over-year growth 2023-2028 (%)
- Data Table on Middle East and Africa - Year-over-year growth 2023-2028 (%)
- 9.8 China - Market size and forecast 2023-2028
- Chart on China - Market size and forecast 2023-2028 ($ million)
- Data Table on China - Market size and forecast 2023-2028 ($ million)
- Chart on China - Year-over-year growth 2023-2028 (%)
- Data Table on China - Year-over-year growth 2023-2028 (%)
- 9.9 US - Market size and forecast 2023-2028
- Chart on US - Market size and forecast 2023-2028 ($ million)
- Data Table on US - Market size and forecast 2023-2028 ($ million)
- Chart on US - Year-over-year growth 2023-2028 (%)
- Data Table on US - Year-over-year growth 2023-2028 (%)
- 9.10 Australia - Market size and forecast 2023-2028
- Chart on Australia - Market size and forecast 2023-2028 ($ million)
- Data Table on Australia - Market size and forecast 2023-2028 ($ million)
- Chart on Australia - Year-over-year growth 2023-2028 (%)
- Data Table on Australia - Year-over-year growth 2023-2028 (%)
- 9.11 India - Market size and forecast 2023-2028
- Chart on India - Market size and forecast 2023-2028 ($ million)
- Data Table on India - Market size and forecast 2023-2028 ($ million)
- Chart on India - Year-over-year growth 2023-2028 (%)
- Data Table on India - Year-over-year growth 2023-2028 (%)
- 9.12 Canada - Market size and forecast 2023-2028
- Chart on Canada - Market size and forecast 2023-2028 ($ million)
- Data Table on Canada - Market size and forecast 2023-2028 ($ million)
- Chart on Canada - Year-over-year growth 2023-2028 (%)
- Data Table on Canada - Year-over-year growth 2023-2028 (%)
- 9.13 Market opportunity by geography
- Market opportunity By Geographical Landscape($ million)
- Data Tables on Market opportunity By Geographical Landscape($ million)
10 Drivers, Challenges, and Opportunity/Restraints
- 10.1 Market drivers
- 10.2 Market challenges
- 10.3 Impact of drivers and challenges
- Impact of drivers and challenges in 2023 and 2028
- 10.4 Market opportunities/restraints
11 Competitive Landscape
- 11.1 Overview
- 11.2 Competitive Landscape
- Overview on criticality of inputs and factors of differentiation
- 11.3 Landscape disruption
- Overview on factors of disruption
- 11.4 Industry risks
- Impact of key risks on business
12 Competitive Analysis
- 12.1 Companies profiled
- Companies covered
- 12.2 Market positioning of companies
- Matrix on companies position and classification
- 12.3 Della Toffola Spa
- Della Toffola Spa - Overview
- Della Toffola Spa - Product / Service
- Della Toffola Spa - Key offerings
- 12.4 Derek Parnaby Cyclones Ltd.
- Derek Parnaby Cyclones Ltd. - Overview
- Derek Parnaby Cyclones Ltd. - Product / Service
- Derek Parnaby Cyclones Ltd. - Key offerings
- 12.5 Eriez Manufacturing Co.
- Eriez Manufacturing Co. - Overview
- Eriez Manufacturing Co. - Product / Service
- Eriez Manufacturing Co. - Key offerings
- 12.6 FLSmidth and Co. AS
- FLSmidth and Co. AS - Overview
- FLSmidth and Co. AS - Business segments
- FLSmidth and Co. AS - Key news
- FLSmidth and Co. AS - Key offerings
- FLSmidth and Co. AS - Segment focus
- 12.7 Henan Fote Heavy Machinery Co. Ltd.
- Henan Fote Heavy Machinery Co. Ltd. - Overview
- Henan Fote Heavy Machinery Co. Ltd. - Product / Service
- Henan Fote Heavy Machinery Co. Ltd. - Key offerings
- 12.8 Jiangxi Shicheng Mine Machinery Factory
- Jiangxi Shicheng Mine Machinery Factory - Overview
- Jiangxi Shicheng Mine Machinery Factory - Product / Service
- Jiangxi Shicheng Mine Machinery Factory - Key offerings
- 12.9 Metso Outotec Corp.
- Metso Outotec Corp. - Overview
- Metso Outotec Corp. - Business segments
- Metso Outotec Corp. - Key news
- Metso Outotec Corp. - Key offerings
- Metso Outotec Corp. - Segment focus
- 12.10 Prominer (Shanghai) Mining Technology Co., Ltd.
- Prominer (Shanghai) Mining Technology Co., Ltd. - Overview
- Prominer (Shanghai) Mining Technology Co., Ltd. - Product / Service
- Prominer (Shanghai) Mining Technology Co., Ltd. - Key offerings
- 12.11 SGS SA
- SGS SA - Overview
- SGS SA - Business segments
- SGS SA - Key news
- SGS SA - Key offerings
- SGS SA - Segment focus
- 12.12 Tenova Spa
- Tenova Spa - Overview
- Tenova Spa - Product / Service
- Tenova Spa - Key offerings
- 12.13 Westpro Machinery Co.
- Westpro Machinery Co. - Overview
- Westpro Machinery Co. - Product / Service
- Westpro Machinery Co. - Key offerings
- 12.14 Yantai Jinpeng Mining Machinery Co. Ltd.
- Yantai Jinpeng Mining Machinery Co. Ltd. - Overview
- Yantai Jinpeng Mining Machinery Co. Ltd. - Product / Service
- Yantai Jinpeng Mining Machinery Co. Ltd. - Key offerings
- 12.15 Zhengzhou Zhongding Heavy Duty Machine Manufacturing Co. Ltd.
- Zhengzhou Zhongding Heavy Duty Machine Manufacturing Co. Ltd. - Overview
- Zhengzhou Zhongding Heavy Duty Machine Manufacturing Co. Ltd. - Product / Service
- Zhengzhou Zhongding Heavy Duty Machine Manufacturing Co. Ltd. - Key offerings
13 Appendix
- 13.1 Scope of the report
- 13.2 Inclusions and exclusions checklist
- Inclusions checklist
- Exclusions checklist
- 13.3 Currency conversion rates for US$
- Currency conversion rates for US$
- 13.4 Research methodology
- Research methodology
- 13.5 Data procurement
- Information sources
- 13.6 Data validation
- Data validation
- 13.7 Validation techniques employed for market sizing
- Validation techniques employed for market sizing
- 13.8 Data synthesis
- Data synthesis
- 13.9 360 degree market analysis
- 360 degree market analysis
- 13.10 List of abbreviations
- List of abbreviations
