|
|
市場調査レポート
商品コード
1502224
モーターサイクル用サスペンションシステムの世界市場 2024-2028Global motorcycle suspension systems market 2024-2028 |
||||||

|
|||||||
カスタマイズ可能
|
|||||||

| モーターサイクル用サスペンションシステムの世界市場 2024-2028 |
|
出版日: 2024年05月17日
発行: TechNavio
ページ情報: 英文 170 Pages
納期: 即納可能
|

全表示
- 概要
- 図表
- 目次
モーターサイクル用サスペンションシステム市場は2023-2028年に2億3,010万米ドル、予測期間中のCAGRは6.28%で成長すると予測されています。
当レポートでは、モーターサイクル用サスペンションシステム市場の全体的な分析、市場規模・予測、動向、成長促進要因、課題、約25のベンダーを網羅したベンダー分析などを掲載しています。
現在の市場シナリオ、最新動向と促進要因、市場環境全体に関する最新分析を提供しています。二輪車における機械部品の電動化の進展、モーターサイクル用サスペンションシステムに関連する利点、二輪車販売の増加などが市場を牽引しています。
| 市場範囲 | |
|---|---|
| 基準年 | 2024 |
| 終了年 | 2028 |
| 予測期間 | 2024-2028 |
| 成長モメンタム | 加速 |
| 前年比2024年 | 5.8% |
| CAGR | 6.28% |
| 増分額 | 2億3,010万米ドル |
本調査では、今後数年間のモーターサイクル用サスペンションシステム市場の成長を牽引する主な要因の一つとして、自動車関連企業の間でデュアルベンディングバルブフロントフォーク技術に対する需要が高まっていることを挙げています。また、安全指数を向上させる電子ダンピング制御の市場開拓や、デュオレバーフロントサスペンションの採用増加も、市場の大きな需要につながると思われます。
目次
第1章 エグゼクティブサマリー
- 市場概要
第2章 市場情勢
- 市場エコシステム
- 市場の特徴
- バリューチェーン分析
第3章 市場規模の評価
- 市場の定義
- 市場セグメント分析
- 市場規模 2023
- 市場の見通し 2023-2028
第4章 市場規模実績
- 世界モーターサイクル用サスペンションシステム市場 2018-2022
- チャネル別セグメント分析 2018-2022
- タイプ別セグメント分析 2018-2022
- 地域別セグメント分析 2018-2022
- 国別セグメント分析 2018-2022
第5章 ファイブフォース分析
- ファイブフォースの要約
- 買い手の交渉力
- 供給企業の交渉力
- 新規参入業者の脅威
- 代替品の脅威
- 競争の脅威
- 市況
第6章 市場セグメンテーション:チャネル別
- 市場セグメンテーション
- 比較:チャネル別
- メーカー:市場規模と予測 2023-2028
- アフターマーケット:市場規模と予測 2023-2028
- 市場機会:チャネル別
第7章 市場セグメンテーション:タイプ別
- 市場セグメンテーション
- 比較:タイプ別
- フロントサスペンション:市場規模と予測 2023-2028
- リアサスペンション:市場規模と予測 2023-2028
- 市場機会:タイプ別
第8章 顧客情勢
- 顧客情勢の概要
第9章 地域別情勢
- 地域別セグメンテーション
- 地域別比較
- アジア太平洋:市場規模と予測 2023-2028
- 北米:市場規模と予測 2023-2028
- 欧州:市場規模と予測 2023-2028
- 南米:市場規模と予測 2023-2028
- 中東・アフリカ:市場規模と予測 2023-2028
- 中国:市場規模と予測 2023-2028
- インド:市場規模と予測 2023-2028
- インドネシア:市場規模と予測 2023-2028
- タイ:市場規模と予測 2023-2028
- 米国:市場規模と予測 2023-2028
- 市場機会:地域別
第10章 促進要因・課題・機会・抑制要因
- 市場促進要因
- 市場の課題
- 促進要因と課題の影響
- 市場の機会・抑制要因
第11章 競合情勢
- 概要
- 競合情勢
- 混乱の状況
- 業界のリスク
第12章 競合分析
- 企業プロファイル
- 企業の市場ポジショニング
- Bayerische Motoren Werke AG
- Duroshox Pvt. Ltd.
- Endurance Technologies Ltd.
- Fox Factory Holding Corp.
- Hero MotoCorp Ltd
- Hitachi Ltd.
- KYB Corp.
- Matris Srl
- Mupo Srl
- Nitron Racing Systems Ltd.
- Penske Racing Shocks
- PIERER Mobility AG
- Tenneco Inc.
- TFX Suspension Technology
- ZF Friedrichshafen AG
第13章 付録
Exhibits:
- Exhibits1: Executive Summary - Chart on Market Overview
- Exhibits2: Executive Summary - Data Table on Market Overview
- Exhibits3: Executive Summary - Chart on Global Market Characteristics
- Exhibits4: Executive Summary - Chart on Market by Geography
- Exhibits5: Executive Summary - Chart on Market Segmentation by Channel
- Exhibits6: Executive Summary - Chart on Market Segmentation by Type
- Exhibits7: Executive Summary - Chart on Incremental Growth
- Exhibits8: Executive Summary - Data Table on Incremental Growth
- Exhibits9: Executive Summary - Chart on Company Market Positioning
- Exhibits10: Parent Market
- Exhibits11: Data Table on - Parent Market
- Exhibits12: Market characteristics analysis
- Exhibits13: Value Chain Analysis
- Exhibits14: Offerings of companies included in the market definition
- Exhibits15: Market segments
- Exhibits16: Chart on Global - Market size and forecast 2023-2028 ($ million)
- Exhibits17: Data Table on Global - Market size and forecast 2023-2028 ($ million)
- Exhibits18: Chart on Global Market: Year-over-year growth 2023-2028 (%)
- Exhibits19: Data Table on Global Market: Year-over-year growth 2023-2028 (%)
- Exhibits20: Historic Market Size - Data Table on Global Motorcycle Suspension Systems Market 2018 - 2022 ($ million)
- Exhibits21: Historic Market Size - Channel Segment 2018 - 2022 ($ million)
- Exhibits22: Historic Market Size - Type Segment 2018 - 2022 ($ million)
- Exhibits23: Historic Market Size - Geography Segment 2018 - 2022 ($ million)
- Exhibits24: Historic Market Size - Country Segment 2018 - 2022 ($ million)
- Exhibits25: Five forces analysis - Comparison between 2023 and 2028
- Exhibits26: Bargaining power of buyers - Impact of key factors 2023 and 2028
- Exhibits27: Bargaining power of suppliers - Impact of key factors in 2023 and 2028
- Exhibits28: Threat of new entrants - Impact of key factors in 2023 and 2028
- Exhibits29: Threat of substitutes - Impact of key factors in 2023 and 2028
- Exhibits30: Threat of rivalry - Impact of key factors in 2023 and 2028
- Exhibits31: Chart on Market condition - Five forces 2023 and 2028
- Exhibits32: Chart on Channel - Market share 2023-2028 (%)
- Exhibits33: Data Table on Channel - Market share 2023-2028 (%)
- Exhibits34: Chart on Comparison by Channel
- Exhibits35: Data Table on Comparison by Channel
- Exhibits36: Chart on OEM - Market size and forecast 2023-2028 ($ million)
- Exhibits37: Data Table on OEM - Market size and forecast 2023-2028 ($ million)
- Exhibits38: Chart on OEM - Year-over-year growth 2023-2028 (%)
- Exhibits39: Data Table on OEM - Year-over-year growth 2023-2028 (%)
- Exhibits40: Chart on Aftermarket - Market size and forecast 2023-2028 ($ million)
- Exhibits41: Data Table on Aftermarket - Market size and forecast 2023-2028 ($ million)
- Exhibits42: Chart on Aftermarket - Year-over-year growth 2023-2028 (%)
- Exhibits43: Data Table on Aftermarket - Year-over-year growth 2023-2028 (%)
- Exhibits44: Market opportunity by Channel ($ million)
- Exhibits45: Data Table on Market opportunity by Channel ($ million)
- Exhibits46: Chart on Type - Market share 2023-2028 (%)
- Exhibits47: Data Table on Type - Market share 2023-2028 (%)
- Exhibits48: Chart on Comparison by Type
- Exhibits49: Data Table on Comparison by Type
- Exhibits50: Chart on Front suspension - Market size and forecast 2023-2028 ($ million)
- Exhibits51: Data Table on Front suspension - Market size and forecast 2023-2028 ($ million)
- Exhibits52: Chart on Front suspension - Year-over-year growth 2023-2028 (%)
- Exhibits53: Data Table on Front suspension - Year-over-year growth 2023-2028 (%)
- Exhibits54: Chart on Rear suspension - Market size and forecast 2023-2028 ($ million)
- Exhibits55: Data Table on Rear suspension - Market size and forecast 2023-2028 ($ million)
- Exhibits56: Chart on Rear suspension - Year-over-year growth 2023-2028 (%)
- Exhibits57: Data Table on Rear suspension - Year-over-year growth 2023-2028 (%)
- Exhibits58: Market opportunity by Type ($ million)
- Exhibits59: Data Table on Market opportunity by Type ($ million)
- Exhibits60: Analysis of price sensitivity, lifecycle, customer purchase basket, adoption rates, and purchase criteria
- Exhibits61: Chart on Market share By Geographical Landscape2023-2028 (%)
- Exhibits62: Data Table on Market share By Geographical Landscape2023-2028 (%)
- Exhibits63: Chart on Geographic comparison
- Exhibits64: Data Table on Geographic comparison
- Exhibits65: Chart on APAC - Market size and forecast 2023-2028 ($ million)
- Exhibits66: Data Table on APAC - Market size and forecast 2023-2028 ($ million)
- Exhibits67: Chart on APAC - Year-over-year growth 2023-2028 (%)
- Exhibits68: Data Table on APAC - Year-over-year growth 2023-2028 (%)
- Exhibits69: Chart on North America - Market size and forecast 2023-2028 ($ million)
- Exhibits70: Data Table on North America - Market size and forecast 2023-2028 ($ million)
- Exhibits71: Chart on North America - Year-over-year growth 2023-2028 (%)
- Exhibits72: Data Table on North America - Year-over-year growth 2023-2028 (%)
- Exhibits73: Chart on Europe - Market size and forecast 2023-2028 ($ million)
- Exhibits74: Data Table on Europe - Market size and forecast 2023-2028 ($ million)
- Exhibits75: Chart on Europe - Year-over-year growth 2023-2028 (%)
- Exhibits76: Data Table on Europe - Year-over-year growth 2023-2028 (%)
- Exhibits77: Chart on South America - Market size and forecast 2023-2028 ($ million)
- Exhibits78: Data Table on South America - Market size and forecast 2023-2028 ($ million)
- Exhibits79: Chart on South America - Year-over-year growth 2023-2028 (%)
- Exhibits80: Data Table on South America - Year-over-year growth 2023-2028 (%)
- Exhibits81: Chart on Middle East and Africa - Market size and forecast 2023-2028 ($ million)
- Exhibits82: Data Table on Middle East and Africa - Market size and forecast 2023-2028 ($ million)
- Exhibits83: Chart on Middle East and Africa - Year-over-year growth 2023-2028 (%)
- Exhibits84: Data Table on Middle East and Africa - Year-over-year growth 2023-2028 (%)
- Exhibits85: Chart on China - Market size and forecast 2023-2028 ($ million)
- Exhibits86: Data Table on China - Market size and forecast 2023-2028 ($ million)
- Exhibits87: Chart on China - Year-over-year growth 2023-2028 (%)
- Exhibits88: Data Table on China - Year-over-year growth 2023-2028 (%)
- Exhibits89: Chart on India - Market size and forecast 2023-2028 ($ million)
- Exhibits90: Data Table on India - Market size and forecast 2023-2028 ($ million)
- Exhibits91: Chart on India - Year-over-year growth 2023-2028 (%)
- Exhibits92: Data Table on India - Year-over-year growth 2023-2028 (%)
- Exhibits93: Chart on Indonesia - Market size and forecast 2023-2028 ($ million)
- Exhibits94: Data Table on Indonesia - Market size and forecast 2023-2028 ($ million)
- Exhibits95: Chart on Indonesia - Year-over-year growth 2023-2028 (%)
- Exhibits96: Data Table on Indonesia - Year-over-year growth 2023-2028 (%)
- Exhibits97: Chart on Thailand - Market size and forecast 2023-2028 ($ million)
- Exhibits98: Data Table on Thailand - Market size and forecast 2023-2028 ($ million)
- Exhibits99: Chart on Thailand - Year-over-year growth 2023-2028 (%)
- Exhibits100: Data Table on Thailand - Year-over-year growth 2023-2028 (%)
- Exhibits101: Chart on US - Market size and forecast 2023-2028 ($ million)
- Exhibits102: Data Table on US - Market size and forecast 2023-2028 ($ million)
- Exhibits103: Chart on US - Year-over-year growth 2023-2028 (%)
- Exhibits104: Data Table on US - Year-over-year growth 2023-2028 (%)
- Exhibits105: Market opportunity By Geographical Landscape($ million)
- Exhibits106: Data Tables on Market opportunity By Geographical Landscape($ million)
- Exhibits107: Impact of drivers and challenges in 2023 and 2028
- Exhibits108: Overview on criticality of inputs and factors of differentiation
- Exhibits109: Overview on factors of disruption
- Exhibits110: Impact of key risks on business
- Exhibits111: Companies covered
- Exhibits112: Matrix on companies position and classification
- Exhibits113: Bayerische Motoren Werke AG - Overview
- Exhibits114: Bayerische Motoren Werke AG - Business segments
- Exhibits115: Bayerische Motoren Werke AG - Key news
- Exhibits116: Bayerische Motoren Werke AG - Key offerings
- Exhibits117: Bayerische Motoren Werke AG - Segment focus
- Exhibits118: Duroshox Pvt. Ltd. - Overview
- Exhibits119: Duroshox Pvt. Ltd. - Product / Service
- Exhibits120: Duroshox Pvt. Ltd. - Key offerings
- Exhibits121: Endurance Technologies Ltd. - Overview
- Exhibits122: Endurance Technologies Ltd. - Product / Service
- Exhibits123: Endurance Technologies Ltd. - Key offerings
- Exhibits124: Fox Factory Holding Corp. - Overview
- Exhibits125: Fox Factory Holding Corp. - Product / Service
- Exhibits126: Fox Factory Holding Corp. - Key offerings
- Exhibits127: Hero MotoCorp Ltd - Overview
- Exhibits128: Hero MotoCorp Ltd - Product / Service
- Exhibits129: Hero MotoCorp Ltd - Key offerings
- Exhibits130: Hitachi Ltd. - Overview
- Exhibits131: Hitachi Ltd. - Business segments
- Exhibits132: Hitachi Ltd. - Key news
- Exhibits133: Hitachi Ltd. - Key offerings
- Exhibits134: Hitachi Ltd. - Segment focus
- Exhibits135: KYB Corp. - Overview
- Exhibits136: KYB Corp. - Business segments
- Exhibits137: KYB Corp. - Key offerings
- Exhibits138: KYB Corp. - Segment focus
- Exhibits139: Matris Srl - Overview
- Exhibits140: Matris Srl - Product / Service
- Exhibits141: Matris Srl - Key offerings
- Exhibits142: Mupo Srl - Overview
- Exhibits143: Mupo Srl - Product / Service
- Exhibits144: Mupo Srl - Key offerings
- Exhibits145: Nitron Racing Systems Ltd. - Overview
- Exhibits146: Nitron Racing Systems Ltd. - Product / Service
- Exhibits147: Nitron Racing Systems Ltd. - Key offerings
- Exhibits148: Penske Racing Shocks - Overview
- Exhibits149: Penske Racing Shocks - Product / Service
- Exhibits150: Penske Racing Shocks - Key offerings
- Exhibits151: PIERER Mobility AG - Overview
- Exhibits152: PIERER Mobility AG - Business segments
- Exhibits153: PIERER Mobility AG - Key offerings
- Exhibits154: PIERER Mobility AG - Segment focus
- Exhibits155: Tenneco Inc. - Overview
- Exhibits156: Tenneco Inc. - Product / Service
- Exhibits157: Tenneco Inc. - Key news
- Exhibits158: Tenneco Inc. - Key offerings
- Exhibits159: TFX Suspension Technology - Overview
- Exhibits160: TFX Suspension Technology - Product / Service
- Exhibits161: TFX Suspension Technology - Key offerings
- Exhibits162: ZF Friedrichshafen AG - Overview
- Exhibits163: ZF Friedrichshafen AG - Business segments
- Exhibits164: ZF Friedrichshafen AG - Key news
- Exhibits165: ZF Friedrichshafen AG - Key offerings
- Exhibits166: ZF Friedrichshafen AG - Segment focus
- Exhibits167: Inclusions checklist
- Exhibits168: Exclusions checklist
- Exhibits169: Currency conversion rates for US$
- Exhibits170: Research methodology
- Exhibits171: Information sources
- Exhibits172: Data validation
- Exhibits173: Validation techniques employed for market sizing
- Exhibits174: Data synthesis
- Exhibits175: 360 degree market analysis
- Exhibits176: List of abbreviations
The motorcycle suspension systems market is forecasted to grow by USD 230.1 mn during 2023-2028, accelerating at a CAGR of 6.28% during the forecast period. The report on the motorcycle suspension systems market provides a holistic analysis, market size and forecast, trends, growth drivers, and challenges, as well as vendor analysis covering around 25 vendors.
The report offers an up-to-date analysis regarding the current market scenario, the latest trends and drivers, and the overall market environment. The market is driven by increased electrification of mechanical components in motorcycles, advantages associated with motorcycle suspension systems, and increasing motorcycle sales.
Technavio's motorcycle suspension systems market is segmented as below:
| Market Scope | |
|---|---|
| Base Year | 2024 |
| End Year | 2028 |
| Series Year | 2024-2028 |
| Growth Momentum | Accelerate |
| YOY 2024 | 5.8% |
| CAGR | 6.28% |
| Incremental Value | $230.1mn |
By Channel
- OEM
- Aftermarket
By Type
- Front suspension
- Rear suspension
By Geography
- APAC
- North America
- Europe
- South America
- Middle East and Africa
This study identifies the growing demand for dual bending valve front fork technology among automotive oems as one of the prime reasons driving the motorcycle suspension systems market growth during the next few years. Also, development of electronic damping control to increase safety quotient and rising adoption of duolever front suspension will lead to sizable demand in the market.
The report on the motorcycle suspension systems market covers the following areas:
- Motorcycle suspension systems market sizing
- Motorcycle suspension systems market forecast
- Motorcycle suspension systems market industry analysis
The robust vendor analysis is designed to help clients improve their market position, and in line with this, this report provides a detailed analysis of several leading motorcycle suspension systems market vendors that include Arnott LLC, Bayerische Motoren Werke AG, BITUBO Srl, Dah Ken Industrial Co. Ltd., Duroshox Pvt. Ltd., Endurance Technologies Ltd., Fox Factory Holding Corp., GP Suspension, Hero MotoCorp Ltd, Hitachi Ltd., K Tech Suspension Ltd., KYB Corp., Matris Srl, Mupo Srl, Nitron Racing Systems Ltd., Penske Racing Shocks, PIERER Mobility AG, Tenneco Inc., TFX Suspension Technology, and ZF Friedrichshafen AG. Also, the motorcycle suspension systems market analysis report includes information on upcoming trends and challenges that will influence market growth. This is to help companies strategize and leverage all forthcoming growth opportunities.
The study was conducted using an objective combination of primary and secondary information including inputs from key participants in the industry. The report contains a comprehensive market and vendor landscape in addition to an analysis of the key vendors.
The publisher presents a detailed picture of the market by the way of study, synthesis, and summation of data from multiple sources by an analysis of key parameters such as profit, pricing, competition, and promotions. It presents various market facets by identifying the key industry influencers. The data presented is comprehensive, reliable, and a result of extensive research - both primary and secondary. The market research reports provide a complete competitive landscape and an in-depth vendor selection methodology and analysis using qualitative and quantitative research to forecast the accurate market growth.
Table of Contents
1 Executive Summary
- 1.1 Market overview
- Executive Summary - Chart on Market Overview
- Executive Summary - Data Table on Market Overview
- Executive Summary - Chart on Global Market Characteristics
- Executive Summary - Chart on Market by Geography
- Executive Summary - Chart on Market Segmentation by Channel
- Executive Summary - Chart on Market Segmentation by Type
- Executive Summary - Chart on Incremental Growth
- Executive Summary - Data Table on Incremental Growth
- Executive Summary - Chart on Company Market Positioning
2 Market Landscape
- 2.1 Market ecosystem
- Parent Market
- Data Table on - Parent Market
- 2.2 Market characteristics
- Market characteristics analysis
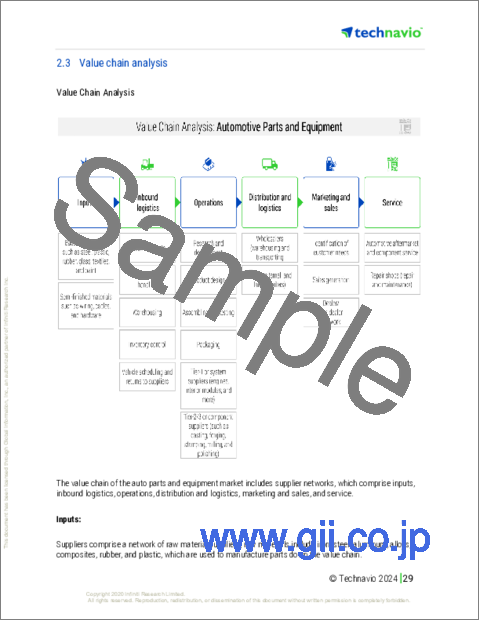
- 2.3 Value chain analysis
- Value Chain Analysis
3 Market Sizing
- 3.1 Market definition
- Offerings of companies included in the market definition
- 3.2 Market segment analysis
- Market segments
- 3.3 Market size 2023
- 3.4 Market outlook: Forecast for 2023-2028
- Chart on Global - Market size and forecast 2023-2028 ($ million)
- Data Table on Global - Market size and forecast 2023-2028 ($ million)
- Chart on Global Market: Year-over-year growth 2023-2028 (%)
- Data Table on Global Market: Year-over-year growth 2023-2028 (%)
4 Historic Market Size
- 4.1 Global Motorcycle Suspension Systems Market 2018 - 2022
- Historic Market Size - Data Table on Global Motorcycle Suspension Systems Market 2018 - 2022 ($ million)
- 4.2 Channel segment analysis 2018 - 2022
- Historic Market Size - Channel Segment 2018 - 2022 ($ million)
- 4.3 Type segment analysis 2018 - 2022
- Historic Market Size - Type Segment 2018 - 2022 ($ million)
- 4.4 Geography segment analysis 2018 - 2022
- Historic Market Size - Geography Segment 2018 - 2022 ($ million)
- 4.5 Country segment analysis 2018 - 2022
- Historic Market Size - Country Segment 2018 - 2022 ($ million)
5 Five Forces Analysis
- 5.1 Five forces summary
- Five forces analysis - Comparison between 2023 and 2028
- 5.2 Bargaining power of buyers
- Bargaining power of buyers - Impact of key factors 2023 and 2028
- 5.3 Bargaining power of suppliers
- Bargaining power of suppliers - Impact of key factors in 2023 and 2028
- 5.4 Threat of new entrants
- Threat of new entrants - Impact of key factors in 2023 and 2028
- 5.5 Threat of substitutes
- Threat of substitutes - Impact of key factors in 2023 and 2028
- 5.6 Threat of rivalry
- Threat of rivalry - Impact of key factors in 2023 and 2028
- 5.7 Market condition
- Chart on Market condition - Five forces 2023 and 2028
6 Market Segmentation by Channel
- 6.1 Market segments
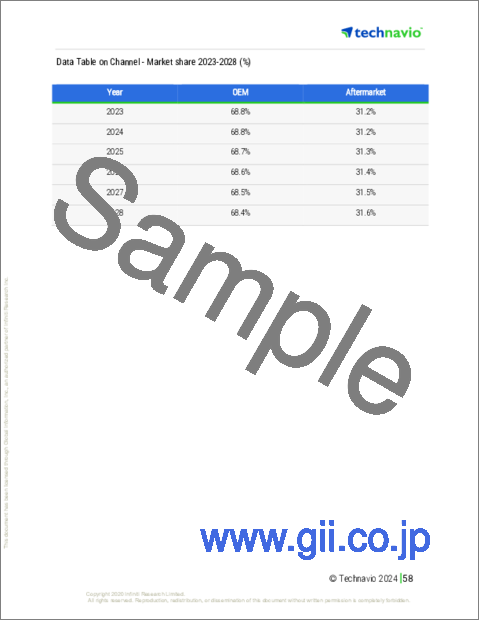
- Chart on Channel - Market share 2023-2028 (%)
- Data Table on Channel - Market share 2023-2028 (%)
- 6.2 Comparison by Channel
- Chart on Comparison by Channel
- Data Table on Comparison by Channel
- 6.3 OEM - Market size and forecast 2023-2028
- Chart on OEM - Market size and forecast 2023-2028 ($ million)
- Data Table on OEM - Market size and forecast 2023-2028 ($ million)
- Chart on OEM - Year-over-year growth 2023-2028 (%)
- Data Table on OEM - Year-over-year growth 2023-2028 (%)
- 6.4 Aftermarket - Market size and forecast 2023-2028
- Chart on Aftermarket - Market size and forecast 2023-2028 ($ million)
- Data Table on Aftermarket - Market size and forecast 2023-2028 ($ million)
- Chart on Aftermarket - Year-over-year growth 2023-2028 (%)
- Data Table on Aftermarket - Year-over-year growth 2023-2028 (%)
- 6.5 Market opportunity by Channel
- Market opportunity by Channel ($ million)
- Data Table on Market opportunity by Channel ($ million)
7 Market Segmentation by Type
- 7.1 Market segments
- Chart on Type - Market share 2023-2028 (%)
- Data Table on Type - Market share 2023-2028 (%)
- 7.2 Comparison by Type
- Chart on Comparison by Type
- Data Table on Comparison by Type
- 7.3 Front suspension - Market size and forecast 2023-2028
- Chart on Front suspension - Market size and forecast 2023-2028 ($ million)
- Data Table on Front suspension - Market size and forecast 2023-2028 ($ million)
- Chart on Front suspension - Year-over-year growth 2023-2028 (%)
- Data Table on Front suspension - Year-over-year growth 2023-2028 (%)
- 7.4 Rear suspension - Market size and forecast 2023-2028
- Chart on Rear suspension - Market size and forecast 2023-2028 ($ million)
- Data Table on Rear suspension - Market size and forecast 2023-2028 ($ million)
- Chart on Rear suspension - Year-over-year growth 2023-2028 (%)
- Data Table on Rear suspension - Year-over-year growth 2023-2028 (%)
- 7.5 Market opportunity by Type
- Market opportunity by Type ($ million)
- Data Table on Market opportunity by Type ($ million)
8 Customer Landscape
- 8.1 Customer landscape overview
- Analysis of price sensitivity, lifecycle, customer purchase basket, adoption rates, and purchase criteria
9 Geographic Landscape
- 9.1 Geographic segmentation
- Chart on Market share By Geographical Landscape2023-2028 (%)
- Data Table on Market share By Geographical Landscape2023-2028 (%)
- 9.2 Geographic comparison
- Chart on Geographic comparison
- Data Table on Geographic comparison
- 9.3 APAC - Market size and forecast 2023-2028
- Chart on APAC - Market size and forecast 2023-2028 ($ million)
- Data Table on APAC - Market size and forecast 2023-2028 ($ million)
- Chart on APAC - Year-over-year growth 2023-2028 (%)
- Data Table on APAC - Year-over-year growth 2023-2028 (%)
- 9.4 North America - Market size and forecast 2023-2028
- Chart on North America - Market size and forecast 2023-2028 ($ million)
- Data Table on North America - Market size and forecast 2023-2028 ($ million)
- Chart on North America - Year-over-year growth 2023-2028 (%)
- Data Table on North America - Year-over-year growth 2023-2028 (%)
- 9.5 Europe - Market size and forecast 2023-2028
- Chart on Europe - Market size and forecast 2023-2028 ($ million)
- Data Table on Europe - Market size and forecast 2023-2028 ($ million)
- Chart on Europe - Year-over-year growth 2023-2028 (%)
- Data Table on Europe - Year-over-year growth 2023-2028 (%)
- 9.6 South America - Market size and forecast 2023-2028
- Chart on South America - Market size and forecast 2023-2028 ($ million)
- Data Table on South America - Market size and forecast 2023-2028 ($ million)
- Chart on South America - Year-over-year growth 2023-2028 (%)
- Data Table on South America - Year-over-year growth 2023-2028 (%)
- 9.7 Middle East and Africa - Market size and forecast 2023-2028
- Chart on Middle East and Africa - Market size and forecast 2023-2028 ($ million)
- Data Table on Middle East and Africa - Market size and forecast 2023-2028 ($ million)
- Chart on Middle East and Africa - Year-over-year growth 2023-2028 (%)
- Data Table on Middle East and Africa - Year-over-year growth 2023-2028 (%)
- 9.8 China - Market size and forecast 2023-2028
- Chart on China - Market size and forecast 2023-2028 ($ million)
- Data Table on China - Market size and forecast 2023-2028 ($ million)
- Chart on China - Year-over-year growth 2023-2028 (%)
- Data Table on China - Year-over-year growth 2023-2028 (%)
- 9.9 India - Market size and forecast 2023-2028
- Chart on India - Market size and forecast 2023-2028 ($ million)
- Data Table on India - Market size and forecast 2023-2028 ($ million)
- Chart on India - Year-over-year growth 2023-2028 (%)
- Data Table on India - Year-over-year growth 2023-2028 (%)
- 9.10 Indonesia - Market size and forecast 2023-2028
- Chart on Indonesia - Market size and forecast 2023-2028 ($ million)
- Data Table on Indonesia - Market size and forecast 2023-2028 ($ million)
- Chart on Indonesia - Year-over-year growth 2023-2028 (%)
- Data Table on Indonesia - Year-over-year growth 2023-2028 (%)
- 9.11 Thailand - Market size and forecast 2023-2028
- Chart on Thailand - Market size and forecast 2023-2028 ($ million)
- Data Table on Thailand - Market size and forecast 2023-2028 ($ million)
- Chart on Thailand - Year-over-year growth 2023-2028 (%)
- Data Table on Thailand - Year-over-year growth 2023-2028 (%)
- 9.12 US - Market size and forecast 2023-2028
- Chart on US - Market size and forecast 2023-2028 ($ million)
- Data Table on US - Market size and forecast 2023-2028 ($ million)
- Chart on US - Year-over-year growth 2023-2028 (%)
- Data Table on US - Year-over-year growth 2023-2028 (%)
- 9.13 Market opportunity by geography
- Market opportunity By Geographical Landscape($ million)
- Data Tables on Market opportunity By Geographical Landscape($ million)
10 Drivers, Challenges, and Opportunity/Restraints
- 10.1 Market drivers
- 10.2 Market challenges
- 10.3 Impact of drivers and challenges
- Impact of drivers and challenges in 2023 and 2028
- 10.4 Market opportunities/restraints
11 Competitive Landscape
- 11.1 Overview
- 11.2 Competitive Landscape
- Overview on criticality of inputs and factors of differentiation
- 11.3 Landscape disruption
- Overview on factors of disruption
- 11.4 Industry risks
- Impact of key risks on business
12 Competitive Analysis
- 12.1 Companies profiled
- Companies covered
- 12.2 Market positioning of companies
- Matrix on companies position and classification
- 12.3 Bayerische Motoren Werke AG
- Bayerische Motoren Werke AG - Overview
- Bayerische Motoren Werke AG - Business segments
- Bayerische Motoren Werke AG - Key news
- Bayerische Motoren Werke AG - Key offerings
- Bayerische Motoren Werke AG - Segment focus
- 12.4 Duroshox Pvt. Ltd.
- Duroshox Pvt. Ltd. - Overview
- Duroshox Pvt. Ltd. - Product / Service
- Duroshox Pvt. Ltd. - Key offerings
- 12.5 Endurance Technologies Ltd.
- Endurance Technologies Ltd. - Overview
- Endurance Technologies Ltd. - Product / Service
- Endurance Technologies Ltd. - Key offerings
- 12.6 Fox Factory Holding Corp.
- Fox Factory Holding Corp. - Overview
- Fox Factory Holding Corp. - Product / Service
- Fox Factory Holding Corp. - Key offerings
- 12.7 Hero MotoCorp Ltd
- Hero MotoCorp Ltd - Overview
- Hero MotoCorp Ltd - Product / Service
- Hero MotoCorp Ltd - Key offerings
- 12.8 Hitachi Ltd.
- Hitachi Ltd. - Overview
- Hitachi Ltd. - Business segments
- Hitachi Ltd. - Key news
- Hitachi Ltd. - Key offerings
- Hitachi Ltd. - Segment focus
- 12.9 KYB Corp.
- KYB Corp. - Overview
- KYB Corp. - Business segments
- KYB Corp. - Key offerings
- KYB Corp. - Segment focus
- 12.10 Matris Srl
- Matris Srl - Overview
- Matris Srl - Product / Service
- Matris Srl - Key offerings
- 12.11 Mupo Srl
- Mupo Srl - Overview
- Mupo Srl - Product / Service
- Mupo Srl - Key offerings
- 12.12 Nitron Racing Systems Ltd.
- Nitron Racing Systems Ltd. - Overview
- Nitron Racing Systems Ltd. - Product / Service
- Nitron Racing Systems Ltd. - Key offerings
- 12.13 Penske Racing Shocks
- Penske Racing Shocks - Overview
- Penske Racing Shocks - Product / Service
- Penske Racing Shocks - Key offerings
- 12.14 PIERER Mobility AG
- PIERER Mobility AG - Overview
- PIERER Mobility AG - Business segments
- PIERER Mobility AG - Key offerings
- PIERER Mobility AG - Segment focus
- 12.15 Tenneco Inc.
- Tenneco Inc. - Overview
- Tenneco Inc. - Product / Service
- Tenneco Inc. - Key news
- Tenneco Inc. - Key offerings
- 12.16 TFX Suspension Technology
- TFX Suspension Technology - Overview
- TFX Suspension Technology - Product / Service
- TFX Suspension Technology - Key offerings
- 12.17 ZF Friedrichshafen AG
- ZF Friedrichshafen AG - Overview
- ZF Friedrichshafen AG - Business segments
- ZF Friedrichshafen AG - Key news
- ZF Friedrichshafen AG - Key offerings
- ZF Friedrichshafen AG - Segment focus
13 Appendix
- 13.1 Scope of the report
- 13.2 Inclusions and exclusions checklist
- Inclusions checklist
- Exclusions checklist
- 13.3 Currency conversion rates for US$
- Currency conversion rates for US$
- 13.4 Research methodology
- Research methodology
- 13.5 Data procurement
- Information sources
- 13.6 Data validation
- Data validation
- 13.7 Validation techniques employed for market sizing
- Validation techniques employed for market sizing
- 13.8 Data synthesis
- Data synthesis
- 13.9 360 degree market analysis
- 360 degree market analysis
- 13.10 List of abbreviations
- List of abbreviations
