|
|
市場調査レポート
商品コード
1719403
フェイスクリームの世界市場 2025~2029年Global Face Cream Market 2025-2029 |
||||||
|
|||||||
カスタマイズ可能
|
|||||||


| フェイスクリームの世界市場 2025~2029年 |
|
出版日: 2025年04月17日
発行: TechNavio
ページ情報: 英文 233 Pages
納期: 即納可能
|

全表示
- 概要
- 図表
- 目次
フェイスクリーム市場は2024-2029年に133億1,480万米ドル、予測期間中のCAGRは5.4%で成長すると予測されます。
この調査レポートは、フェイスクリーム市場の全体分析、市場規模・予測、動向、成長促進要因、課題、約25のベンダーを網羅したベンダー分析などを掲載しています。
現在の市場シナリオ、最新動向と促進要因、市場環境全体に関する最新分析を提供しています。市場は、天然およびオーガニックのフェイスクリームに対する需要の高まり、特殊なフェイスクリームの入手可能性の増加、オンライン販売の急成長によって牽引されています。
| 市場範囲 | |
|---|---|
| 基準年 | 2025 |
| 終了年 | 2029 |
| 予測期間 | 2025-2029 |
| 成長モメンタム | 加速 |
| 前年比2025年 | 5% |
| CAGR | 5.4% |
| 増分額 | 133億1,480万米ドル |
本調査は、業界の主要参加者からのインプットを含め、一次情報と二次情報を客観的に組み合わせて実施しました。レポートには、主要企業の分析に加え、包括的な市場規模データ、地域分析によるセグメント、ベンダー情勢が含まれています。レポートには過去データと予測データがあります。
本調査では、今後数年間におけるフェイスクリーム市場の成長を促進する主な要因の1つとして、製品のパーソナライゼーションやカスタマイズが重視されるようになっていることを挙げています。また、ソーシャルメディアのインフルエンサーの台頭と多機能スキンケア製品への需要の高まりは、市場の大きな需要につながります。
目次
第1章 エグゼクティブサマリー
- 市場概要
第2章 Technavio分析
- 価格・ライフサイクル・顧客購入バスケット・採用率・購入基準の分析
- インプットの重要性と差別化の要因
- 混乱の要因
- 促進要因と課題の影響
第3章 市場情勢
- 市場エコシステム
- 市場の特徴
- バリューチェーン分析
第4章 市場規模
- 市場の定義
- 市場セグメント分析
- 市場規模 2024
- 市場の見通し 2024-2029
第5章 市場規模実績
- フェイスクリームの世界市場 2019-2023
- 製品別セグメント分析 2019-2023
- 流通チャネル別セグメント分析 2019-2023
- 用途別セグメント分析 2019-2023
- エンドユーザー別セグメント分析 2019-2023
- 地域別セグメント分析 2019-2023
- 国別セグメント分析 2019-2023
第6章 定性分析
- AIの影響:フェイスクリームの世界市場
第7章 ファイブフォース分析
- ファイブフォースの要約
- 買い手の交渉力
- 供給企業の交渉力
- 新規参入業者の脅威
- 代替品の脅威
- 競争の脅威
- 市況
第8章 市場セグメンテーション:製品別
- 市場セグメント
- 比較:製品別
- アンチエイジングクリーム:市場規模と予測 2024-2029
- 美白・日焼け止めクリーム:市場規模と予測 2024-2029
- 保湿剤とニキビ予防クリーム:市場規模と予測 2024-2029
- 市場機会:製品別
第9章 市場セグメンテーション:流通チャネル別
- 市場セグメント
- 比較:流通チャネル別
- オフライン:市場規模と予測 2024-2029
- オンライン:市場規模と予測 2024-2029
- 市場機会:流通チャネル別
第10章 市場セグメンテーション:用途別
- 市場セグメント
- 比較:用途別
- 敏感肌:市場規模と予測 2024-2029
- 乾燥肌:市場規模と予測 2024-2029
- ニュートラルスキン:市場規模と予測 2024-2029
- 脂性肌:市場規模と予測 2024-2029
- 市場機会:用途別
第11章 市場セグメンテーション:エンドユーザー別
- 市場セグメント
- 比較:エンドユーザー別
- 女性:市場規模と予測 2024-2029
- 男性:市場規模と予測 2024-2029
- 市場機会:エンドユーザー別
第12章 顧客情勢
- 顧客情勢の概要
第13章 地域別情勢
- 地域別セグメンテーション
- 地域別比較
- アジア太平洋:市場規模と予測 2024-2029
- 北米:市場規模と予測 2024-2029
- 欧州:市場規模と予測 2024-2029
- 南米:市場規模と予測 2024-2029
- 中東・アフリカ:市場規模と予測 2024-2029
- 中国:市場規模と予測 2024-2029
- 米国:市場規模と予測 2024-2029
- 日本:市場規模と予測 2024-2029
- インド:市場規模と予測 2024-2029
- ドイツ:市場規模と予測 2024-2029
- カナダ:市場規模と予測 2024-2029
- 韓国:市場規模と予測 2024-2029
- オーストラリア:市場規模と予測 2024-2029
- 英国:市場規模と予測 2024-2029
- フランス:市場規模と予測 2024-2029
- 市場機会:地域情勢別
第14章 促進要因・課題・機会・抑制要因
- 市場促進要因
- 市場の課題
- 促進要因と課題の影響
- 市場の機会・抑制要因
第15章 競合情勢
- 概要
- 競合情勢
- 混乱の状況
- 業界のリスク
第16章 競合分析
- 企業プロファイル
- 企業ランキング指数
- 企業の市場ポジショニング
- Amway Corp.
- Avon Products
- Beiersdorf AG
- Johnson and Johnson Services Inc.
- Kao Corp.
- Libby Laboratories Inc.
- LOreal SA
- Lotus Herbals Pvt. Ltd.
- Oriflame Cosmetics S.A.
- Shiseido Co. Ltd.
- The Body Shop
- The Estee Lauder Co. Inc.
- The Himalaya Drug Co.
- The Procter and Gamble Co.
- Unilever PLC
第17章 付録
Exhibits:
- Exhibits1: Executive Summary - Chart on Market Overview
- Exhibits2: Executive Summary - Data Table on Market Overview
- Exhibits3: Executive Summary - Chart on Global Market Characteristics
- Exhibits4: Executive Summary - Chart on Market By Geographical Landscape
- Exhibits5: Executive Summary - Chart on Market Segmentation by Product
- Exhibits6: Executive Summary - Chart on Market Segmentation by Distribution Channel
- Exhibits7: Executive Summary - Chart on Market Segmentation by Application
- Exhibits8: Executive Summary - Chart on Market Segmentation by End-user
- Exhibits9: Executive Summary - Chart on Incremental Growth
- Exhibits10: Executive Summary - Data Table on Incremental Growth
- Exhibits11: Executive Summary - Chart on Company Market Positioning
- Exhibits12: Analysis of price sensitivity, lifecycle, customer purchase basket, adoption rates, and purchase criteria
- Exhibits13: Overview on criticality of inputs and factors of differentiation
- Exhibits14: Overview on factors of disruption
- Exhibits15: Impact of drivers and challenges in 2024 and 2029
- Exhibits16: Parent Market
- Exhibits17: Data Table on - Parent Market
- Exhibits18: Market characteristics analysis
- Exhibits19: Value chain analysis
- Exhibits20: Offerings of companies included in the market definition
- Exhibits21: Market segments
- Exhibits22: Chart on Global - Market size and forecast 2024-2029 ($ million)
- Exhibits23: Data Table on Global - Market size and forecast 2024-2029 ($ million)
- Exhibits24: Chart on Global Market: Year-over-year growth 2024-2029 (%)
- Exhibits25: Data Table on Global Market: Year-over-year growth 2024-2029 (%)
- Exhibits26: Historic Market Size - Data Table on Global Face Cream Market 2019 - 2023 ($ million)
- Exhibits27: Historic Market Size - Product Segment 2019 - 2023 ($ million)
- Exhibits28: Historic Market Size - Distribution Channel Segment 2019 - 2023 ($ million)
- Exhibits29: Historic Market Size - Application Segment 2019 - 2023 ($ million)
- Exhibits30: Historic Market Size - End-user Segment 2019 - 2023 ($ million)
- Exhibits31: Historic Market Size - Geography Segment 2019 - 2023 ($ million)
- Exhibits32: Historic Market Size - Country Segment 2019 - 2023 ($ million)
- Exhibits33: Five forces analysis - Comparison between 2024 and 2029
- Exhibits34: Bargaining power of buyers - Impact of key factors 2024 and 2029
- Exhibits35: Bargaining power of suppliers - Impact of key factors in 2024 and 2029
- Exhibits36: Threat of new entrants - Impact of key factors in 2024 and 2029
- Exhibits37: Threat of substitutes - Impact of key factors in 2024 and 2029
- Exhibits38: Threat of rivalry - Impact of key factors in 2024 and 2029
- Exhibits39: Chart on Market condition - Five forces 2024 and 2029
- Exhibits40: Chart on Product - Market share 2024-2029 (%)
- Exhibits41: Data Table on Product - Market share 2024-2029 (%)
- Exhibits42: Chart on Comparison by Product
- Exhibits43: Data Table on Comparison by Product
- Exhibits44: Chart on Anti-aging cream - Market size and forecast 2024-2029 ($ million)
- Exhibits45: Data Table on Anti-aging cream - Market size and forecast 2024-2029 ($ million)
- Exhibits46: Chart on Anti-aging cream - Year-over-year growth 2024-2029 (%)
- Exhibits47: Data Table on Anti-aging cream - Year-over-year growth 2024-2029 (%)
- Exhibits48: Chart on Skin whitening and sun protection cream - Market size and forecast 2024-2029 ($ million)
- Exhibits49: Data Table on Skin whitening and sun protection cream - Market size and forecast 2024-2029 ($ million)
- Exhibits50: Chart on Skin whitening and sun protection cream - Year-over-year growth 2024-2029 (%)
- Exhibits51: Data Table on Skin whitening and sun protection cream - Year-over-year growth 2024-2029 (%)
- Exhibits52: Chart on Moisturizer and anti-acne cream - Market size and forecast 2024-2029 ($ million)
- Exhibits53: Data Table on Moisturizer and anti-acne cream - Market size and forecast 2024-2029 ($ million)
- Exhibits54: Chart on Moisturizer and anti-acne cream - Year-over-year growth 2024-2029 (%)
- Exhibits55: Data Table on Moisturizer and anti-acne cream - Year-over-year growth 2024-2029 (%)
- Exhibits56: Market opportunity by Product ($ million)
- Exhibits57: Data Table on Market opportunity by Product ($ million)
- Exhibits58: Chart on Distribution Channel - Market share 2024-2029 (%)
- Exhibits59: Data Table on Distribution Channel - Market share 2024-2029 (%)
- Exhibits60: Chart on Comparison by Distribution Channel
- Exhibits61: Data Table on Comparison by Distribution Channel
- Exhibits62: Chart on Offline - Market size and forecast 2024-2029 ($ million)
- Exhibits63: Data Table on Offline - Market size and forecast 2024-2029 ($ million)
- Exhibits64: Chart on Offline - Year-over-year growth 2024-2029 (%)
- Exhibits65: Data Table on Offline - Year-over-year growth 2024-2029 (%)
- Exhibits66: Chart on Online - Market size and forecast 2024-2029 ($ million)
- Exhibits67: Data Table on Online - Market size and forecast 2024-2029 ($ million)
- Exhibits68: Chart on Online - Year-over-year growth 2024-2029 (%)
- Exhibits69: Data Table on Online - Year-over-year growth 2024-2029 (%)
- Exhibits70: Market opportunity by Distribution Channel ($ million)
- Exhibits71: Data Table on Market opportunity by Distribution Channel ($ million)
- Exhibits72: Chart on Application - Market share 2024-2029 (%)
- Exhibits73: Data Table on Application - Market share 2024-2029 (%)
- Exhibits74: Chart on Comparison by Application
- Exhibits75: Data Table on Comparison by Application
- Exhibits76: Chart on Sensitive skin - Market size and forecast 2024-2029 ($ million)
- Exhibits77: Data Table on Sensitive skin - Market size and forecast 2024-2029 ($ million)
- Exhibits78: Chart on Sensitive skin - Year-over-year growth 2024-2029 (%)
- Exhibits79: Data Table on Sensitive skin - Year-over-year growth 2024-2029 (%)
- Exhibits80: Chart on Dry skin - Market size and forecast 2024-2029 ($ million)
- Exhibits81: Data Table on Dry skin - Market size and forecast 2024-2029 ($ million)
- Exhibits82: Chart on Dry skin - Year-over-year growth 2024-2029 (%)
- Exhibits83: Data Table on Dry skin - Year-over-year growth 2024-2029 (%)
- Exhibits84: Chart on Neutral skin - Market size and forecast 2024-2029 ($ million)
- Exhibits85: Data Table on Neutral skin - Market size and forecast 2024-2029 ($ million)
- Exhibits86: Chart on Neutral skin - Year-over-year growth 2024-2029 (%)
- Exhibits87: Data Table on Neutral skin - Year-over-year growth 2024-2029 (%)
- Exhibits88: Chart on Oily skin - Market size and forecast 2024-2029 ($ million)
- Exhibits89: Data Table on Oily skin - Market size and forecast 2024-2029 ($ million)
- Exhibits90: Chart on Oily skin - Year-over-year growth 2024-2029 (%)
- Exhibits91: Data Table on Oily skin - Year-over-year growth 2024-2029 (%)
- Exhibits92: Market opportunity by Application ($ million)
- Exhibits93: Data Table on Market opportunity by Application ($ million)
- Exhibits94: Chart on End-user - Market share 2024-2029 (%)
- Exhibits95: Data Table on End-user - Market share 2024-2029 (%)
- Exhibits96: Chart on Comparison by End-user
- Exhibits97: Data Table on Comparison by End-user
- Exhibits98: Chart on Female - Market size and forecast 2024-2029 ($ million)
- Exhibits99: Data Table on Female - Market size and forecast 2024-2029 ($ million)
- Exhibits100: Chart on Female - Year-over-year growth 2024-2029 (%)
- Exhibits101: Data Table on Female - Year-over-year growth 2024-2029 (%)
- Exhibits102: Chart on Male - Market size and forecast 2024-2029 ($ million)
- Exhibits103: Data Table on Male - Market size and forecast 2024-2029 ($ million)
- Exhibits104: Chart on Male - Year-over-year growth 2024-2029 (%)
- Exhibits105: Data Table on Male - Year-over-year growth 2024-2029 (%)
- Exhibits106: Market opportunity by End-user ($ million)
- Exhibits107: Data Table on Market opportunity by End-user ($ million)
- Exhibits108: Analysis of price sensitivity, lifecycle, customer purchase basket, adoption rates, and purchase criteria
- Exhibits109: Chart on Market share By Geographical Landscape 2024-2029 (%)
- Exhibits110: Data Table on Market share By Geographical Landscape 2024-2029 (%)
- Exhibits111: Chart on Geographic comparison
- Exhibits112: Data Table on Geographic comparison
- Exhibits113: Chart on APAC - Market size and forecast 2024-2029 ($ million)
- Exhibits114: Data Table on APAC - Market size and forecast 2024-2029 ($ million)
- Exhibits115: Chart on APAC - Year-over-year growth 2024-2029 (%)
- Exhibits116: Data Table on APAC - Year-over-year growth 2024-2029 (%)
- Exhibits117: Chart on North America - Market size and forecast 2024-2029 ($ million)
- Exhibits118: Data Table on North America - Market size and forecast 2024-2029 ($ million)
- Exhibits119: Chart on North America - Year-over-year growth 2024-2029 (%)
- Exhibits120: Data Table on North America - Year-over-year growth 2024-2029 (%)
- Exhibits121: Chart on Europe - Market size and forecast 2024-2029 ($ million)
- Exhibits122: Data Table on Europe - Market size and forecast 2024-2029 ($ million)
- Exhibits123: Chart on Europe - Year-over-year growth 2024-2029 (%)
- Exhibits124: Data Table on Europe - Year-over-year growth 2024-2029 (%)
- Exhibits125: Chart on South America - Market size and forecast 2024-2029 ($ million)
- Exhibits126: Data Table on South America - Market size and forecast 2024-2029 ($ million)
- Exhibits127: Chart on South America - Year-over-year growth 2024-2029 (%)
- Exhibits128: Data Table on South America - Year-over-year growth 2024-2029 (%)
- Exhibits129: Chart on Middle East and Africa - Market size and forecast 2024-2029 ($ million)
- Exhibits130: Data Table on Middle East and Africa - Market size and forecast 2024-2029 ($ million)
- Exhibits131: Chart on Middle East and Africa - Year-over-year growth 2024-2029 (%)
- Exhibits132: Data Table on Middle East and Africa - Year-over-year growth 2024-2029 (%)
- Exhibits133: Chart on China - Market size and forecast 2024-2029 ($ million)
- Exhibits134: Data Table on China - Market size and forecast 2024-2029 ($ million)
- Exhibits135: Chart on China - Year-over-year growth 2024-2029 (%)
- Exhibits136: Data Table on China - Year-over-year growth 2024-2029 (%)
- Exhibits137: Chart on US - Market size and forecast 2024-2029 ($ million)
- Exhibits138: Data Table on US - Market size and forecast 2024-2029 ($ million)
- Exhibits139: Chart on US - Year-over-year growth 2024-2029 (%)
- Exhibits140: Data Table on US - Year-over-year growth 2024-2029 (%)
- Exhibits141: Chart on Japan - Market size and forecast 2024-2029 ($ million)
- Exhibits142: Data Table on Japan - Market size and forecast 2024-2029 ($ million)
- Exhibits143: Chart on Japan - Year-over-year growth 2024-2029 (%)
- Exhibits144: Data Table on Japan - Year-over-year growth 2024-2029 (%)
- Exhibits145: Chart on India - Market size and forecast 2024-2029 ($ million)
- Exhibits146: Data Table on India - Market size and forecast 2024-2029 ($ million)
- Exhibits147: Chart on India - Year-over-year growth 2024-2029 (%)
- Exhibits148: Data Table on India - Year-over-year growth 2024-2029 (%)
- Exhibits149: Chart on Germany - Market size and forecast 2024-2029 ($ million)
- Exhibits150: Data Table on Germany - Market size and forecast 2024-2029 ($ million)
- Exhibits151: Chart on Germany - Year-over-year growth 2024-2029 (%)
- Exhibits152: Data Table on Germany - Year-over-year growth 2024-2029 (%)
- Exhibits153: Chart on Canada - Market size and forecast 2024-2029 ($ million)
- Exhibits154: Data Table on Canada - Market size and forecast 2024-2029 ($ million)
- Exhibits155: Chart on Canada - Year-over-year growth 2024-2029 (%)
- Exhibits156: Data Table on Canada - Year-over-year growth 2024-2029 (%)
- Exhibits157: Chart on South Korea - Market size and forecast 2024-2029 ($ million)
- Exhibits158: Data Table on South Korea - Market size and forecast 2024-2029 ($ million)
- Exhibits159: Chart on South Korea - Year-over-year growth 2024-2029 (%)
- Exhibits160: Data Table on South Korea - Year-over-year growth 2024-2029 (%)
- Exhibits161: Chart on Australia - Market size and forecast 2024-2029 ($ million)
- Exhibits162: Data Table on Australia - Market size and forecast 2024-2029 ($ million)
- Exhibits163: Chart on Australia - Year-over-year growth 2024-2029 (%)
- Exhibits164: Data Table on Australia - Year-over-year growth 2024-2029 (%)
- Exhibits165: Chart on UK - Market size and forecast 2024-2029 ($ million)
- Exhibits166: Data Table on UK - Market size and forecast 2024-2029 ($ million)
- Exhibits167: Chart on UK - Year-over-year growth 2024-2029 (%)
- Exhibits168: Data Table on UK - Year-over-year growth 2024-2029 (%)
- Exhibits169: Chart on France - Market size and forecast 2024-2029 ($ million)
- Exhibits170: Data Table on France - Market size and forecast 2024-2029 ($ million)
- Exhibits171: Chart on France - Year-over-year growth 2024-2029 (%)
- Exhibits172: Data Table on France - Year-over-year growth 2024-2029 (%)
- Exhibits173: Market opportunity By Geographical Landscape ($ million)
- Exhibits174: Data Tables on Market opportunity By Geographical Landscape ($ million)
- Exhibits175: Impact of drivers and challenges in 2024 and 2029
- Exhibits176: Overview on criticality of inputs and factors of differentiation
- Exhibits177: Overview on factors of disruption
- Exhibits178: Impact of key risks on business
- Exhibits179: Companies covered
- Exhibits180: Company ranking index
- Exhibits181: Matrix on companies position and classification
- Exhibits182: Amway Corp. - Overview
- Exhibits183: Amway Corp. - Product / Service
- Exhibits184: Amway Corp. - Key news
- Exhibits185: Amway Corp. - Key offerings
- Exhibits186: SWOT
- Exhibits187: Avon Products - Overview
- Exhibits188: Avon Products - Product / Service
- Exhibits189: Avon Products - Key offerings
- Exhibits190: SWOT
- Exhibits191: Beiersdorf AG - Overview
- Exhibits192: Beiersdorf AG - Business segments
- Exhibits193: Beiersdorf AG - Key news
- Exhibits194: Beiersdorf AG - Key offerings
- Exhibits195: Beiersdorf AG - Segment focus
- Exhibits196: SWOT
- Exhibits197: Johnson and Johnson Services Inc. - Overview
- Exhibits198: Johnson and Johnson Services Inc. - Business segments
- Exhibits199: Johnson and Johnson Services Inc. - Key news
- Exhibits200: Johnson and Johnson Services Inc. - Key offerings
- Exhibits201: Johnson and Johnson Services Inc. - Segment focus
- Exhibits202: SWOT
- Exhibits203: Kao Corp. - Overview
- Exhibits204: Kao Corp. - Business segments
- Exhibits205: Kao Corp. - Key news
- Exhibits206: Kao Corp. - Key offerings
- Exhibits207: Kao Corp. - Segment focus
- Exhibits208: SWOT
- Exhibits209: Libby Laboratories Inc. - Overview
- Exhibits210: Libby Laboratories Inc. - Product / Service
- Exhibits211: Libby Laboratories Inc. - Key offerings
- Exhibits212: SWOT
- Exhibits213: LOreal SA - Overview
- Exhibits214: LOreal SA - Business segments
- Exhibits215: LOreal SA - Key news
- Exhibits216: LOreal SA - Key offerings
- Exhibits217: LOreal SA - Segment focus
- Exhibits218: SWOT
- Exhibits219: Lotus Herbals Pvt. Ltd. - Overview
- Exhibits220: Lotus Herbals Pvt. Ltd. - Product / Service
- Exhibits221: Lotus Herbals Pvt. Ltd. - Key offerings
- Exhibits222: SWOT
- Exhibits223: Oriflame Cosmetics S.A. - Overview
- Exhibits224: Oriflame Cosmetics S.A. - Product / Service
- Exhibits225: Oriflame Cosmetics S.A. - Key offerings
- Exhibits226: SWOT
- Exhibits227: Shiseido Co. Ltd. - Overview
- Exhibits228: Shiseido Co. Ltd. - Business segments
- Exhibits229: Shiseido Co. Ltd. - Key news
- Exhibits230: Shiseido Co. Ltd. - Key offerings
- Exhibits231: Shiseido Co. Ltd. - Segment focus
- Exhibits232: SWOT
- Exhibits233: The Body Shop - Overview
- Exhibits234: The Body Shop - Product / Service
- Exhibits235: The Body Shop - Key offerings
- Exhibits236: SWOT
- Exhibits237: The Estee Lauder Co. Inc. - Overview
- Exhibits238: The Estee Lauder Co. Inc. - Product / Service
- Exhibits239: The Estee Lauder Co. Inc. - Key news
- Exhibits240: The Estee Lauder Co. Inc. - Key offerings
- Exhibits241: SWOT
- Exhibits242: The Himalaya Drug Co. - Overview
- Exhibits243: The Himalaya Drug Co. - Product / Service
- Exhibits244: The Himalaya Drug Co. - Key offerings
- Exhibits245: SWOT
- Exhibits246: The Procter and Gamble Co. - Overview
- Exhibits247: The Procter and Gamble Co. - Business segments
- Exhibits248: The Procter and Gamble Co. - Key offerings
- Exhibits249: The Procter and Gamble Co. - Segment focus
- Exhibits250: SWOT
- Exhibits251: Unilever PLC - Overview
- Exhibits252: Unilever PLC - Business segments
- Exhibits253: Unilever PLC - Key offerings
- Exhibits254: Unilever PLC - Segment focus
- Exhibits255: SWOT
- Exhibits256: Inclusions checklist
- Exhibits257: Exclusions checklist
- Exhibits258: Currency conversion rates for US$
- Exhibits259: Research methodology
- Exhibits260: Information sources
- Exhibits261: Data validation
- Exhibits262: Validation techniques employed for market sizing
- Exhibits263: Data synthesis
- Exhibits264: 360 degree market analysis
- Exhibits265: List of abbreviations
The face cream market is forecasted to grow by USD 13314.8 mn during 2024-2029, accelerating at a CAGR of 5.4% during the forecast period. The report on the face cream market provides a holistic analysis, market size and forecast, trends, growth drivers, and challenges, as well as vendor analysis covering around 25 vendors.
The report offers an up-to-date analysis regarding the current market scenario, the latest trends and drivers, and the overall market environment. The market is driven by rising demand for natural and organic face creams, increased availability of specialized face creams, and rapid growth in online sales.
| Market Scope | |
|---|---|
| Base Year | 2025 |
| End Year | 2029 |
| Series Year | 2025-2029 |
| Growth Momentum | Accelerate |
| YOY 2025 | 5% |
| CAGR | 5.4% |
| Incremental Value | $13314.8 mn |
The study was conducted using an objective combination of primary and secondary information including inputs from key participants in the industry. The report contains a comprehensive market size data, segment with regional analysis and vendor landscape in addition to an analysis of the key companies. Reports have historic and forecast data.
Technavio's face cream market is segmented as below:
By Product
- Anti-aging cream
- Skin whitening and sun protection cream
- Moisturizer and anti-acne cream
By Distribution Channel
- Offline
- Online
By Application
- Sensitive skin
- Dry skin
- Neutral skin
- Oily skin
By End-user
- Female
- Male
By Geographical Landscape
- APAC
- North America
- Europe
- South America
- Middle East and Africa
This study identifies the rising emphasis on product personalization and customization as one of the prime reasons driving the face cream market growth during the next few years. Also, growing prominence of social media influencers and rising demand for multifunctional skincare products will lead to sizable demand in the market.
The report on the face cream market covers the following areas:
- Face Cream Market sizing
- Face Cream Market forecast
- Face Cream Market industry analysis
The robust vendor analysis is designed to help clients improve their market position, and in line with this, this report provides a detailed analysis of several leading face cream market vendors that include Amway Corp., Avon Products, Beiersdorf AG, International Laboratories Corp. Ltd., Johnson and Johnson Services Inc., Kao Corp., Libby Laboratories Inc., LOreal SA, Lotus Herbals Pvt. Ltd., Oriflame Cosmetics S.A., RB Health US LLC, Reviderm AG, Shiseido Co. Ltd., The Body Shop, The Estee Lauder Co. Inc., The Himalaya Drug Co., The Natures Co., The Procter and Gamble Co., Unilever PLC, and Verona Products Professional Sp. z o.o.. Also, the face cream market analysis report includes information on upcoming trends and challenges that will influence market growth. This is to help companies strategize and leverage all forthcoming growth opportunities.
The publisher presents a detailed picture of the market by the way of study, synthesis, and summation of data from multiple sources by an analysis of key parameters such as profit, pricing, competition, and promotions. It presents various market facets by identifying the key industry influencers. The data presented is comprehensive, reliable, and a result of extensive primary and secondary research. The market research reports provide a complete competitive landscape and an in-depth vendor selection methodology and analysis using qualitative and quantitative research to forecast accurate market growth.
Table of Contents
1 Executive Summary
- 1.1 Market overview
- Executive Summary - Chart on Market Overview
- Executive Summary - Data Table on Market Overview
- Executive Summary - Chart on Global Market Characteristics
- Executive Summary - Chart on Market By Geographical Landscape
- Executive Summary - Chart on Market Segmentation by Product
- Executive Summary - Chart on Market Segmentation by Distribution Channel
- Executive Summary - Chart on Market Segmentation by Application
- Executive Summary - Chart on Market Segmentation by End-user
- Executive Summary - Chart on Incremental Growth
- Executive Summary - Data Table on Incremental Growth
- Executive Summary - Chart on Company Market Positioning
2 Technavio Analysis
- 2.1 Analysis of price sensitivity, lifecycle, customer purchase basket, adoption rates, and purchase criteria
- Analysis of price sensitivity, lifecycle, customer purchase basket, adoption rates, and purchase criteria
- 2.2 Criticality of inputs and Factors of differentiation
- Overview on criticality of inputs and factors of differentiation
- 2.3 Factors of disruption
- Overview on factors of disruption
- 2.4 Impact of drivers and challenges
- Impact of drivers and challenges in 2024 and 2029
3 Market Landscape
- 3.1 Market ecosystem
- Parent Market
- Data Table on - Parent Market
- 3.2 Market characteristics
- Market characteristics analysis
- 3.3 Value chain analysis
- Value chain analysis
4 Market Sizing
- 4.1 Market definition
- Offerings of companies included in the market definition
- 4.2 Market segment analysis
- Market segments
- 4.3 Market size 2024
- 4.4 Market outlook: Forecast for 2024-2029
- Chart on Global - Market size and forecast 2024-2029 ($ million)
- Data Table on Global - Market size and forecast 2024-2029 ($ million)
- Chart on Global Market: Year-over-year growth 2024-2029 (%)
- Data Table on Global Market: Year-over-year growth 2024-2029 (%)
5 Historic Market Size
- 5.1 Global Face Cream Market 2019 - 2023
- Historic Market Size - Data Table on Global Face Cream Market 2019 - 2023 ($ million)
- 5.2 Product segment analysis 2019 - 2023
- Historic Market Size - Product Segment 2019 - 2023 ($ million)
- 5.3 Distribution Channel segment analysis 2019 - 2023
- Historic Market Size - Distribution Channel Segment 2019 - 2023 ($ million)
- 5.4 Application segment analysis 2019 - 2023
- Historic Market Size - Application Segment 2019 - 2023 ($ million)
- 5.5 End-user segment analysis 2019 - 2023
- Historic Market Size - End-user Segment 2019 - 2023 ($ million)
- 5.6 Geography segment analysis 2019 - 2023
- Historic Market Size - Geography Segment 2019 - 2023 ($ million)
- 5.7 Country segment analysis 2019 - 2023
- Historic Market Size - Country Segment 2019 - 2023 ($ million)
6 Qualitative Analysis
- 6.1 Impact of AI on Global Face Cream Market
7 Five Forces Analysis
- 7.1 Five forces summary
- Five forces analysis - Comparison between 2024 and 2029
- 7.2 Bargaining power of buyers
- Bargaining power of buyers - Impact of key factors 2024 and 2029
- 7.3 Bargaining power of suppliers
- Bargaining power of suppliers - Impact of key factors in 2024 and 2029
- 7.4 Threat of new entrants
- Threat of new entrants - Impact of key factors in 2024 and 2029
- 7.5 Threat of substitutes
- Threat of substitutes - Impact of key factors in 2024 and 2029
- 7.6 Threat of rivalry
- Threat of rivalry - Impact of key factors in 2024 and 2029
- 7.7 Market condition
- Chart on Market condition - Five forces 2024 and 2029
8 Market Segmentation by Product
- 8.1 Market segments
- Chart on Product - Market share 2024-2029 (%)
- Data Table on Product - Market share 2024-2029 (%)
- 8.2 Comparison by Product
- Chart on Comparison by Product
- Data Table on Comparison by Product
- 8.3 Anti-aging cream - Market size and forecast 2024-2029
- Chart on Anti-aging cream - Market size and forecast 2024-2029 ($ million)
- Data Table on Anti-aging cream - Market size and forecast 2024-2029 ($ million)
- Chart on Anti-aging cream - Year-over-year growth 2024-2029 (%)
- Data Table on Anti-aging cream - Year-over-year growth 2024-2029 (%)
- 8.4 Skin whitening and sun protection cream - Market size and forecast 2024-2029
- Chart on Skin whitening and sun protection cream - Market size and forecast 2024-2029 ($ million)
- Data Table on Skin whitening and sun protection cream - Market size and forecast 2024-2029 ($ million)
- Chart on Skin whitening and sun protection cream - Year-over-year growth 2024-2029 (%)
- Data Table on Skin whitening and sun protection cream - Year-over-year growth 2024-2029 (%)
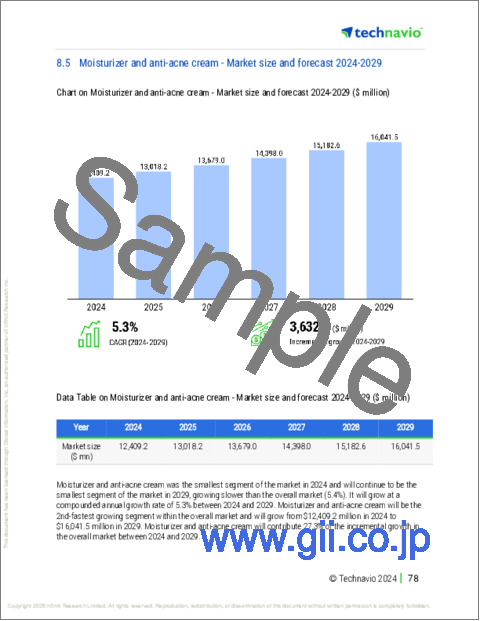
- 8.5 Moisturizer and anti-acne cream - Market size and forecast 2024-2029
- Chart on Moisturizer and anti-acne cream - Market size and forecast 2024-2029 ($ million)
- Data Table on Moisturizer and anti-acne cream - Market size and forecast 2024-2029 ($ million)
- Chart on Moisturizer and anti-acne cream - Year-over-year growth 2024-2029 (%)
- Data Table on Moisturizer and anti-acne cream - Year-over-year growth 2024-2029 (%)
- 8.6 Market opportunity by Product
- Market opportunity by Product ($ million)
- Data Table on Market opportunity by Product ($ million)
9 Market Segmentation by Distribution Channel
- 9.1 Market segments
- Chart on Distribution Channel - Market share 2024-2029 (%)
- Data Table on Distribution Channel - Market share 2024-2029 (%)
- 9.2 Comparison by Distribution Channel
- Chart on Comparison by Distribution Channel
- Data Table on Comparison by Distribution Channel
- 9.3 Offline - Market size and forecast 2024-2029
- Chart on Offline - Market size and forecast 2024-2029 ($ million)
- Data Table on Offline - Market size and forecast 2024-2029 ($ million)
- Chart on Offline - Year-over-year growth 2024-2029 (%)
- Data Table on Offline - Year-over-year growth 2024-2029 (%)
- 9.4 Online - Market size and forecast 2024-2029
- Chart on Online - Market size and forecast 2024-2029 ($ million)
- Data Table on Online - Market size and forecast 2024-2029 ($ million)
- Chart on Online - Year-over-year growth 2024-2029 (%)
- Data Table on Online - Year-over-year growth 2024-2029 (%)
- 9.5 Market opportunity by Distribution Channel
- Market opportunity by Distribution Channel ($ million)
- Data Table on Market opportunity by Distribution Channel ($ million)
10 Market Segmentation by Application
- 10.1 Market segments
- Chart on Application - Market share 2024-2029 (%)
- Data Table on Application - Market share 2024-2029 (%)
- 10.2 Comparison by Application
- Chart on Comparison by Application
- Data Table on Comparison by Application
- 10.3 Sensitive skin - Market size and forecast 2024-2029
- Chart on Sensitive skin - Market size and forecast 2024-2029 ($ million)
- Data Table on Sensitive skin - Market size and forecast 2024-2029 ($ million)
- Chart on Sensitive skin - Year-over-year growth 2024-2029 (%)
- Data Table on Sensitive skin - Year-over-year growth 2024-2029 (%)
- 10.4 Dry skin - Market size and forecast 2024-2029
- Chart on Dry skin - Market size and forecast 2024-2029 ($ million)
- Data Table on Dry skin - Market size and forecast 2024-2029 ($ million)
- Chart on Dry skin - Year-over-year growth 2024-2029 (%)
- Data Table on Dry skin - Year-over-year growth 2024-2029 (%)
- 10.5 Neutral skin - Market size and forecast 2024-2029
- Chart on Neutral skin - Market size and forecast 2024-2029 ($ million)
- Data Table on Neutral skin - Market size and forecast 2024-2029 ($ million)
- Chart on Neutral skin - Year-over-year growth 2024-2029 (%)
- Data Table on Neutral skin - Year-over-year growth 2024-2029 (%)
- 10.6 Oily skin - Market size and forecast 2024-2029
- Chart on Oily skin - Market size and forecast 2024-2029 ($ million)
- Data Table on Oily skin - Market size and forecast 2024-2029 ($ million)
- Chart on Oily skin - Year-over-year growth 2024-2029 (%)
- Data Table on Oily skin - Year-over-year growth 2024-2029 (%)
- 10.7 Market opportunity by Application
- Market opportunity by Application ($ million)
- Data Table on Market opportunity by Application ($ million)
11 Market Segmentation by End-user
- 11.1 Market segments
- Chart on End-user - Market share 2024-2029 (%)
- Data Table on End-user - Market share 2024-2029 (%)
- 11.2 Comparison by End-user
- Chart on Comparison by End-user
- Data Table on Comparison by End-user
- 11.3 Female - Market size and forecast 2024-2029
- Chart on Female - Market size and forecast 2024-2029 ($ million)
- Data Table on Female - Market size and forecast 2024-2029 ($ million)
- Chart on Female - Year-over-year growth 2024-2029 (%)
- Data Table on Female - Year-over-year growth 2024-2029 (%)
- 11.4 Male - Market size and forecast 2024-2029
- Chart on Male - Market size and forecast 2024-2029 ($ million)
- Data Table on Male - Market size and forecast 2024-2029 ($ million)
- Chart on Male - Year-over-year growth 2024-2029 (%)
- Data Table on Male - Year-over-year growth 2024-2029 (%)
- 11.5 Market opportunity by End-user
- Market opportunity by End-user ($ million)
- Data Table on Market opportunity by End-user ($ million)
12 Customer Landscape
- 12.1 Customer landscape overview
- Analysis of price sensitivity, lifecycle, customer purchase basket, adoption rates, and purchase criteria
13 Geographic Landscape
- 13.1 Geographic segmentation
- Chart on Market share By Geographical Landscape 2024-2029 (%)
- Data Table on Market share By Geographical Landscape 2024-2029 (%)
- 13.2 Geographic comparison
- Chart on Geographic comparison
- Data Table on Geographic comparison
- 13.3 APAC - Market size and forecast 2024-2029
- Chart on APAC - Market size and forecast 2024-2029 ($ million)
- Data Table on APAC - Market size and forecast 2024-2029 ($ million)
- Chart on APAC - Year-over-year growth 2024-2029 (%)
- Data Table on APAC - Year-over-year growth 2024-2029 (%)
- 13.4 North America - Market size and forecast 2024-2029
- Chart on North America - Market size and forecast 2024-2029 ($ million)
- Data Table on North America - Market size and forecast 2024-2029 ($ million)
- Chart on North America - Year-over-year growth 2024-2029 (%)
- Data Table on North America - Year-over-year growth 2024-2029 (%)
- 13.5 Europe - Market size and forecast 2024-2029
- Chart on Europe - Market size and forecast 2024-2029 ($ million)
- Data Table on Europe - Market size and forecast 2024-2029 ($ million)
- Chart on Europe - Year-over-year growth 2024-2029 (%)
- Data Table on Europe - Year-over-year growth 2024-2029 (%)
- 13.6 South America - Market size and forecast 2024-2029
- Chart on South America - Market size and forecast 2024-2029 ($ million)
- Data Table on South America - Market size and forecast 2024-2029 ($ million)
- Chart on South America - Year-over-year growth 2024-2029 (%)
- Data Table on South America - Year-over-year growth 2024-2029 (%)
- 13.7 Middle East and Africa - Market size and forecast 2024-2029
- Chart on Middle East and Africa - Market size and forecast 2024-2029 ($ million)
- Data Table on Middle East and Africa - Market size and forecast 2024-2029 ($ million)
- Chart on Middle East and Africa - Year-over-year growth 2024-2029 (%)
- Data Table on Middle East and Africa - Year-over-year growth 2024-2029 (%)
- 13.8 China - Market size and forecast 2024-2029
- Chart on China - Market size and forecast 2024-2029 ($ million)
- Data Table on China - Market size and forecast 2024-2029 ($ million)
- Chart on China - Year-over-year growth 2024-2029 (%)
- Data Table on China - Year-over-year growth 2024-2029 (%)
- 13.9 US - Market size and forecast 2024-2029
- Chart on US - Market size and forecast 2024-2029 ($ million)
- Data Table on US - Market size and forecast 2024-2029 ($ million)
- Chart on US - Year-over-year growth 2024-2029 (%)
- Data Table on US - Year-over-year growth 2024-2029 (%)
- 13.10 Japan - Market size and forecast 2024-2029
- Chart on Japan - Market size and forecast 2024-2029 ($ million)
- Data Table on Japan - Market size and forecast 2024-2029 ($ million)
- Chart on Japan - Year-over-year growth 2024-2029 (%)
- Data Table on Japan - Year-over-year growth 2024-2029 (%)
- 13.11 India - Market size and forecast 2024-2029
- Chart on India - Market size and forecast 2024-2029 ($ million)
- Data Table on India - Market size and forecast 2024-2029 ($ million)
- Chart on India - Year-over-year growth 2024-2029 (%)
- Data Table on India - Year-over-year growth 2024-2029 (%)
- 13.12 Germany - Market size and forecast 2024-2029
- Chart on Germany - Market size and forecast 2024-2029 ($ million)
- Data Table on Germany - Market size and forecast 2024-2029 ($ million)
- Chart on Germany - Year-over-year growth 2024-2029 (%)
- Data Table on Germany - Year-over-year growth 2024-2029 (%)
- 13.13 Canada - Market size and forecast 2024-2029
- Chart on Canada - Market size and forecast 2024-2029 ($ million)
- Data Table on Canada - Market size and forecast 2024-2029 ($ million)
- Chart on Canada - Year-over-year growth 2024-2029 (%)
- Data Table on Canada - Year-over-year growth 2024-2029 (%)
- 13.14 South Korea - Market size and forecast 2024-2029
- Chart on South Korea - Market size and forecast 2024-2029 ($ million)
- Data Table on South Korea - Market size and forecast 2024-2029 ($ million)
- Chart on South Korea - Year-over-year growth 2024-2029 (%)
- Data Table on South Korea - Year-over-year growth 2024-2029 (%)
- 13.15 Australia - Market size and forecast 2024-2029
- Chart on Australia - Market size and forecast 2024-2029 ($ million)
- Data Table on Australia - Market size and forecast 2024-2029 ($ million)
- Chart on Australia - Year-over-year growth 2024-2029 (%)
- Data Table on Australia - Year-over-year growth 2024-2029 (%)
- 13.16 UK - Market size and forecast 2024-2029
- Chart on UK - Market size and forecast 2024-2029 ($ million)
- Data Table on UK - Market size and forecast 2024-2029 ($ million)
- Chart on UK - Year-over-year growth 2024-2029 (%)
- Data Table on UK - Year-over-year growth 2024-2029 (%)
- 13.17 France - Market size and forecast 2024-2029
- Chart on France - Market size and forecast 2024-2029 ($ million)
- Data Table on France - Market size and forecast 2024-2029 ($ million)
- Chart on France - Year-over-year growth 2024-2029 (%)
- Data Table on France - Year-over-year growth 2024-2029 (%)
- 13.18 Market opportunity By Geographical Landscape
- Market opportunity By Geographical Landscape ($ million)
- Data Tables on Market opportunity By Geographical Landscape ($ million)
14 Drivers, Challenges, and Opportunity/Restraints
- 14.1 Market drivers
- 14.2 Market challenges
- 14.3 Impact of drivers and challenges
- Impact of drivers and challenges in 2024 and 2029
- 14.4 Market opportunities/restraints
15 Competitive Landscape
- 15.1 Overview
- 15.2 Competitive Landscape
- Overview on criticality of inputs and factors of differentiation
- 15.3 Landscape disruption
- Overview on factors of disruption
- 15.4 Industry risks
- Impact of key risks on business
16 Competitive Analysis
- 16.1 Companies profiled
- Companies covered
- 16.2 Company ranking index
- Company ranking index
- 16.3 Market positioning of companies
- Matrix on companies position and classification
- 16.4 Amway Corp.
- Amway Corp. - Overview
- Amway Corp. - Product / Service
- Amway Corp. - Key news
- Amway Corp. - Key offerings
- SWOT
- 16.5 Avon Products
- Avon Products - Overview
- Avon Products - Product / Service
- Avon Products - Key offerings
- SWOT
- 16.6 Beiersdorf AG
- Beiersdorf AG - Overview
- Beiersdorf AG - Business segments
- Beiersdorf AG - Key news
- Beiersdorf AG - Key offerings
- Beiersdorf AG - Segment focus
- SWOT
- 16.7 Johnson and Johnson Services Inc.
- Johnson and Johnson Services Inc. - Overview
- Johnson and Johnson Services Inc. - Business segments
- Johnson and Johnson Services Inc. - Key news
- Johnson and Johnson Services Inc. - Key offerings
- Johnson and Johnson Services Inc. - Segment focus
- SWOT
- 16.8 Kao Corp.
- Kao Corp. - Overview
- Kao Corp. - Business segments
- Kao Corp. - Key news
- Kao Corp. - Key offerings
- Kao Corp. - Segment focus
- SWOT
- 16.9 Libby Laboratories Inc.
- Libby Laboratories Inc. - Overview
- Libby Laboratories Inc. - Product / Service
- Libby Laboratories Inc. - Key offerings
- SWOT
- 16.10 LOreal SA
- LOreal SA - Overview
- LOreal SA - Business segments
- LOreal SA - Key news
- LOreal SA - Key offerings
- LOreal SA - Segment focus
- SWOT
- 16.11 Lotus Herbals Pvt. Ltd.
- Lotus Herbals Pvt. Ltd. - Overview
- Lotus Herbals Pvt. Ltd. - Product / Service
- Lotus Herbals Pvt. Ltd. - Key offerings
- SWOT
- 16.12 Oriflame Cosmetics S.A.
- Oriflame Cosmetics S.A. - Overview
- Oriflame Cosmetics S.A. - Product / Service
- Oriflame Cosmetics S.A. - Key offerings
- SWOT
- 16.13 Shiseido Co. Ltd.
- Shiseido Co. Ltd. - Overview
- Shiseido Co. Ltd. - Business segments
- Shiseido Co. Ltd. - Key news
- Shiseido Co. Ltd. - Key offerings
- Shiseido Co. Ltd. - Segment focus
- SWOT
- 16.14 The Body Shop
- The Body Shop - Overview
- The Body Shop - Product / Service
- The Body Shop - Key offerings
- SWOT
- 16.15 The Estee Lauder Co. Inc.
- The Estee Lauder Co. Inc. - Overview
- The Estee Lauder Co. Inc. - Product / Service
- The Estee Lauder Co. Inc. - Key news
- The Estee Lauder Co. Inc. - Key offerings
- SWOT
- 16.16 The Himalaya Drug Co.
- The Himalaya Drug Co. - Overview
- The Himalaya Drug Co. - Product / Service
- The Himalaya Drug Co. - Key offerings
- SWOT
- 16.17 The Procter and Gamble Co.
- The Procter and Gamble Co. - Overview
- The Procter and Gamble Co. - Business segments
- The Procter and Gamble Co. - Key offerings
- The Procter and Gamble Co. - Segment focus
- SWOT
- 16.18 Unilever PLC
- Unilever PLC - Overview
- Unilever PLC - Business segments
- Unilever PLC - Key offerings
- Unilever PLC - Segment focus
- SWOT
17 Appendix
- 17.1 Scope of the report
- 17.2 Inclusions and exclusions checklist
- Inclusions checklist
- Exclusions checklist
- 17.3 Currency conversion rates for US$
- Currency conversion rates for US$
- 17.4 Research methodology
- Research methodology
- 17.5 Data procurement
- Information sources
- 17.6 Data validation
- Data validation
- 17.7 Validation techniques employed for market sizing
- Validation techniques employed for market sizing
- 17.8 Data synthesis
- Data synthesis
- 17.9 360 degree market analysis
- 360 degree market analysis
- 17.10 List of abbreviations
- List of abbreviations

