|
|
市場調査レポート
商品コード
1502097
グリコール酸の世界市場 2024-2028Global glycolic acid market 2024-2028 |
||||||

|
|||||||
カスタマイズ可能
|
|||||||


| グリコール酸の世界市場 2024-2028 |
|
出版日: 2024年05月17日
発行: TechNavio
ページ情報: 英文 176 Pages
納期: 即納可能
|

全表示
- 概要
- 図表
- 目次
グリコール酸市場は2023-2028年に1億8,660万米ドル、予測期間中のCAGRは8.77%で成長すると予測されます。
当レポートでは、グリコール酸市場の全体的な分析、市場規模・予測、動向、成長促進要因、課題、約25のベンダーを網羅したベンダー分析などを掲載しています。
現在の市場シナリオ、最新動向と促進要因、市場環境全体に関する最新分析を提供しています。化粧品業界の需要拡大、ポリグリコール酸業界の需要拡大、石油・精製業界の需要拡大が市場を牽引しています。
| 市場範囲 | |
|---|---|
| 基準年 | 2024 |
| 終了年 | 2028 |
| 予測期間 | 2024-2028 |
| 成長モメンタム | 加速 |
| 前年比2024年 | 7.87% |
| CAGR | 8.77% |
| 増分額 | 1億8,660万米ドル |
本調査では、グリコール酸を使用したコンパニオンアニマル用シャンプー製造の新規アプリケーション開拓が、今後数年間のグリコール酸市場成長を牽引する主要因の一つであると指摘しています。また、混合製品や剥離剤への需要の高まり、生分解性ポリマーへの需要の高まりも市場の大きな需要につながります。
目次
第1章 エグゼクティブサマリー
- 市場概要
第2章 市場情勢
- 市場エコシステム
- 市場の特徴
- バリューチェーン分析
第3章 市場規模の評価
- 市場の定義
- 市場セグメント分析
- 市場規模 2023
- 市場の見通し 2023-2028
第4章 市場規模実績
- 世界のグリコール酸市場 2018-2022
- グレードタイプ別セグメント分析 2018-2022
- 用途別セグメント分析 2018-2022
- 地域別セグメント分析 2018-2022
- 国別セグメント分析 2018-2022
第5章 ファイブフォース分析
- ファイブフォースの要約
- 買い手の交渉力
- 供給企業の交渉力
- 新規参入業者の脅威
- 代替品の脅威
- 競争の脅威
- 市況
第6章 市場セグメンテーション:グレードタイプ別
- 市場セグメンテーション
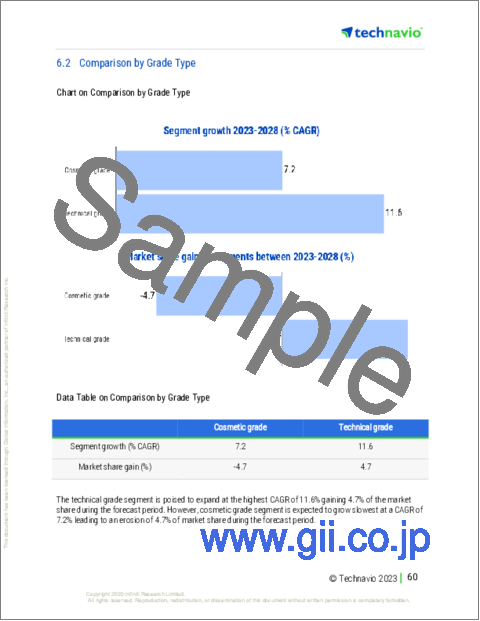
- 比較:グレードタイプ別
- 化粧品グレード:市場規模と予測 2023-2028
- 技術グレード:市場規模と予測 2023-2028
- 市場機会:グレードタイプ別
第7章 市場セグメンテーション:用途別
- 市場セグメンテーション
- 比較:用途別
- パーソナルケアと化粧品:市場規模と予測 2023-2028
- 家庭用洗剤:市場規模と予測 2023-2028
- 産業:市場規模と予測 2023-2028
- その他:市場規模と予測 2023-2028
- 市場機会:用途別
第8章 顧客情勢
- 顧客情勢の概要
第9章 地域別情勢
- 地域別セグメンテーション
- 地域別比較
- アジア太平洋:市場規模と予測 2023-2028
- 北米:市場規模と予測 2023-2028
- 欧州:市場規模と予測 2023-2028
- 南米:市場規模と予測 2023-2028
- 中東・アフリカ:市場規模と予測 2023-2028
- 中国:市場規模と予測 2023-2028
- 米国:市場規模と予測 2023-2028
- ドイツ:市場規模と予測 2023-2028
- カナダ:市場規模と予測 2023-2028
- 英国:市場規模と予測 2023-2028
- 市場機会:地域別
第10章 促進要因・課題・機会・抑制要因
- 市場促進要因
- 市場の課題
- 促進要因と課題の影響
- 市場の機会・抑制要因
第11章 競合情勢
- 概要
- 競合情勢
- 混乱の状況
- 業界のリスク
第12章 競合分析
- 企業プロファイル
- 企業の市場ポジショニング
- Avid Organics
- CABB Group GmbH
- China Petrochemical Corp.
- CrossChem Ltd.
- DuPont de Nemours Inc.
- Glentham Life Sciences Ltd.
- Hefei TNJ Chemical Industry Co. Ltd.
- Kureha Corp.
- Mehul Dye Chem Industries
- Merck KGaA
- Phibro Animal Health Corp.
- RXChemicals
- Saanvi Corp.
- The Chemours Co.
- Zhonglan Industry Co. Ltd.
第13章 付録
Exhibits:
- Exhibits1: Executive Summary - Chart on Market Overview
- Exhibits2: Executive Summary - Data Table on Market Overview
- Exhibits3: Executive Summary - Chart on Global Market Characteristics
- Exhibits4: Executive Summary - Chart on Market by Geography
- Exhibits5: Executive Summary - Chart on Market Segmentation by Grade Type
- Exhibits6: Executive Summary - Chart on Market Segmentation by Application
- Exhibits7: Executive Summary - Chart on Incremental Growth
- Exhibits8: Executive Summary - Data Table on Incremental Growth
- Exhibits9: Executive Summary - Chart on Company Market Positioning
- Exhibits10: Parent Market
- Exhibits11: Data Table on - Parent Market
- Exhibits12: Market characteristics analysis
- Exhibits13: Value Chain Analysis
- Exhibits14: Offerings of companies included in the market definition
- Exhibits15: Market segments
- Exhibits16: Chart on Global - Market size and forecast 2023-2028 ($ million)
- Exhibits17: Data Table on Global - Market size and forecast 2023-2028 ($ million)
- Exhibits18: Chart on Global Market: Year-over-year growth 2023-2028 (%)
- Exhibits19: Data Table on Global Market: Year-over-year growth 2023-2028 (%)
- Exhibits20: Historic Market Size - Data Table on Global Glycolic Acid Market 2018 - 2022 ($ million)
- Exhibits21: Historic Market Size - Grade Type Segment 2018 - 2022 ($ million)
- Exhibits22: Historic Market Size - Application Segment 2018 - 2022 ($ million)
- Exhibits23: Historic Market Size - Geography Segment 2018 - 2022 ($ million)
- Exhibits24: Historic Market Size - Country Segment 2018 - 2022 ($ million)
- Exhibits25: Five forces analysis - Comparison between 2023 and 2028
- Exhibits26: Bargaining power of buyers - Impact of key factors 2023 and 2028
- Exhibits27: Bargaining power of suppliers - Impact of key factors in 2023 and 2028
- Exhibits28: Threat of new entrants - Impact of key factors in 2023 and 2028
- Exhibits29: Threat of substitutes - Impact of key factors in 2023 and 2028
- Exhibits30: Threat of rivalry - Impact of key factors in 2023 and 2028
- Exhibits31: Chart on Market condition - Five forces 2023 and 2028
- Exhibits32: Chart on Grade Type - Market share 2023-2028 (%)
- Exhibits33: Data Table on Grade Type - Market share 2023-2028 (%)
- Exhibits34: Chart on Comparison by Grade Type
- Exhibits35: Data Table on Comparison by Grade Type
- Exhibits36: Chart on Cosmetic grade - Market size and forecast 2023-2028 ($ million)
- Exhibits37: Data Table on Cosmetic grade - Market size and forecast 2023-2028 ($ million)
- Exhibits38: Chart on Cosmetic grade - Year-over-year growth 2023-2028 (%)
- Exhibits39: Data Table on Cosmetic grade - Year-over-year growth 2023-2028 (%)
- Exhibits40: Chart on Technical grade - Market size and forecast 2023-2028 ($ million)
- Exhibits41: Data Table on Technical grade - Market size and forecast 2023-2028 ($ million)
- Exhibits42: Chart on Technical grade - Year-over-year growth 2023-2028 (%)
- Exhibits43: Data Table on Technical grade - Year-over-year growth 2023-2028 (%)
- Exhibits44: Market opportunity by Grade Type ($ million)
- Exhibits45: Data Table on Market opportunity by Grade Type ($ million)
- Exhibits46: Chart on Application - Market share 2023-2028 (%)
- Exhibits47: Data Table on Application - Market share 2023-2028 (%)
- Exhibits48: Chart on Comparison by Application
- Exhibits49: Data Table on Comparison by Application
- Exhibits50: Chart on Personal care and cosmetics - Market size and forecast 2023-2028 ($ million)
- Exhibits51: Data Table on Personal care and cosmetics - Market size and forecast 2023-2028 ($ million)
- Exhibits52: Chart on Personal care and cosmetics - Year-over-year growth 2023-2028 (%)
- Exhibits53: Data Table on Personal care and cosmetics - Year-over-year growth 2023-2028 (%)
- Exhibits54: Chart on Household cleaners - Market size and forecast 2023-2028 ($ million)
- Exhibits55: Data Table on Household cleaners - Market size and forecast 2023-2028 ($ million)
- Exhibits56: Chart on Household cleaners - Year-over-year growth 2023-2028 (%)
- Exhibits57: Data Table on Household cleaners - Year-over-year growth 2023-2028 (%)
- Exhibits58: Chart on Industrial - Market size and forecast 2023-2028 ($ million)
- Exhibits59: Data Table on Industrial - Market size and forecast 2023-2028 ($ million)
- Exhibits60: Chart on Industrial - Year-over-year growth 2023-2028 (%)
- Exhibits61: Data Table on Industrial - Year-over-year growth 2023-2028 (%)
- Exhibits62: Chart on Others - Market size and forecast 2023-2028 ($ million)
- Exhibits63: Data Table on Others - Market size and forecast 2023-2028 ($ million)
- Exhibits64: Chart on Others - Year-over-year growth 2023-2028 (%)
- Exhibits65: Data Table on Others - Year-over-year growth 2023-2028 (%)
- Exhibits66: Market opportunity by Application ($ million)
- Exhibits67: Data Table on Market opportunity by Application ($ million)
- Exhibits68: Analysis of price sensitivity, lifecycle, customer purchase basket, adoption rates, and purchase criteria
- Exhibits69: Chart on Market share By Geographical Landscape2023-2028 (%)
- Exhibits70: Data Table on Market share By Geographical Landscape2023-2028 (%)
- Exhibits71: Chart on Geographic comparison
- Exhibits72: Data Table on Geographic comparison
- Exhibits73: Chart on APAC - Market size and forecast 2023-2028 ($ million)
- Exhibits74: Data Table on APAC - Market size and forecast 2023-2028 ($ million)
- Exhibits75: Chart on APAC - Year-over-year growth 2023-2028 (%)
- Exhibits76: Data Table on APAC - Year-over-year growth 2023-2028 (%)
- Exhibits77: Chart on North America - Market size and forecast 2023-2028 ($ million)
- Exhibits78: Data Table on North America - Market size and forecast 2023-2028 ($ million)
- Exhibits79: Chart on North America - Year-over-year growth 2023-2028 (%)
- Exhibits80: Data Table on North America - Year-over-year growth 2023-2028 (%)
- Exhibits81: Chart on Europe - Market size and forecast 2023-2028 ($ million)
- Exhibits82: Data Table on Europe - Market size and forecast 2023-2028 ($ million)
- Exhibits83: Chart on Europe - Year-over-year growth 2023-2028 (%)
- Exhibits84: Data Table on Europe - Year-over-year growth 2023-2028 (%)
- Exhibits85: Chart on South America - Market size and forecast 2023-2028 ($ million)
- Exhibits86: Data Table on South America - Market size and forecast 2023-2028 ($ million)
- Exhibits87: Chart on South America - Year-over-year growth 2023-2028 (%)
- Exhibits88: Data Table on South America - Year-over-year growth 2023-2028 (%)
- Exhibits89: Chart on Middle East and Africa - Market size and forecast 2023-2028 ($ million)
- Exhibits90: Data Table on Middle East and Africa - Market size and forecast 2023-2028 ($ million)
- Exhibits91: Chart on Middle East and Africa - Year-over-year growth 2023-2028 (%)
- Exhibits92: Data Table on Middle East and Africa - Year-over-year growth 2023-2028 (%)
- Exhibits93: Chart on China - Market size and forecast 2023-2028 ($ million)
- Exhibits94: Data Table on China - Market size and forecast 2023-2028 ($ million)
- Exhibits95: Chart on China - Year-over-year growth 2023-2028 (%)
- Exhibits96: Data Table on China - Year-over-year growth 2023-2028 (%)
- Exhibits97: Chart on US - Market size and forecast 2023-2028 ($ million)
- Exhibits98: Data Table on US - Market size and forecast 2023-2028 ($ million)
- Exhibits99: Chart on US - Year-over-year growth 2023-2028 (%)
- Exhibits100: Data Table on US - Year-over-year growth 2023-2028 (%)
- Exhibits101: Chart on Germany - Market size and forecast 2023-2028 ($ million)
- Exhibits102: Data Table on Germany - Market size and forecast 2023-2028 ($ million)
- Exhibits103: Chart on Germany - Year-over-year growth 2023-2028 (%)
- Exhibits104: Data Table on Germany - Year-over-year growth 2023-2028 (%)
- Exhibits105: Chart on Canada - Market size and forecast 2023-2028 ($ million)
- Exhibits106: Data Table on Canada - Market size and forecast 2023-2028 ($ million)
- Exhibits107: Chart on Canada - Year-over-year growth 2023-2028 (%)
- Exhibits108: Data Table on Canada - Year-over-year growth 2023-2028 (%)
- Exhibits109: Chart on UK - Market size and forecast 2023-2028 ($ million)
- Exhibits110: Data Table on UK - Market size and forecast 2023-2028 ($ million)
- Exhibits111: Chart on UK - Year-over-year growth 2023-2028 (%)
- Exhibits112: Data Table on UK - Year-over-year growth 2023-2028 (%)
- Exhibits113: Market opportunity By Geographical Landscape($ million)
- Exhibits114: Data Tables on Market opportunity By Geographical Landscape($ million)
- Exhibits115: Impact of drivers and challenges in 2023 and 2028
- Exhibits116: Overview on criticality of inputs and factors of differentiation
- Exhibits117: Overview on factors of disruption
- Exhibits118: Impact of key risks on business
- Exhibits119: Companies covered
- Exhibits120: Matrix on companies position and classification
- Exhibits121: Avid Organics - Overview
- Exhibits122: Avid Organics - Product / Service
- Exhibits123: Avid Organics - Key offerings
- Exhibits124: CABB Group GmbH - Overview
- Exhibits125: CABB Group GmbH - Product / Service
- Exhibits126: CABB Group GmbH - Key offerings
- Exhibits127: China Petrochemical Corp. - Overview
- Exhibits128: China Petrochemical Corp. - Business segments
- Exhibits129: China Petrochemical Corp. - Key news
- Exhibits130: China Petrochemical Corp. - Key offerings
- Exhibits131: China Petrochemical Corp. - Segment focus
- Exhibits132: CrossChem Ltd. - Overview
- Exhibits133: CrossChem Ltd. - Product / Service
- Exhibits134: CrossChem Ltd. - Key offerings
- Exhibits135: DuPont de Nemours Inc. - Overview
- Exhibits136: DuPont de Nemours Inc. - Business segments
- Exhibits137: DuPont de Nemours Inc. - Key news
- Exhibits138: DuPont de Nemours Inc. - Key offerings
- Exhibits139: DuPont de Nemours Inc. - Segment focus
- Exhibits140: Glentham Life Sciences Ltd. - Overview
- Exhibits141: Glentham Life Sciences Ltd. - Product / Service
- Exhibits142: Glentham Life Sciences Ltd. - Key offerings
- Exhibits143: Hefei TNJ Chemical Industry Co. Ltd. - Overview
- Exhibits144: Hefei TNJ Chemical Industry Co. Ltd. - Product / Service
- Exhibits145: Hefei TNJ Chemical Industry Co. Ltd. - Key offerings
- Exhibits146: Kureha Corp. - Overview
- Exhibits147: Kureha Corp. - Business segments
- Exhibits148: Kureha Corp. - Key offerings
- Exhibits149: Kureha Corp. - Segment focus
- Exhibits150: Mehul Dye Chem Industries - Overview
- Exhibits151: Mehul Dye Chem Industries - Product / Service
- Exhibits152: Mehul Dye Chem Industries - Key offerings
- Exhibits153: Merck KGaA - Overview
- Exhibits154: Merck KGaA - Business segments
- Exhibits155: Merck KGaA - Key news
- Exhibits156: Merck KGaA - Key offerings
- Exhibits157: Merck KGaA - Segment focus
- Exhibits158: Phibro Animal Health Corp. - Overview
- Exhibits159: Phibro Animal Health Corp. - Business segments
- Exhibits160: Phibro Animal Health Corp. - Key offerings
- Exhibits161: Phibro Animal Health Corp. - Segment focus
- Exhibits162: RXChemicals - Overview
- Exhibits163: RXChemicals - Product / Service
- Exhibits164: RXChemicals - Key offerings
- Exhibits165: Saanvi Corp. - Overview
- Exhibits166: Saanvi Corp. - Product / Service
- Exhibits167: Saanvi Corp. - Key offerings
- Exhibits168: The Chemours Co. - Overview
- Exhibits169: The Chemours Co. - Business segments
- Exhibits170: The Chemours Co. - Key news
- Exhibits171: The Chemours Co. - Key offerings
- Exhibits172: The Chemours Co. - Segment focus
- Exhibits173: Zhonglan Industry Co. Ltd. - Overview
- Exhibits174: Zhonglan Industry Co. Ltd. - Product / Service
- Exhibits175: Zhonglan Industry Co. Ltd. - Key offerings
- Exhibits176: Inclusions checklist
- Exhibits177: Exclusions checklist
- Exhibits178: Currency conversion rates for US$
- Exhibits179: Research methodology
- Exhibits180: Information sources
- Exhibits181: Data validation
- Exhibits182: Validation techniques employed for market sizing
- Exhibits183: Data synthesis
- Exhibits184: 360 degree market analysis
- Exhibits185: List of abbreviations
The glycolic acid market is forecasted to grow by USD 186.6 mn during 2023-2028, accelerating at a CAGR of 8.77% during the forecast period. The report on the glycolic acid market provides a holistic analysis, market size and forecast, trends, growth drivers, and challenges, as well as vendor analysis covering around 25 vendors.
The report offers an up-to-date analysis regarding the current market scenario, the latest trends and drivers, and the overall market environment. The market is driven by growing demand from cosmetics industry, rising demand from polyglycolic acid industry, and growing demand in oil and refining industries.
Technavio's glycolic acid market is segmented as below:
| Market Scope | |
|---|---|
| Base Year | 2024 |
| End Year | 2028 |
| Series Year | 2024-2028 |
| Growth Momentum | Accelerate |
| YOY 2024 | 7.87% |
| CAGR | 8.77% |
| Incremental Value | $186.6mn |
By Grade Type
- Cosmetic grade
- Technical grade
By Application
- Personal care and cosmetics
- Household cleaners
- Industrial
- Others
By Geography
- APAC
- North America
- Europe
- South America
- Middle East and Africa
This study identifies the development of new applications to manufacture shampoo for companion animals using glycolic acid as one of the prime reasons driving the glycolic acid market growth during the next few years. Also, growing demand for blended products and peels and rising demand for biodegradable polymers will lead to sizable demand in the market.
The report on the glycolic acid market covers the following areas:
- Glycolic acid market sizing
- Glycolic acid market forecast
- Glycolic acid market industry analysis
The robust vendor analysis is designed to help clients improve their market position, and in line with this, this report provides a detailed analysis of several leading glycolic acid market vendors that include Acuro Organics Ltd., Avid Organics, CABB Group GmbH, China Petrochemical Corp., CrossChem Ltd., DuPont de Nemours Inc., Glentham Life Sciences Ltd., Hefei TNJ Chemical Industry Co. Ltd., Jiaxing Jlight Chemicals Co. Ltd., Kumar Industries, Kureha Corp., Mehul Dye Chem Industries, Merck KGaA, Phibro Animal Health Corp., RXChemicals, Saanvi Corp., Shandong Xinhua Pharmaceutical I and E Co. Ltd., The Chemours Co., Water Chemical Co. Ltd., and Zhonglan Industry Co. Ltd.. Also, the glycolic acid market analysis report includes information on upcoming trends and challenges that will influence market growth. This is to help companies strategize and leverage all forthcoming growth opportunities.
The study was conducted using an objective combination of primary and secondary information including inputs from key participants in the industry. The report contains a comprehensive market and vendor landscape in addition to an analysis of the key vendors.
The publisher presents a detailed picture of the market by the way of study, synthesis, and summation of data from multiple sources by an analysis of key parameters such as profit, pricing, competition, and promotions. It presents various market facets by identifying the key industry influencers. The data presented is comprehensive, reliable, and a result of extensive research - both primary and secondary. The market research reports provide a complete competitive landscape and an in-depth vendor selection methodology and analysis using qualitative and quantitative research to forecast the accurate market growth.
Table of Contents
1 Executive Summary
- 1.1 Market overview
- Executive Summary - Chart on Market Overview
- Executive Summary - Data Table on Market Overview
- Executive Summary - Chart on Global Market Characteristics
- Executive Summary - Chart on Market by Geography
- Executive Summary - Chart on Market Segmentation by Grade Type
- Executive Summary - Chart on Market Segmentation by Application
- Executive Summary - Chart on Incremental Growth
- Executive Summary - Data Table on Incremental Growth
- Executive Summary - Chart on Company Market Positioning
2 Market Landscape
- 2.1 Market ecosystem
- Parent Market
- Data Table on - Parent Market
- 2.2 Market characteristics
- Market characteristics analysis
- 2.3 Value chain analysis
- Value Chain Analysis
3 Market Sizing
- 3.1 Market definition
- Offerings of companies included in the market definition
- 3.2 Market segment analysis
- Market segments
- 3.3 Market size 2023
- 3.4 Market outlook: Forecast for 2023-2028
- Chart on Global - Market size and forecast 2023-2028 ($ million)
- Data Table on Global - Market size and forecast 2023-2028 ($ million)
- Chart on Global Market: Year-over-year growth 2023-2028 (%)
- Data Table on Global Market: Year-over-year growth 2023-2028 (%)
4 Historic Market Size
- 4.1 Global Glycolic Acid Market 2018 - 2022
- Historic Market Size - Data Table on Global Glycolic Acid Market 2018 - 2022 ($ million)
- 4.2 Grade Type segment analysis 2018 - 2022
- Historic Market Size - Grade Type Segment 2018 - 2022 ($ million)
- 4.3 Application segment analysis 2018 - 2022
- Historic Market Size - Application Segment 2018 - 2022 ($ million)
- 4.4 Geography segment analysis 2018 - 2022
- Historic Market Size - Geography Segment 2018 - 2022 ($ million)
- 4.5 Country segment analysis 2018 - 2022
- Historic Market Size - Country Segment 2018 - 2022 ($ million)
5 Five Forces Analysis
- 5.1 Five forces summary
- Five forces analysis - Comparison between 2023 and 2028
- 5.2 Bargaining power of buyers
- Bargaining power of buyers - Impact of key factors 2023 and 2028
- 5.3 Bargaining power of suppliers
- Bargaining power of suppliers - Impact of key factors in 2023 and 2028
- 5.4 Threat of new entrants
- Threat of new entrants - Impact of key factors in 2023 and 2028
- 5.5 Threat of substitutes
- Threat of substitutes - Impact of key factors in 2023 and 2028
- 5.6 Threat of rivalry
- Threat of rivalry - Impact of key factors in 2023 and 2028
- 5.7 Market condition
- Chart on Market condition - Five forces 2023 and 2028
6 Market Segmentation by Grade Type
- 6.1 Market segments
- Chart on Grade Type - Market share 2023-2028 (%)
- Data Table on Grade Type - Market share 2023-2028 (%)
- 6.2 Comparison by Grade Type
- Chart on Comparison by Grade Type
- Data Table on Comparison by Grade Type
- 6.3 Cosmetic grade - Market size and forecast 2023-2028
- Chart on Cosmetic grade - Market size and forecast 2023-2028 ($ million)
- Data Table on Cosmetic grade - Market size and forecast 2023-2028 ($ million)
- Chart on Cosmetic grade - Year-over-year growth 2023-2028 (%)
- Data Table on Cosmetic grade - Year-over-year growth 2023-2028 (%)
- 6.4 Technical grade - Market size and forecast 2023-2028
- Chart on Technical grade - Market size and forecast 2023-2028 ($ million)
- Data Table on Technical grade - Market size and forecast 2023-2028 ($ million)
- Chart on Technical grade - Year-over-year growth 2023-2028 (%)
- Data Table on Technical grade - Year-over-year growth 2023-2028 (%)
- 6.5 Market opportunity by Grade Type
- Market opportunity by Grade Type ($ million)
- Data Table on Market opportunity by Grade Type ($ million)
7 Market Segmentation by Application
- 7.1 Market segments
- Chart on Application - Market share 2023-2028 (%)
- Data Table on Application - Market share 2023-2028 (%)
- 7.2 Comparison by Application
- Chart on Comparison by Application
- Data Table on Comparison by Application
- 7.3 Personal care and cosmetics - Market size and forecast 2023-2028
- Chart on Personal care and cosmetics - Market size and forecast 2023-2028 ($ million)
- Data Table on Personal care and cosmetics - Market size and forecast 2023-2028 ($ million)
- Chart on Personal care and cosmetics - Year-over-year growth 2023-2028 (%)
- Data Table on Personal care and cosmetics - Year-over-year growth 2023-2028 (%)
- 7.4 Household cleaners - Market size and forecast 2023-2028
- Chart on Household cleaners - Market size and forecast 2023-2028 ($ million)
- Data Table on Household cleaners - Market size and forecast 2023-2028 ($ million)
- Chart on Household cleaners - Year-over-year growth 2023-2028 (%)
- Data Table on Household cleaners - Year-over-year growth 2023-2028 (%)
- 7.5 Industrial - Market size and forecast 2023-2028
- Chart on Industrial - Market size and forecast 2023-2028 ($ million)
- Data Table on Industrial - Market size and forecast 2023-2028 ($ million)
- Chart on Industrial - Year-over-year growth 2023-2028 (%)
- Data Table on Industrial - Year-over-year growth 2023-2028 (%)
- 7.6 Others - Market size and forecast 2023-2028
- Chart on Others - Market size and forecast 2023-2028 ($ million)
- Data Table on Others - Market size and forecast 2023-2028 ($ million)
- Chart on Others - Year-over-year growth 2023-2028 (%)
- Data Table on Others - Year-over-year growth 2023-2028 (%)
- 7.7 Market opportunity by Application
- Market opportunity by Application ($ million)
- Data Table on Market opportunity by Application ($ million)
8 Customer Landscape
- 8.1 Customer landscape overview
- Analysis of price sensitivity, lifecycle, customer purchase basket, adoption rates, and purchase criteria
9 Geographic Landscape
- 9.1 Geographic segmentation
- Chart on Market share By Geographical Landscape2023-2028 (%)
- Data Table on Market share By Geographical Landscape2023-2028 (%)
- 9.2 Geographic comparison
- Chart on Geographic comparison
- Data Table on Geographic comparison
- 9.3 APAC - Market size and forecast 2023-2028
- Chart on APAC - Market size and forecast 2023-2028 ($ million)
- Data Table on APAC - Market size and forecast 2023-2028 ($ million)
- Chart on APAC - Year-over-year growth 2023-2028 (%)
- Data Table on APAC - Year-over-year growth 2023-2028 (%)
- 9.4 North America - Market size and forecast 2023-2028
- Chart on North America - Market size and forecast 2023-2028 ($ million)
- Data Table on North America - Market size and forecast 2023-2028 ($ million)
- Chart on North America - Year-over-year growth 2023-2028 (%)
- Data Table on North America - Year-over-year growth 2023-2028 (%)
- 9.5 Europe - Market size and forecast 2023-2028
- Chart on Europe - Market size and forecast 2023-2028 ($ million)
- Data Table on Europe - Market size and forecast 2023-2028 ($ million)
- Chart on Europe - Year-over-year growth 2023-2028 (%)
- Data Table on Europe - Year-over-year growth 2023-2028 (%)
- 9.6 South America - Market size and forecast 2023-2028
- Chart on South America - Market size and forecast 2023-2028 ($ million)
- Data Table on South America - Market size and forecast 2023-2028 ($ million)
- Chart on South America - Year-over-year growth 2023-2028 (%)
- Data Table on South America - Year-over-year growth 2023-2028 (%)
- 9.7 Middle East and Africa - Market size and forecast 2023-2028
- Chart on Middle East and Africa - Market size and forecast 2023-2028 ($ million)
- Data Table on Middle East and Africa - Market size and forecast 2023-2028 ($ million)
- Chart on Middle East and Africa - Year-over-year growth 2023-2028 (%)
- Data Table on Middle East and Africa - Year-over-year growth 2023-2028 (%)
- 9.8 China - Market size and forecast 2023-2028
- Chart on China - Market size and forecast 2023-2028 ($ million)
- Data Table on China - Market size and forecast 2023-2028 ($ million)
- Chart on China - Year-over-year growth 2023-2028 (%)
- Data Table on China - Year-over-year growth 2023-2028 (%)
- 9.9 US - Market size and forecast 2023-2028
- Chart on US - Market size and forecast 2023-2028 ($ million)
- Data Table on US - Market size and forecast 2023-2028 ($ million)
- Chart on US - Year-over-year growth 2023-2028 (%)
- Data Table on US - Year-over-year growth 2023-2028 (%)
- 9.10 Germany - Market size and forecast 2023-2028
- Chart on Germany - Market size and forecast 2023-2028 ($ million)
- Data Table on Germany - Market size and forecast 2023-2028 ($ million)
- Chart on Germany - Year-over-year growth 2023-2028 (%)
- Data Table on Germany - Year-over-year growth 2023-2028 (%)
- 9.11 Canada - Market size and forecast 2023-2028
- Chart on Canada - Market size and forecast 2023-2028 ($ million)
- Data Table on Canada - Market size and forecast 2023-2028 ($ million)
- Chart on Canada - Year-over-year growth 2023-2028 (%)
- Data Table on Canada - Year-over-year growth 2023-2028 (%)
- 9.12 UK - Market size and forecast 2023-2028
- Chart on UK - Market size and forecast 2023-2028 ($ million)
- Data Table on UK - Market size and forecast 2023-2028 ($ million)
- Chart on UK - Year-over-year growth 2023-2028 (%)
- Data Table on UK - Year-over-year growth 2023-2028 (%)
- 9.13 Market opportunity by geography
- Market opportunity By Geographical Landscape($ million)
- Data Tables on Market opportunity By Geographical Landscape($ million)
10 Drivers, Challenges, and Opportunity/Restraints
- 10.1 Market drivers
- 10.2 Market challenges
- 10.3 Impact of drivers and challenges
- Impact of drivers and challenges in 2023 and 2028
- 10.4 Market opportunities/restraints
11 Competitive Landscape
- 11.1 Overview
- 11.2 Competitive Landscape
- Overview on criticality of inputs and factors of differentiation
- 11.3 Landscape disruption
- Overview on factors of disruption
- 11.4 Industry risks
- Impact of key risks on business
12 Competitive Analysis
- 12.1 Companies profiled
- Companies covered
- 12.2 Market positioning of companies
- Matrix on companies position and classification
- 12.3 Avid Organics
- Avid Organics - Overview
- Avid Organics - Product / Service
- Avid Organics - Key offerings
- 12.4 CABB Group GmbH
- CABB Group GmbH - Overview
- CABB Group GmbH - Product / Service
- CABB Group GmbH - Key offerings
- 12.5 China Petrochemical Corp.
- China Petrochemical Corp. - Overview
- China Petrochemical Corp. - Business segments
- China Petrochemical Corp. - Key news
- China Petrochemical Corp. - Key offerings
- China Petrochemical Corp. - Segment focus
- 12.6 CrossChem Ltd.
- CrossChem Ltd. - Overview
- CrossChem Ltd. - Product / Service
- CrossChem Ltd. - Key offerings
- 12.7 DuPont de Nemours Inc.
- DuPont de Nemours Inc. - Overview
- DuPont de Nemours Inc. - Business segments
- DuPont de Nemours Inc. - Key news
- DuPont de Nemours Inc. - Key offerings
- DuPont de Nemours Inc. - Segment focus
- 12.8 Glentham Life Sciences Ltd.
- Glentham Life Sciences Ltd. - Overview
- Glentham Life Sciences Ltd. - Product / Service
- Glentham Life Sciences Ltd. - Key offerings
- 12.9 Hefei TNJ Chemical Industry Co. Ltd.
- Hefei TNJ Chemical Industry Co. Ltd. - Overview
- Hefei TNJ Chemical Industry Co. Ltd. - Product / Service
- Hefei TNJ Chemical Industry Co. Ltd. - Key offerings
- 12.10 Kureha Corp.
- Kureha Corp. - Overview
- Kureha Corp. - Business segments
- Kureha Corp. - Key offerings
- Kureha Corp. - Segment focus
- 12.11 Mehul Dye Chem Industries
- Mehul Dye Chem Industries - Overview
- Mehul Dye Chem Industries - Product / Service
- Mehul Dye Chem Industries - Key offerings
- 12.12 Merck KGaA
- Merck KGaA - Overview
- Merck KGaA - Business segments
- Merck KGaA - Key news
- Merck KGaA - Key offerings
- Merck KGaA - Segment focus
- 12.13 Phibro Animal Health Corp.
- Phibro Animal Health Corp. - Overview
- Phibro Animal Health Corp. - Business segments
- Phibro Animal Health Corp. - Key offerings
- Phibro Animal Health Corp. - Segment focus
- 12.14 RXChemicals
- RXChemicals - Overview
- RXChemicals - Product / Service
- RXChemicals - Key offerings
- 12.15 Saanvi Corp.
- Saanvi Corp. - Overview
- Saanvi Corp. - Product / Service
- Saanvi Corp. - Key offerings
- 12.16 The Chemours Co.
- The Chemours Co. - Overview
- The Chemours Co. - Business segments
- The Chemours Co. - Key news
- The Chemours Co. - Key offerings
- The Chemours Co. - Segment focus
- 12.17 Zhonglan Industry Co. Ltd.
- Zhonglan Industry Co. Ltd. - Overview
- Zhonglan Industry Co. Ltd. - Product / Service
- Zhonglan Industry Co. Ltd. - Key offerings
13 Appendix
- 13.1 Scope of the report
- 13.2 Inclusions and exclusions checklist
- Inclusions checklist
- Exclusions checklist
- 13.3 Currency conversion rates for US$
- Currency conversion rates for US$
- 13.4 Research methodology
- Research methodology
- 13.5 Data procurement
- Information sources
- 13.6 Data validation
- Data validation
- 13.7 Validation techniques employed for market sizing
- Validation techniques employed for market sizing
- 13.8 Data synthesis
- Data synthesis
- 13.9 360 degree market analysis
- 360 degree market analysis
- 13.10 List of abbreviations
- List of abbreviations

