|
|
市場調査レポート
商品コード
1502084
産業用バーコードスキャナーの世界市場 2024-2028Global industrial barcode scanner market 2024-2028 |
||||||

|
|||||||
カスタマイズ可能
|
|||||||

| 産業用バーコードスキャナーの世界市場 2024-2028 |
|
出版日: 2024年05月20日
発行: TechNavio
ページ情報: 英文 186 Pages
納期: 即納可能
|

全表示
- 概要
- 図表
- 目次
産業用バーコードスキャナー市場2024-2028
産業用バーコードスキャナー市場は2023-2028年に26億1,170万米ドル、予測期間中のCAGRは10.68%で成長すると予測されます。当レポートでは、産業用バーコードスキャナー市場の全体的な分析、市場規模・予測、動向、成長促進要因、課題、約25のベンダーを網羅したベンダー分析などを掲載しています。
現在の市場シナリオ、最新動向と促進要因、市場環境全体に関する最新分析を提供しています。市場は、インダストリー4.0の進化、製造業におけるウェアラブルバーコードスキャナの採用の増加、モバイルワークフォースの展開の増加によって牽引されています。
| 市場範囲 | |
|---|---|
| 基準年 | 2024 |
| 終了年 | 2028 |
| 予測期間 | 2024-2028 |
| 成長モメンタム | 加速 |
| 前年比2024年 | 9.38% |
| CAGR | 10.68% |
| 増分額 | 26億1,170万米ドル |
本調査では、今後数年間の産業用バーコードスキャナー市場成長を促進する主な理由の1つとして、従来のバーコードスキャナと同じ機能を持つウェアラブルの使用を挙げています。また、堅牢な産業用バーコードスキャナに対する需要の高まりや、バーコードスキャナから取得したデータによるビッグデータの利用の増加が、市場の大きな需要につながります。
目次
第1章 エグゼクティブサマリー
- 市場概要
第2章 市場情勢
- 市場エコシステム
- 市場の特徴
- バリューチェーン分析
第3章 市場規模の評価
- 市場の定義
- 市場セグメント分析
- 市場規模 2023
- 市場の見通し 2023-2028
第4章 市場規模実績
- 世界の産業用バーコードスキャナー市場 2018-2022
- 用途別セグメント分析 2018-2022
- 製品別セグメント分析 2018-2022
- 地域別セグメント分析 2018-2022
- 国別セグメント分析 2018-2022
第5章 ファイブフォース分析
- ファイブフォースの要約
- 買い手の交渉力
- 供給企業の交渉力
- 新規参入業者の脅威
- 代替品の脅威
- 競争の脅威
- 市況
第6章 市場セグメンテーション:用途別
- 市場セグメンテーション
- 比較:用途別
- 製造業:市場規模と予測 2023-2028
- 運輸・物流:市場規模と予測 2023-2028
- 小売り:市場規模と予測 2023-2028
- 飲食品:市場規模と予測 2023-2028
- その他:市場規模と予測 2023-2028
- 市場機会:用途別
第7章 市場セグメンテーション:製品別
- 市場セグメンテーション
- 比較:製品別
- モバイルコンピュータ:市場規模と予測 2023-2028
- ハンドヘルドスキャナ:市場規模と予測 2023-2028
- リングスキャナ:市場規模と予測 2023-2028
- 市場機会:製品別
第8章 顧客情勢
- 顧客情勢の概要
第9章 地域別情勢
- 地域別セグメンテーション
- 地域別比較
- 北米:市場規模と予測 2023-2028
- アジア太平洋:市場規模と予測 2023-2028
- 欧州:市場規模と予測 2023-2028
- 南米:市場規模と予測 2023-2028
- 中東・アフリカ:市場規模と予測 2023-2028
- 米国:市場規模と予測 2023-2028
- 中国:市場規模と予測 2023-2028
- ドイツ:市場規模と予測 2023-2028
- カナダ:市場規模と予測 2023-2028
- 日本:市場規模と予測 2023-2028
- 市場機会:地域別
第10章 促進要因・課題・機会・抑制要因
- 市場促進要因
- 市場の課題
- 促進要因と課題の影響
- 市場の機会・抑制要因
第11章 競合情勢
- 概要
- 競合情勢
- 混乱の状況
- 業界のリスク
第12章 競合分析
- 企業プロファイル
- 企業の市場ポジショニング
- Advantech Co. Ltd.
- Bluebird Inc.
- CipherLab Co. Ltd.
- Cognex Corp.
- Datalogic SpA
- DENSO Corp.
- EUROTECH Spa
- Generalscan
- Honeywell International Inc.
- OMRON Corp.
- Opticon Sensors Europe BV
- SATO Holdings Corp.
- Unipro Tech Solutions Pvt. Ltd.
- Unitech Computer Co. Ltd.
- Zebra Technologies Corp.
第13章 付録
Exhibits:
- Exhibits1: Executive Summary - Chart on Market Overview
- Exhibits2: Executive Summary - Data Table on Market Overview
- Exhibits3: Executive Summary - Chart on Global Market Characteristics
- Exhibits4: Executive Summary - Chart on Market by Geography
- Exhibits5: Executive Summary - Chart on Market Segmentation by Application
- Exhibits6: Executive Summary - Chart on Market Segmentation by Product
- Exhibits7: Executive Summary - Chart on Incremental Growth
- Exhibits8: Executive Summary - Data Table on Incremental Growth
- Exhibits9: Executive Summary - Chart on Company Market Positioning
- Exhibits10: Parent Market
- Exhibits11: Data Table on - Parent Market
- Exhibits12: Market characteristics analysis
- Exhibits13: Value Chain Analysis
- Exhibits14: Offerings of companies included in the market definition
- Exhibits15: Market segments
- Exhibits16: Chart on Global - Market size and forecast 2023-2028 ($ million)
- Exhibits17: Data Table on Global - Market size and forecast 2023-2028 ($ million)
- Exhibits18: Chart on Global Market: Year-over-year growth 2023-2028 (%)
- Exhibits19: Data Table on Global Market: Year-over-year growth 2023-2028 (%)
- Exhibits20: Historic Market Size - Data Table on Global Industrial Barcode Scanner Market 2018 - 2022 ($ million)
- Exhibits21: Historic Market Size - Application Segment 2018 - 2022 ($ million)
- Exhibits22: Historic Market Size - Product Segment 2018 - 2022 ($ million)
- Exhibits23: Historic Market Size - Geography Segment 2018 - 2022 ($ million)
- Exhibits24: Historic Market Size - Country Segment 2018 - 2022 ($ million)
- Exhibits25: Five forces analysis - Comparison between 2023 and 2028
- Exhibits26: Bargaining power of buyers - Impact of key factors 2023 and 2028
- Exhibits27: Bargaining power of suppliers - Impact of key factors in 2023 and 2028
- Exhibits28: Threat of new entrants - Impact of key factors in 2023 and 2028
- Exhibits29: Threat of substitutes - Impact of key factors in 2023 and 2028
- Exhibits30: Threat of rivalry - Impact of key factors in 2023 and 2028
- Exhibits31: Chart on Market condition - Five forces 2023 and 2028
- Exhibits32: Chart on Application - Market share 2023-2028 (%)
- Exhibits33: Data Table on Application - Market share 2023-2028 (%)
- Exhibits34: Chart on Comparison by Application
- Exhibits35: Data Table on Comparison by Application
- Exhibits36: Chart on Manufacturing - Market size and forecast 2023-2028 ($ million)
- Exhibits37: Data Table on Manufacturing - Market size and forecast 2023-2028 ($ million)
- Exhibits38: Chart on Manufacturing - Year-over-year growth 2023-2028 (%)
- Exhibits39: Data Table on Manufacturing - Year-over-year growth 2023-2028 (%)
- Exhibits40: Chart on Transportation and logistics - Market size and forecast 2023-2028 ($ million)
- Exhibits41: Data Table on Transportation and logistics - Market size and forecast 2023-2028 ($ million)
- Exhibits42: Chart on Transportation and logistics - Year-over-year growth 2023-2028 (%)
- Exhibits43: Data Table on Transportation and logistics - Year-over-year growth 2023-2028 (%)
- Exhibits44: Chart on Retail - Market size and forecast 2023-2028 ($ million)
- Exhibits45: Data Table on Retail - Market size and forecast 2023-2028 ($ million)
- Exhibits46: Chart on Retail - Year-over-year growth 2023-2028 (%)
- Exhibits47: Data Table on Retail - Year-over-year growth 2023-2028 (%)
- Exhibits48: Chart on Food and beverages - Market size and forecast 2023-2028 ($ million)
- Exhibits49: Data Table on Food and beverages - Market size and forecast 2023-2028 ($ million)
- Exhibits50: Chart on Food and beverages - Year-over-year growth 2023-2028 (%)
- Exhibits51: Data Table on Food and beverages - Year-over-year growth 2023-2028 (%)
- Exhibits52: Chart on Others - Market size and forecast 2023-2028 ($ million)
- Exhibits53: Data Table on Others - Market size and forecast 2023-2028 ($ million)
- Exhibits54: Chart on Others - Year-over-year growth 2023-2028 (%)
- Exhibits55: Data Table on Others - Year-over-year growth 2023-2028 (%)
- Exhibits56: Market opportunity by Application ($ million)
- Exhibits57: Data Table on Market opportunity by Application ($ million)
- Exhibits58: Chart on Product - Market share 2023-2028 (%)
- Exhibits59: Data Table on Product - Market share 2023-2028 (%)
- Exhibits60: Chart on Comparison by Product
- Exhibits61: Data Table on Comparison by Product
- Exhibits62: Chart on Mobile computers - Market size and forecast 2023-2028 ($ million)
- Exhibits63: Data Table on Mobile computers - Market size and forecast 2023-2028 ($ million)
- Exhibits64: Chart on Mobile computers - Year-over-year growth 2023-2028 (%)
- Exhibits65: Data Table on Mobile computers - Year-over-year growth 2023-2028 (%)
- Exhibits66: Chart on Handheld scanners - Market size and forecast 2023-2028 ($ million)
- Exhibits67: Data Table on Handheld scanners - Market size and forecast 2023-2028 ($ million)
- Exhibits68: Chart on Handheld scanners - Year-over-year growth 2023-2028 (%)
- Exhibits69: Data Table on Handheld scanners - Year-over-year growth 2023-2028 (%)
- Exhibits70: Chart on Ring scanners - Market size and forecast 2023-2028 ($ million)
- Exhibits71: Data Table on Ring scanners - Market size and forecast 2023-2028 ($ million)
- Exhibits72: Chart on Ring scanners - Year-over-year growth 2023-2028 (%)
- Exhibits73: Data Table on Ring scanners - Year-over-year growth 2023-2028 (%)
- Exhibits74: Market opportunity by Product ($ million)
- Exhibits75: Data Table on Market opportunity by Product ($ million)
- Exhibits76: Analysis of price sensitivity, lifecycle, customer purchase basket, adoption rates, and purchase criteria
- Exhibits77: Chart on Market share By Geographical Landscape2023-2028 (%)
- Exhibits78: Data Table on Market share By Geographical Landscape2023-2028 (%)
- Exhibits79: Chart on Geographic comparison
- Exhibits80: Data Table on Geographic comparison
- Exhibits81: Chart on North America - Market size and forecast 2023-2028 ($ million)
- Exhibits82: Data Table on North America - Market size and forecast 2023-2028 ($ million)
- Exhibits83: Chart on North America - Year-over-year growth 2023-2028 (%)
- Exhibits84: Data Table on North America - Year-over-year growth 2023-2028 (%)
- Exhibits85: Chart on APAC - Market size and forecast 2023-2028 ($ million)
- Exhibits86: Data Table on APAC - Market size and forecast 2023-2028 ($ million)
- Exhibits87: Chart on APAC - Year-over-year growth 2023-2028 (%)
- Exhibits88: Data Table on APAC - Year-over-year growth 2023-2028 (%)
- Exhibits89: Chart on Europe - Market size and forecast 2023-2028 ($ million)
- Exhibits90: Data Table on Europe - Market size and forecast 2023-2028 ($ million)
- Exhibits91: Chart on Europe - Year-over-year growth 2023-2028 (%)
- Exhibits92: Data Table on Europe - Year-over-year growth 2023-2028 (%)
- Exhibits93: Chart on South America - Market size and forecast 2023-2028 ($ million)
- Exhibits94: Data Table on South America - Market size and forecast 2023-2028 ($ million)
- Exhibits95: Chart on South America - Year-over-year growth 2023-2028 (%)
- Exhibits96: Data Table on South America - Year-over-year growth 2023-2028 (%)
- Exhibits97: Chart on Middle East and Africa - Market size and forecast 2023-2028 ($ million)
- Exhibits98: Data Table on Middle East and Africa - Market size and forecast 2023-2028 ($ million)
- Exhibits99: Chart on Middle East and Africa - Year-over-year growth 2023-2028 (%)
- Exhibits100: Data Table on Middle East and Africa - Year-over-year growth 2023-2028 (%)
- Exhibits101: Chart on US - Market size and forecast 2023-2028 ($ million)
- Exhibits102: Data Table on US - Market size and forecast 2023-2028 ($ million)
- Exhibits103: Chart on US - Year-over-year growth 2023-2028 (%)
- Exhibits104: Data Table on US - Year-over-year growth 2023-2028 (%)
- Exhibits105: Chart on China - Market size and forecast 2023-2028 ($ million)
- Exhibits106: Data Table on China - Market size and forecast 2023-2028 ($ million)
- Exhibits107: Chart on China - Year-over-year growth 2023-2028 (%)
- Exhibits108: Data Table on China - Year-over-year growth 2023-2028 (%)
- Exhibits109: Chart on Germany - Market size and forecast 2023-2028 ($ million)
- Exhibits110: Data Table on Germany - Market size and forecast 2023-2028 ($ million)
- Exhibits111: Chart on Germany - Year-over-year growth 2023-2028 (%)
- Exhibits112: Data Table on Germany - Year-over-year growth 2023-2028 (%)
- Exhibits113: Chart on Canada - Market size and forecast 2023-2028 ($ million)
- Exhibits114: Data Table on Canada - Market size and forecast 2023-2028 ($ million)
- Exhibits115: Chart on Canada - Year-over-year growth 2023-2028 (%)
- Exhibits116: Data Table on Canada - Year-over-year growth 2023-2028 (%)
- Exhibits117: Chart on Japan - Market size and forecast 2023-2028 ($ million)
- Exhibits118: Data Table on Japan - Market size and forecast 2023-2028 ($ million)
- Exhibits119: Chart on Japan - Year-over-year growth 2023-2028 (%)
- Exhibits120: Data Table on Japan - Year-over-year growth 2023-2028 (%)
- Exhibits121: Market opportunity By Geographical Landscape($ million)
- Exhibits122: Data Tables on Market opportunity By Geographical Landscape($ million)
- Exhibits123: Impact of drivers and challenges in 2023 and 2028
- Exhibits124: Overview on criticality of inputs and factors of differentiation
- Exhibits125: Overview on factors of disruption
- Exhibits126: Impact of key risks on business
- Exhibits127: Companies covered
- Exhibits128: Matrix on companies position and classification
- Exhibits129: Advantech Co. Ltd. - Overview
- Exhibits130: Advantech Co. Ltd. - Business segments
- Exhibits131: Advantech Co. Ltd. - Key news
- Exhibits132: Advantech Co. Ltd. - Key offerings
- Exhibits133: Advantech Co. Ltd. - Segment focus
- Exhibits134: Bluebird Inc. - Overview
- Exhibits135: Bluebird Inc. - Product / Service
- Exhibits136: Bluebird Inc. - Key offerings
- Exhibits137: CipherLab Co. Ltd. - Overview
- Exhibits138: CipherLab Co. Ltd. - Product / Service
- Exhibits139: CipherLab Co. Ltd. - Key offerings
- Exhibits140: Cognex Corp. - Overview
- Exhibits141: Cognex Corp. - Product / Service
- Exhibits142: Cognex Corp. - Key news
- Exhibits143: Cognex Corp. - Key offerings
- Exhibits144: Datalogic SpA - Overview
- Exhibits145: Datalogic SpA - Business segments
- Exhibits146: Datalogic SpA - Key offerings
- Exhibits147: Datalogic SpA - Segment focus
- Exhibits148: DENSO Corp. - Overview
- Exhibits149: DENSO Corp. - Business segments
- Exhibits150: DENSO Corp. - Key news
- Exhibits151: DENSO Corp. - Key offerings
- Exhibits152: DENSO Corp. - Segment focus
- Exhibits153: EUROTECH Spa - Overview
- Exhibits154: EUROTECH Spa - Business segments
- Exhibits155: EUROTECH Spa - Key offerings
- Exhibits156: EUROTECH Spa - Segment focus
- Exhibits157: Generalscan - Overview
- Exhibits158: Generalscan - Product / Service
- Exhibits159: Generalscan - Key offerings
- Exhibits160: Honeywell International Inc. - Overview
- Exhibits161: Honeywell International Inc. - Business segments
- Exhibits162: Honeywell International Inc. - Key news
- Exhibits163: Honeywell International Inc. - Key offerings
- Exhibits164: Honeywell International Inc. - Segment focus
- Exhibits165: OMRON Corp. - Overview
- Exhibits166: OMRON Corp. - Business segments
- Exhibits167: OMRON Corp. - Key news
- Exhibits168: OMRON Corp. - Key offerings
- Exhibits169: OMRON Corp. - Segment focus
- Exhibits170: Opticon Sensors Europe BV - Overview
- Exhibits171: Opticon Sensors Europe BV - Product / Service
- Exhibits172: Opticon Sensors Europe BV - Key offerings
- Exhibits173: SATO Holdings Corp. - Overview
- Exhibits174: SATO Holdings Corp. - Business segments
- Exhibits175: SATO Holdings Corp. - Key news
- Exhibits176: SATO Holdings Corp. - Key offerings
- Exhibits177: SATO Holdings Corp. - Segment focus
- Exhibits178: Unipro Tech Solutions Pvt. Ltd. - Overview
- Exhibits179: Unipro Tech Solutions Pvt. Ltd. - Product / Service
- Exhibits180: Unipro Tech Solutions Pvt. Ltd. - Key offerings
- Exhibits181: Unitech Computer Co. Ltd. - Overview
- Exhibits182: Unitech Computer Co. Ltd. - Product / Service
- Exhibits183: Unitech Computer Co. Ltd. - Key offerings
- Exhibits184: Zebra Technologies Corp. - Overview
- Exhibits185: Zebra Technologies Corp. - Business segments
- Exhibits186: Zebra Technologies Corp. - Key news
- Exhibits187: Zebra Technologies Corp. - Key offerings
- Exhibits188: Zebra Technologies Corp. - Segment focus
- Exhibits189: Inclusions checklist
- Exhibits190: Exclusions checklist
- Exhibits191: Currency conversion rates for US$
- Exhibits192: Research methodology
- Exhibits193: Information sources
- Exhibits194: Data validation
- Exhibits195: Validation techniques employed for market sizing
- Exhibits196: Data synthesis
- Exhibits197: 360 degree market analysis
- Exhibits198: List of abbreviations
Industrial Barcode Scanner Market 2024-2028
The industrial barcode scanner market is forecasted to grow by USD 2611.7 mn during 2023-2028, accelerating at a CAGR of 10.68% during the forecast period. The report on the industrial barcode scanner market provides a holistic analysis, market size and forecast, trends, growth drivers, and challenges, as well as vendor analysis covering around 25 vendors.
The report offers an up-to-date analysis regarding the current market scenario, the latest trends and drivers, and the overall market environment. The market is driven by evolution of industry 4.0, rise in adoption of wearable barcode scanners in the manufacturing industry, and increased deployment of mobile workforce.
| Market Scope | |
|---|---|
| Base Year | 2024 |
| End Year | 2028 |
| Series Year | 2024-2028 |
| Growth Momentum | Accelerate |
| YOY 2024 | 9.38% |
| CAGR | 10.68% |
| Incremental Value | $2611.7mn |
Technavio's industrial barcode scanner market is segmented as below:
By Application
- Manufacturing
- Transportation and logistics
- Retail
- Food and beverages
- Others
By Product
- Mobile computers
- Handheld scanners
- Ring scanners
By Geography
- North America
- APAC
- Europe
- South America
- Middle East and Africa
This study identifies the use of wearables with the same functionalities as traditional barcode scanners as one of the prime reasons driving the industrial barcode scanner market growth during the next few years. Also, growing demand for rugged industrial barcode scanners and increased use of big data with data captured from barcode scanners will lead to sizable demand in the market.
The report on the industrial barcode scanner market covers the following areas:
- Industrial barcode scanner market sizing
- Industrial barcode scanner market forecast
- Industrial barcode scanner market industry analysis
The robust vendor analysis is designed to help clients improve their market position, and in line with this, this report provides a detailed analysis of several leading industrial barcode scanner market vendors that include Advantech Co. Ltd., Bluebird Inc., CipherLab Co. Ltd., Cognex Corp., Datalogic SpA, DENSO Corp., EUROTECH Spa, Generalscan, Honeywell International Inc., Mexxen Technology Inc., Newland Digital Technology Co. Ltd., OMRON Corp., Opticon Sensors Europe BV, Portable Technology Solutions LLC, RIOTEC Co. Ltd., SATO Holdings Corp., Unipro Tech Solutions Pvt. Ltd., Unitech Computer Co. Ltd., ZEBEX INDUSTRIES INC., and Zebra Technologies Corp.. Also, the industrial barcode scanner market analysis report includes information on upcoming trends and challenges that will influence market growth. This is to help companies strategize and leverage all forthcoming growth opportunities.
The study was conducted using an objective combination of primary and secondary information including inputs from key participants in the industry. The report contains a comprehensive market and vendor landscape in addition to an analysis of the key vendors.
The publisher presents a detailed picture of the market by the way of study, synthesis, and summation of data from multiple sources by an analysis of key parameters such as profit, pricing, competition, and promotions. It presents various market facets by identifying the key industry influencers. The data presented is comprehensive, reliable, and a result of extensive research - both primary and secondary. The market research reports provide a complete competitive landscape and an in-depth vendor selection methodology and analysis using qualitative and quantitative research to forecast the accurate market growth.
Table of Contents
1 Executive Summary
- 1.1 Market overview
- Executive Summary - Chart on Market Overview
- Executive Summary - Data Table on Market Overview
- Executive Summary - Chart on Global Market Characteristics
- Executive Summary - Chart on Market by Geography
- Executive Summary - Chart on Market Segmentation by Application
- Executive Summary - Chart on Market Segmentation by Product
- Executive Summary - Chart on Incremental Growth
- Executive Summary - Data Table on Incremental Growth
- Executive Summary - Chart on Company Market Positioning
2 Market Landscape
- 2.1 Market ecosystem
- Parent Market
- Data Table on - Parent Market
- 2.2 Market characteristics
- Market characteristics analysis
- 2.3 Value chain analysis
- Value Chain Analysis
3 Market Sizing
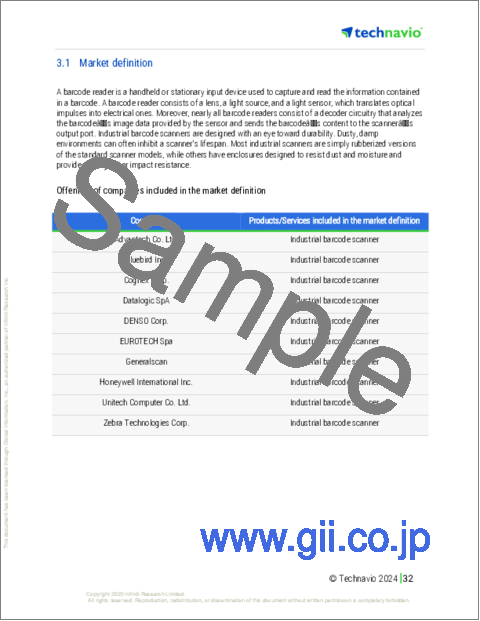
- 3.1 Market definition
- Offerings of companies included in the market definition
- 3.2 Market segment analysis
- Market segments
- 3.3 Market size 2023
- 3.4 Market outlook: Forecast for 2023-2028
- Chart on Global - Market size and forecast 2023-2028 ($ million)
- Data Table on Global - Market size and forecast 2023-2028 ($ million)
- Chart on Global Market: Year-over-year growth 2023-2028 (%)
- Data Table on Global Market: Year-over-year growth 2023-2028 (%)
4 Historic Market Size
- 4.1 Global Industrial Barcode Scanner Market 2018 - 2022
- Historic Market Size - Data Table on Global Industrial Barcode Scanner Market 2018 - 2022 ($ million)
- 4.2 Application segment analysis 2018 - 2022
- Historic Market Size - Application Segment 2018 - 2022 ($ million)
- 4.3 Product segment analysis 2018 - 2022
- Historic Market Size - Product Segment 2018 - 2022 ($ million)
- 4.4 Geography segment analysis 2018 - 2022
- Historic Market Size - Geography Segment 2018 - 2022 ($ million)
- 4.5 Country segment analysis 2018 - 2022
- Historic Market Size - Country Segment 2018 - 2022 ($ million)
5 Five Forces Analysis
- 5.1 Five forces summary
- Five forces analysis - Comparison between 2023 and 2028
- 5.2 Bargaining power of buyers
- Bargaining power of buyers - Impact of key factors 2023 and 2028
- 5.3 Bargaining power of suppliers
- Bargaining power of suppliers - Impact of key factors in 2023 and 2028
- 5.4 Threat of new entrants
- Threat of new entrants - Impact of key factors in 2023 and 2028
- 5.5 Threat of substitutes
- Threat of substitutes - Impact of key factors in 2023 and 2028
- 5.6 Threat of rivalry
- Threat of rivalry - Impact of key factors in 2023 and 2028
- 5.7 Market condition
- Chart on Market condition - Five forces 2023 and 2028
6 Market Segmentation by Application
- 6.1 Market segments
- Chart on Application - Market share 2023-2028 (%)
- Data Table on Application - Market share 2023-2028 (%)
- 6.2 Comparison by Application
- Chart on Comparison by Application
- Data Table on Comparison by Application
- 6.3 Manufacturing - Market size and forecast 2023-2028
- Chart on Manufacturing - Market size and forecast 2023-2028 ($ million)
- Data Table on Manufacturing - Market size and forecast 2023-2028 ($ million)
- Chart on Manufacturing - Year-over-year growth 2023-2028 (%)
- Data Table on Manufacturing - Year-over-year growth 2023-2028 (%)
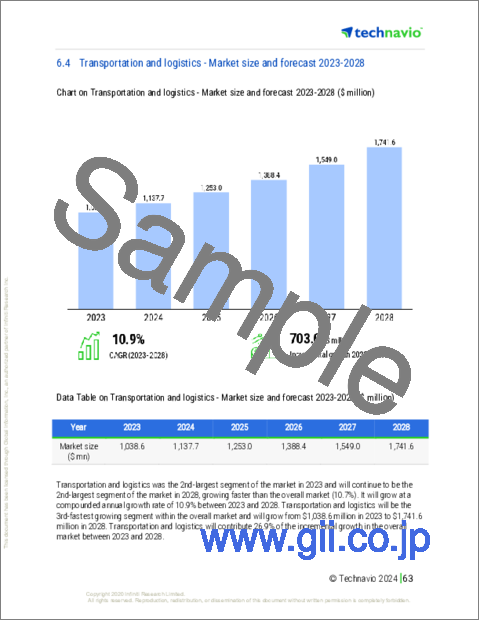
- 6.4 Transportation and logistics - Market size and forecast 2023-2028
- Chart on Transportation and logistics - Market size and forecast 2023-2028 ($ million)
- Data Table on Transportation and logistics - Market size and forecast 2023-2028 ($ million)
- Chart on Transportation and logistics - Year-over-year growth 2023-2028 (%)
- Data Table on Transportation and logistics - Year-over-year growth 2023-2028 (%)
- 6.5 Retail - Market size and forecast 2023-2028
- Chart on Retail - Market size and forecast 2023-2028 ($ million)
- Data Table on Retail - Market size and forecast 2023-2028 ($ million)
- Chart on Retail - Year-over-year growth 2023-2028 (%)
- Data Table on Retail - Year-over-year growth 2023-2028 (%)
- 6.6 Food and beverages - Market size and forecast 2023-2028
- Chart on Food and beverages - Market size and forecast 2023-2028 ($ million)
- Data Table on Food and beverages - Market size and forecast 2023-2028 ($ million)
- Chart on Food and beverages - Year-over-year growth 2023-2028 (%)
- Data Table on Food and beverages - Year-over-year growth 2023-2028 (%)
- 6.7 Others - Market size and forecast 2023-2028
- Chart on Others - Market size and forecast 2023-2028 ($ million)
- Data Table on Others - Market size and forecast 2023-2028 ($ million)
- Chart on Others - Year-over-year growth 2023-2028 (%)
- Data Table on Others - Year-over-year growth 2023-2028 (%)
- 6.8 Market opportunity by Application
- Market opportunity by Application ($ million)
- Data Table on Market opportunity by Application ($ million)
7 Market Segmentation by Product
- 7.1 Market segments
- Chart on Product - Market share 2023-2028 (%)
- Data Table on Product - Market share 2023-2028 (%)
- 7.2 Comparison by Product
- Chart on Comparison by Product
- Data Table on Comparison by Product
- 7.3 Mobile computers - Market size and forecast 2023-2028
- Chart on Mobile computers - Market size and forecast 2023-2028 ($ million)
- Data Table on Mobile computers - Market size and forecast 2023-2028 ($ million)
- Chart on Mobile computers - Year-over-year growth 2023-2028 (%)
- Data Table on Mobile computers - Year-over-year growth 2023-2028 (%)
- 7.4 Handheld scanners - Market size and forecast 2023-2028
- Chart on Handheld scanners - Market size and forecast 2023-2028 ($ million)
- Data Table on Handheld scanners - Market size and forecast 2023-2028 ($ million)
- Chart on Handheld scanners - Year-over-year growth 2023-2028 (%)
- Data Table on Handheld scanners - Year-over-year growth 2023-2028 (%)
- 7.5 Ring scanners - Market size and forecast 2023-2028
- Chart on Ring scanners - Market size and forecast 2023-2028 ($ million)
- Data Table on Ring scanners - Market size and forecast 2023-2028 ($ million)
- Chart on Ring scanners - Year-over-year growth 2023-2028 (%)
- Data Table on Ring scanners - Year-over-year growth 2023-2028 (%)
- 7.6 Market opportunity by Product
- Market opportunity by Product ($ million)
- Data Table on Market opportunity by Product ($ million)
8 Customer Landscape
- 8.1 Customer landscape overview
- Analysis of price sensitivity, lifecycle, customer purchase basket, adoption rates, and purchase criteria
9 Geographic Landscape
- 9.1 Geographic segmentation
- Chart on Market share By Geographical Landscape2023-2028 (%)
- Data Table on Market share By Geographical Landscape2023-2028 (%)
- 9.2 Geographic comparison
- Chart on Geographic comparison
- Data Table on Geographic comparison
- 9.3 North America - Market size and forecast 2023-2028
- Chart on North America - Market size and forecast 2023-2028 ($ million)
- Data Table on North America - Market size and forecast 2023-2028 ($ million)
- Chart on North America - Year-over-year growth 2023-2028 (%)
- Data Table on North America - Year-over-year growth 2023-2028 (%)
- 9.4 APAC - Market size and forecast 2023-2028
- Chart on APAC - Market size and forecast 2023-2028 ($ million)
- Data Table on APAC - Market size and forecast 2023-2028 ($ million)
- Chart on APAC - Year-over-year growth 2023-2028 (%)
- Data Table on APAC - Year-over-year growth 2023-2028 (%)
- 9.5 Europe - Market size and forecast 2023-2028
- Chart on Europe - Market size and forecast 2023-2028 ($ million)
- Data Table on Europe - Market size and forecast 2023-2028 ($ million)
- Chart on Europe - Year-over-year growth 2023-2028 (%)
- Data Table on Europe - Year-over-year growth 2023-2028 (%)
- 9.6 South America - Market size and forecast 2023-2028
- Chart on South America - Market size and forecast 2023-2028 ($ million)
- Data Table on South America - Market size and forecast 2023-2028 ($ million)
- Chart on South America - Year-over-year growth 2023-2028 (%)
- Data Table on South America - Year-over-year growth 2023-2028 (%)
- 9.7 Middle East and Africa - Market size and forecast 2023-2028
- Chart on Middle East and Africa - Market size and forecast 2023-2028 ($ million)
- Data Table on Middle East and Africa - Market size and forecast 2023-2028 ($ million)
- Chart on Middle East and Africa - Year-over-year growth 2023-2028 (%)
- Data Table on Middle East and Africa - Year-over-year growth 2023-2028 (%)
- 9.8 US - Market size and forecast 2023-2028
- Chart on US - Market size and forecast 2023-2028 ($ million)
- Data Table on US - Market size and forecast 2023-2028 ($ million)
- Chart on US - Year-over-year growth 2023-2028 (%)
- Data Table on US - Year-over-year growth 2023-2028 (%)
- 9.9 China - Market size and forecast 2023-2028
- Chart on China - Market size and forecast 2023-2028 ($ million)
- Data Table on China - Market size and forecast 2023-2028 ($ million)
- Chart on China - Year-over-year growth 2023-2028 (%)
- Data Table on China - Year-over-year growth 2023-2028 (%)
- 9.10 Germany - Market size and forecast 2023-2028
- Chart on Germany - Market size and forecast 2023-2028 ($ million)
- Data Table on Germany - Market size and forecast 2023-2028 ($ million)
- Chart on Germany - Year-over-year growth 2023-2028 (%)
- Data Table on Germany - Year-over-year growth 2023-2028 (%)
- 9.11 Canada - Market size and forecast 2023-2028
- Chart on Canada - Market size and forecast 2023-2028 ($ million)
- Data Table on Canada - Market size and forecast 2023-2028 ($ million)
- Chart on Canada - Year-over-year growth 2023-2028 (%)
- Data Table on Canada - Year-over-year growth 2023-2028 (%)
- 9.12 Japan - Market size and forecast 2023-2028
- Chart on Japan - Market size and forecast 2023-2028 ($ million)
- Data Table on Japan - Market size and forecast 2023-2028 ($ million)
- Chart on Japan - Year-over-year growth 2023-2028 (%)
- Data Table on Japan - Year-over-year growth 2023-2028 (%)
- 9.13 Market opportunity by geography
- Market opportunity By Geographical Landscape($ million)
- Data Tables on Market opportunity By Geographical Landscape($ million)
10 Drivers, Challenges, and Opportunity/Restraints
- 10.1 Market drivers
- 10.2 Market challenges
- 10.3 Impact of drivers and challenges
- Impact of drivers and challenges in 2023 and 2028
- 10.4 Market opportunities/restraints
11 Competitive Landscape
- 11.1 Overview
- 11.2 Competitive Landscape
- Overview on criticality of inputs and factors of differentiation
- 11.3 Landscape disruption
- Overview on factors of disruption
- 11.4 Industry risks
- Impact of key risks on business
12 Competitive Analysis
- 12.1 Companies profiled
- Companies covered
- 12.2 Market positioning of companies
- Matrix on companies position and classification
- 12.3 Advantech Co. Ltd.
- Advantech Co. Ltd. - Overview
- Advantech Co. Ltd. - Business segments
- Advantech Co. Ltd. - Key news
- Advantech Co. Ltd. - Key offerings
- Advantech Co. Ltd. - Segment focus
- 12.4 Bluebird Inc.
- Bluebird Inc. - Overview
- Bluebird Inc. - Product / Service
- Bluebird Inc. - Key offerings
- 12.5 CipherLab Co. Ltd.
- CipherLab Co. Ltd. - Overview
- CipherLab Co. Ltd. - Product / Service
- CipherLab Co. Ltd. - Key offerings
- 12.6 Cognex Corp.
- Cognex Corp. - Overview
- Cognex Corp. - Product / Service
- Cognex Corp. - Key news
- Cognex Corp. - Key offerings
- 12.7 Datalogic SpA
- Datalogic SpA - Overview
- Datalogic SpA - Business segments
- Datalogic SpA - Key offerings
- Datalogic SpA - Segment focus
- 12.8 DENSO Corp.
- DENSO Corp. - Overview
- DENSO Corp. - Business segments
- DENSO Corp. - Key news
- DENSO Corp. - Key offerings
- DENSO Corp. - Segment focus
- 12.9 EUROTECH Spa
- EUROTECH Spa - Overview
- EUROTECH Spa - Business segments
- EUROTECH Spa - Key offerings
- EUROTECH Spa - Segment focus
- 12.10 Generalscan
- Generalscan - Overview
- Generalscan - Product / Service
- Generalscan - Key offerings
- 12.11 Honeywell International Inc.
- Honeywell International Inc. - Overview
- Honeywell International Inc. - Business segments
- Honeywell International Inc. - Key news
- Honeywell International Inc. - Key offerings
- Honeywell International Inc. - Segment focus
- 12.12 OMRON Corp.
- OMRON Corp. - Overview
- OMRON Corp. - Business segments
- OMRON Corp. - Key news
- OMRON Corp. - Key offerings
- OMRON Corp. - Segment focus
- 12.13 Opticon Sensors Europe BV
- Opticon Sensors Europe BV - Overview
- Opticon Sensors Europe BV - Product / Service
- Opticon Sensors Europe BV - Key offerings
- 12.14 SATO Holdings Corp.
- SATO Holdings Corp. - Overview
- SATO Holdings Corp. - Business segments
- SATO Holdings Corp. - Key news
- SATO Holdings Corp. - Key offerings
- SATO Holdings Corp. - Segment focus
- 12.15 Unipro Tech Solutions Pvt. Ltd.
- Unipro Tech Solutions Pvt. Ltd. - Overview
- Unipro Tech Solutions Pvt. Ltd. - Product / Service
- Unipro Tech Solutions Pvt. Ltd. - Key offerings
- 12.16 Unitech Computer Co. Ltd.
- Unitech Computer Co. Ltd. - Overview
- Unitech Computer Co. Ltd. - Product / Service
- Unitech Computer Co. Ltd. - Key offerings
- 12.17 Zebra Technologies Corp.
- Zebra Technologies Corp. - Overview
- Zebra Technologies Corp. - Business segments
- Zebra Technologies Corp. - Key news
- Zebra Technologies Corp. - Key offerings
- Zebra Technologies Corp. - Segment focus
13 Appendix
- 13.1 Scope of the report
- 13.2 Inclusions and exclusions checklist
- Inclusions checklist
- Exclusions checklist
- 13.3 Currency conversion rates for US$
- Currency conversion rates for US$
- 13.4 Research methodology
- Research methodology
- 13.5 Data procurement
- Information sources
- 13.6 Data validation
- Data validation
- 13.7 Validation techniques employed for market sizing
- Validation techniques employed for market sizing
- 13.8 Data synthesis
- Data synthesis
- 13.9 360 degree market analysis
- 360 degree market analysis
- 13.10 List of abbreviations
- List of abbreviations

