|
|
市場調査レポート
商品コード
1937145
金属積層造形の世界市場 2026年~2030年Global Metal Additive Manufacturing Market 2026-2030 |
||||||

|
|||||||
カスタマイズ可能
|
|||||||

| 金属積層造形の世界市場 2026年~2030年 |
|
出版日: 2026年02月11日
発行: TechNavio
ページ情報: 英文 308 Pages
納期: 即納可能
|

概要
世界の金属積層造形市場は、2025年から2030年にかけて70億3,280万米ドルの成長が見込まれ、予測期間中のCAGRは14.4%と予測されています。
本報告書では、世界の金属積層造形市場に関する包括的な分析、市場規模と予測、動向、成長要因、課題に加え、約25社のベンダー分析を提供しております。
本レポートは、現在の市場状況、最新の動向と促進要因、市場環境全般に関する最新の分析を提供します。市場の成長は、航空宇宙・防衛分野における生産規模の金属積層造形の産業化、個別化医療およびポイントオブケア医療用インプラントの急増、プロセス制御のためのAIおよびデジタルツイン技術の統合によって牽引されています。
本調査は、業界の主要関係者からの情報を含む一次情報と二次情報を客観的に組み合わせて実施されました。本レポートには、主要企業の分析に加え、包括的な市場規模データ、地域別分析を伴うセグメント、ベンダー情勢が含まれています。レポートには過去データと予測データが掲載されています。
| 市場範囲 | |
|---|---|
| 基準年 | 2026年 |
| 対象期間 | 2030年 |
| 予測期間 | 2026-2030 |
| 成長モメンタム | 加速 |
| 前年比2026年 | 12.9% |
| CAGR | 14.4% |
| 増分額 | 70億3,280万米ドル |
本調査では、今後数年間における世界の金属積層造形市場成長を牽引する主要要因の一つとして、産業規模のマルチレーザーシステムの普及と量産技術の成熟を挙げております。また、特殊材料ポートフォリオの進化、環境に配慮した冶金工学、宇宙空間での製造および微小重力下での材料加工への移行が、市場において相当な需要を生み出すものと見込まれます。
目次
第1章 エグゼクティブサマリー
第2章 Technavio分析
- 価格・ライフサイクル・顧客購入バスケット・採用率・購入基準の分析
- インプットの重要性と差別化の要因
- 混乱の要因
- 促進要因と課題の影響
第3章 市場情勢
- 市場エコシステム
- 市場の特徴
- バリューチェーン分析
第4章 市場規模
- 市場の定義
- 市場セグメント分析
- 市場規模 2025
- 市場の見通し 2025-2030
第5章 市場規模実績
- 金属積層造形の世界市場 2020-2024
- タイプセグメント分析 2020-2024
- 用途別セグメント分析 2020-2024
- 材料セグメント分析 2020-2024
- 地域別セグメント分析 2020-2024
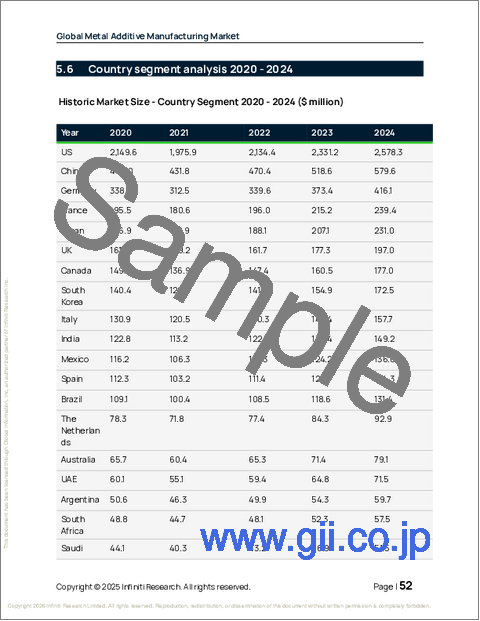
- 国別セグメント分析 2020-2024
第6章 定性分析
- AIの影響:金属積層造形の世界市場
第7章 ファイブフォース分析
- ファイブフォースの要約
- 買い手の交渉力
- 供給企業の交渉力
- 新規参入業者の脅威
- 代替品の脅威
- 競争の脅威
- 市況
第8章 市場セグメンテーション:タイプ別
- 比較:タイプ別
- 選択的レーザー溶融法
- 電子ビーム溶解
- 市場機会:タイプ別
第9章 市場セグメンテーション:用途別
- 比較:用途別
- 航空宇宙
- ヘルスケア
- 工具・金型
- 自動車
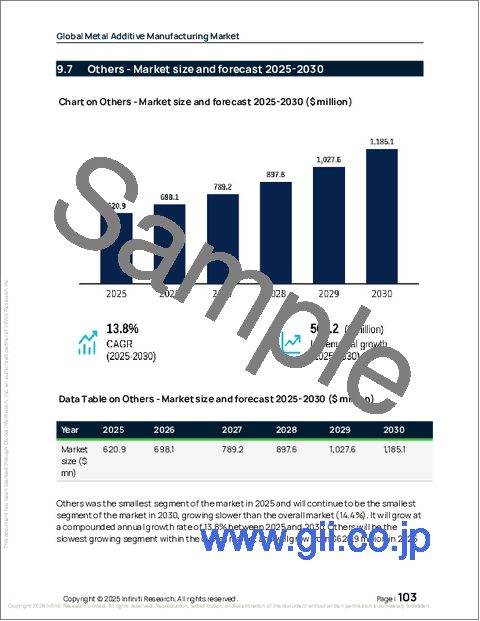
- その他
- 市場機会:用途別
第10章 市場セグメンテーション:素材別
- 比較:素材別
- ステンレス鋼
- チタン及びその合金
- ニッケル合金
- アルミニウム合金
- その他
- 市場機会:素材別
第11章 顧客情勢
第12章 地域別情勢
- 地域別セグメンテーション
- 地域別比較
- 北米
- 米国
- カナダ
- メキシコ
- 欧州
- ドイツ
- フランス
- 英国
- イタリア
- スペイン
- オランダ
- アジア太平洋
- 中国
- 日本
- 韓国
- インド
- オーストラリア
- インドネシア
- 南米
- ブラジル
- アルゼンチン
- コロンビア
- 中東・アフリカ
- アラブ首長国連邦
- 南アフリカ
- サウジアラビア
- イスラエル
- エジプト
- 市場機会:地域別
第13章 促進要因・課題・機会
- 市場促進要因
- 市場の課題
- 促進要因と課題の影響
- 市場機会
第14章 競合情勢
- 概要
- 競合情勢
- 混乱の状況
- 業界のリスク
第15章 競合分析
- 企業プロファイル
- 企業ランキング指標
- 企業の市場ポジショニング
- 3D Systems Corp.
- Additive Industries BV
- DMG MORI Co. Ltd.
- EOS GmbH
- Eplus 3D
- Hoganas AB
- HP Inc.
- Markforged Holding Corp.
- Nikon Corp.
- Optomec Inc.
- Renishaw Plc
- Sandvik AB
- Stratasys Ltd.
- The Lincoln Electric Co.
- Xact Metal Inc.
