|
|
市場調査レポート
商品コード
1491584
非可塑化ポリ塩化ビニル(UPVC)窓の世界市場2024-2028Global unplasticized polyvinyl chloride (UPVC) windows 2024-2028 |
||||||

|
|||||||
カスタマイズ可能
|
|||||||


| 非可塑化ポリ塩化ビニル(UPVC)窓の世界市場2024-2028 |
|
出版日: 2024年05月22日
発行: TechNavio
ページ情報: 英文 160 Pages
納期: 即納可能
|

全表示
- 概要
- 図表
- 目次
非可塑化ポリ塩化ビニル(UPVC)窓市場は2023-2028年に101億6,580万米ドル、予測期間中のCAGRは7.76%で成長すると予測されます。
当レポートでは、非可塑化ポリ塩化ビニル(UPVC)の窓市場について、市場規模や予測、動向、成長促進要因・課題、約25のベンダーを網羅したベンダー分析など、全体的な分析を掲載しています。
現在の市場シナリオ、最新動向と促進要因、市場環境全体に関する最新分析を提供しています。市場は、住宅建設分野の成長、エネルギー効率の高い窓の需要、アップビニールガラス窓の採用拡大が牽引しています。
| 市場範囲 | |
|---|---|
| 基準年 | 2024 |
| 終了年 | 2028 |
| 予測期間 | 2024-2028 |
| 成長モメンタム | 加速 |
| 前年比2024年 | 7.05% |
| CAGR | 7.76% |
| 増分額 | 101億6,580万米ドル |
本調査では、今後数年間の非可塑化ポリ塩化ビニル(UPVC)窓市場の成長を促進する主な要因の一つとして、セルラーPVC窓への進化を挙げています。また、美観への注目の高まりや自動化・遠隔操作の出現は、市場の大きな需要につながると思われます。
目次
第1章 エグゼクティブサマリー
- 市場概要
第2章 市場情勢
- 市場エコシステム
- 市場の特徴
- バリューチェーン分析
第3章 市場規模の評価
- 市場の定義
- 市場セグメント分析
- 市場規模 2023
- 市場の見通し 2023-2028
第4章 市場規模実績
- 世界の非可塑性ポリ塩化ビニル(UPVC)窓市場 2018-2022
- 用途別セグメント分析 2018-2022
- 流通チャネルセグメント分析 2018-2022
- 地域別セグメント分析 2018-2022
- 国別セグメント分析 2018-2022
第5章 ファイブフォース分析
- ファイブフォースの要約
- 買い手の交渉力
- 供給企業の交渉力
- 新規参入業者の脅威
- 代替品の脅威
- 競争の脅威
- 市況
第6章 市場セグメンテーション:用途別
- 市場セグメンテーション
- 比較:用途別
- 住宅用:市場規模と予測 2023-2028
- 商業用:市場規模と予測 2023-2028
- 市場機会:用途別
第7章 流通チャネル別市場セグメンテーション
- 市場セグメンテーション
- 比較:流通チャネル別
- オフライン:市場規模と予測 2023-2028
- オンライン:市場規模と予測 2023-2028
- 市場機会:流通チャネル別
第8章 顧客情勢
- 顧客情勢の概要
第9章 地域別情勢
- 地域別セグメンテーション
- 地域別比較
- アジア太平洋:市場規模と予測 2023-2028
- 北米:市場規模と予測 2023-2028
- 欧州:市場規模と予測 2023-2028
- 中東・アフリカ:市場規模と予測 2023-2028
- 南米:市場規模と予測 2023-2028
- 米国:市場規模と予測 2023-2028
- 中国:市場規模と予測 2023-2028
- インド:市場規模と予測 2023-2028
- ドイツ:市場規模と予測 2023-2028
- 日本:市場規模と予測 2023-2028
- 市場機会:地域情勢別
第10章 促進要因・課題・機会・抑制要因
- 市場促進要因
- 市場の課題
- 促進要因と課題の影響
- 市場の機会・抑制要因
第11章 競合情勢
- 概要
- 競合情勢
- 混乱の状況
- 業界のリスク
第12章 競合分析
- 企業プロファイル
- 企業の市場ポジショニング
- ADOPEN Plastik Sanayi AS
- Aluplast GmbH
- Aparna Enterprises Ltd.
- China Lesso Group Holdings Ltd.
- Deceuninck Group
- Duroplast Extrusions Pvt. Ltd.
- Encraft India Pvt. Ltd.
- Everest 2020 Ltd.
- Fenesta
- Internorm International GmbH
- Karl Lingel Fensterbau Gmbh and Co. KG
- Munster Joinery
- profine GmbH
- REHAU Ltd.
- VEKA AG
第13章 付録
Exhibits:
- Exhibits1: Executive Summary - Chart on Market Overview
- Exhibits2: Executive Summary - Data Table on Market Overview
- Exhibits3: Executive Summary - Chart on Global Market Characteristics
- Exhibits4: Executive Summary - Chart on Market By Geographical Landscape
- Exhibits5: Executive Summary - Chart on Market Segmentation by Application
- Exhibits6: Executive Summary - Chart on Market Segmentation by Distribution Channel
- Exhibits7: Executive Summary - Chart on Incremental Growth
- Exhibits8: Executive Summary - Data Table on Incremental Growth
- Exhibits9: Executive Summary - Chart on Company Market Positioning
- Exhibits10: Parent Market
- Exhibits11: Data Table on - Parent Market
- Exhibits12: Market characteristics analysis
- Exhibits13: Value Chain Analysis
- Exhibits14: Offerings of companies included in the market definition
- Exhibits15: Market segments
- Exhibits16: Chart on Global - Market size and forecast 2023-2028 ($ million)
- Exhibits17: Data Table on Global - Market size and forecast 2023-2028 ($ million)
- Exhibits18: Chart on Global Market: Year-over-year growth 2023-2028 (%)
- Exhibits19: Data Table on Global Market: Year-over-year growth 2023-2028 (%)
- Exhibits20: Historic Market Size - Data Table on Global Unplasticized Polyvinyl Chloride (UPVC) Windows 2018 - 2022 ($ million)
- Exhibits21: Historic Market Size - Application Segment 2018 - 2022 ($ million)
- Exhibits22: Historic Market Size - Distribution Channel Segment 2018 - 2022 ($ million)
- Exhibits23: Historic Market Size - Geography Segment 2018 - 2022 ($ million)
- Exhibits24: Historic Market Size - Country Segment 2018 - 2022 ($ million)
- Exhibits25: Five forces analysis - Comparison between 2023 and 2028
- Exhibits26: Bargaining power of buyers - Impact of key factors 2023 and 2028
- Exhibits27: Bargaining power of suppliers - Impact of key factors in 2023 and 2028
- Exhibits28: Threat of new entrants - Impact of key factors in 2023 and 2028
- Exhibits29: Threat of substitutes - Impact of key factors in 2023 and 2028
- Exhibits30: Threat of rivalry - Impact of key factors in 2023 and 2028
- Exhibits31: Chart on Market condition - Five forces 2023 and 2028
- Exhibits32: Chart on Application - Market share 2023-2028 (%)
- Exhibits33: Data Table on Application - Market share 2023-2028 (%)
- Exhibits34: Chart on Comparison by Application
- Exhibits35: Data Table on Comparison by Application
- Exhibits36: Chart on Residential - Market size and forecast 2023-2028 ($ million)
- Exhibits37: Data Table on Residential - Market size and forecast 2023-2028 ($ million)
- Exhibits38: Chart on Residential - Year-over-year growth 2023-2028 (%)
- Exhibits39: Data Table on Residential - Year-over-year growth 2023-2028 (%)
- Exhibits40: Chart on Commercial - Market size and forecast 2023-2028 ($ million)
- Exhibits41: Data Table on Commercial - Market size and forecast 2023-2028 ($ million)
- Exhibits42: Chart on Commercial - Year-over-year growth 2023-2028 (%)
- Exhibits43: Data Table on Commercial - Year-over-year growth 2023-2028 (%)
- Exhibits44: Market opportunity by Application ($ million)
- Exhibits45: Data Table on Market opportunity by Application ($ million)
- Exhibits46: Chart on Distribution Channel - Market share 2023-2028 (%)
- Exhibits47: Data Table on Distribution Channel - Market share 2023-2028 (%)
- Exhibits48: Chart on Comparison by Distribution Channel
- Exhibits49: Data Table on Comparison by Distribution Channel
- Exhibits50: Chart on Offline - Market size and forecast 2023-2028 ($ million)
- Exhibits51: Data Table on Offline - Market size and forecast 2023-2028 ($ million)
- Exhibits52: Chart on Offline - Year-over-year growth 2023-2028 (%)
- Exhibits53: Data Table on Offline - Year-over-year growth 2023-2028 (%)
- Exhibits54: Chart on Online - Market size and forecast 2023-2028 ($ million)
- Exhibits55: Data Table on Online - Market size and forecast 2023-2028 ($ million)
- Exhibits56: Chart on Online - Year-over-year growth 2023-2028 (%)
- Exhibits57: Data Table on Online - Year-over-year growth 2023-2028 (%)
- Exhibits58: Market opportunity by Distribution Channel ($ million)
- Exhibits59: Data Table on Market opportunity by Distribution Channel ($ million)
- Exhibits60: Analysis of price sensitivity, lifecycle, customer purchase basket, adoption rates, and purchase criteria
- Exhibits61: Chart on Market share By Geographical Landscape 2023-2028 (%)
- Exhibits62: Data Table on Market share By Geographical Landscape 2023-2028 (%)
- Exhibits63: Chart on Geographic comparison
- Exhibits64: Data Table on Geographic comparison
- Exhibits65: Chart on APAC - Market size and forecast 2023-2028 ($ million)
- Exhibits66: Data Table on APAC - Market size and forecast 2023-2028 ($ million)
- Exhibits67: Chart on APAC - Year-over-year growth 2023-2028 (%)
- Exhibits68: Data Table on APAC - Year-over-year growth 2023-2028 (%)
- Exhibits69: Chart on North America - Market size and forecast 2023-2028 ($ million)
- Exhibits70: Data Table on North America - Market size and forecast 2023-2028 ($ million)
- Exhibits71: Chart on North America - Year-over-year growth 2023-2028 (%)
- Exhibits72: Data Table on North America - Year-over-year growth 2023-2028 (%)
- Exhibits73: Chart on Europe - Market size and forecast 2023-2028 ($ million)
- Exhibits74: Data Table on Europe - Market size and forecast 2023-2028 ($ million)
- Exhibits75: Chart on Europe - Year-over-year growth 2023-2028 (%)
- Exhibits76: Data Table on Europe - Year-over-year growth 2023-2028 (%)
- Exhibits77: Chart on Middle East and Africa - Market size and forecast 2023-2028 ($ million)
- Exhibits78: Data Table on Middle East and Africa - Market size and forecast 2023-2028 ($ million)
- Exhibits79: Chart on Middle East and Africa - Year-over-year growth 2023-2028 (%)
- Exhibits80: Data Table on Middle East and Africa - Year-over-year growth 2023-2028 (%)
- Exhibits81: Chart on South America - Market size and forecast 2023-2028 ($ million)
- Exhibits82: Data Table on South America - Market size and forecast 2023-2028 ($ million)
- Exhibits83: Chart on South America - Year-over-year growth 2023-2028 (%)
- Exhibits84: Data Table on South America - Year-over-year growth 2023-2028 (%)
- Exhibits85: Chart on US - Market size and forecast 2023-2028 ($ million)
- Exhibits86: Data Table on US - Market size and forecast 2023-2028 ($ million)
- Exhibits87: Chart on US - Year-over-year growth 2023-2028 (%)
- Exhibits88: Data Table on US - Year-over-year growth 2023-2028 (%)
- Exhibits89: Chart on China - Market size and forecast 2023-2028 ($ million)
- Exhibits90: Data Table on China - Market size and forecast 2023-2028 ($ million)
- Exhibits91: Chart on China - Year-over-year growth 2023-2028 (%)
- Exhibits92: Data Table on China - Year-over-year growth 2023-2028 (%)
- Exhibits93: Chart on India - Market size and forecast 2023-2028 ($ million)
- Exhibits94: Data Table on India - Market size and forecast 2023-2028 ($ million)
- Exhibits95: Chart on India - Year-over-year growth 2023-2028 (%)
- Exhibits96: Data Table on India - Year-over-year growth 2023-2028 (%)
- Exhibits97: Chart on Germany - Market size and forecast 2023-2028 ($ million)
- Exhibits98: Data Table on Germany - Market size and forecast 2023-2028 ($ million)
- Exhibits99: Chart on Germany - Year-over-year growth 2023-2028 (%)
- Exhibits100: Data Table on Germany - Year-over-year growth 2023-2028 (%)
- Exhibits101: Chart on Japan - Market size and forecast 2023-2028 ($ million)
- Exhibits102: Data Table on Japan - Market size and forecast 2023-2028 ($ million)
- Exhibits103: Chart on Japan - Year-over-year growth 2023-2028 (%)
- Exhibits104: Data Table on Japan - Year-over-year growth 2023-2028 (%)
- Exhibits105: Market opportunity By Geographical Landscape ($ million)
- Exhibits106: Data Tables on Market opportunity By Geographical Landscape ($ million)
- Exhibits107: Impact of drivers and challenges in 2023 and 2028
- Exhibits108: Overview on criticality of inputs and factors of differentiation
- Exhibits109: Overview on factors of disruption
- Exhibits110: Impact of key risks on business
- Exhibits111: Companies covered
- Exhibits112: Matrix on companies position and classification
- Exhibits113: ADOPEN Plastik Sanayi AS - Overview
- Exhibits114: ADOPEN Plastik Sanayi AS - Product / Service
- Exhibits115: ADOPEN Plastik Sanayi AS - Key offerings
- Exhibits116: Aluplast GmbH - Overview
- Exhibits117: Aluplast GmbH - Product / Service
- Exhibits118: Aluplast GmbH - Key offerings
- Exhibits119: Aparna Enterprises Ltd. - Overview
- Exhibits120: Aparna Enterprises Ltd. - Product / Service
- Exhibits121: Aparna Enterprises Ltd. - Key offerings
- Exhibits122: China Lesso Group Holdings Ltd. - Overview
- Exhibits123: China Lesso Group Holdings Ltd. - Business segments
- Exhibits124: China Lesso Group Holdings Ltd. - Key offerings
- Exhibits125: China Lesso Group Holdings Ltd. - Segment focus
- Exhibits126: Deceuninck Group - Overview
- Exhibits127: Deceuninck Group - Business segments
- Exhibits128: Deceuninck Group - Key offerings
- Exhibits129: Deceuninck Group - Segment focus
- Exhibits130: Duroplast Extrusions Pvt. Ltd. - Overview
- Exhibits131: Duroplast Extrusions Pvt. Ltd. - Product / Service
- Exhibits132: Duroplast Extrusions Pvt. Ltd. - Key offerings
- Exhibits133: Encraft India Pvt. Ltd. - Overview
- Exhibits134: Encraft India Pvt. Ltd. - Product / Service
- Exhibits135: Encraft India Pvt. Ltd. - Key offerings
- Exhibits136: Everest 2020 Ltd. - Overview
- Exhibits137: Everest 2020 Ltd. - Product / Service
- Exhibits138: Everest 2020 Ltd. - Key offerings
- Exhibits139: Fenesta - Overview
- Exhibits140: Fenesta - Product / Service
- Exhibits141: Fenesta - Key offerings
- Exhibits142: Internorm International GmbH - Overview
- Exhibits143: Internorm International GmbH - Product / Service
- Exhibits144: Internorm International GmbH - Key offerings
- Exhibits145: Karl Lingel Fensterbau Gmbh and Co. KG - Overview
- Exhibits146: Karl Lingel Fensterbau Gmbh and Co. KG - Product / Service
- Exhibits147: Karl Lingel Fensterbau Gmbh and Co. KG - Key offerings
- Exhibits148: Munster Joinery - Overview
- Exhibits149: Munster Joinery - Product / Service
- Exhibits150: Munster Joinery - Key offerings
- Exhibits151: profine GmbH - Overview
- Exhibits152: profine GmbH - Product / Service
- Exhibits153: profine GmbH - Key offerings
- Exhibits154: REHAU Ltd. - Overview
- Exhibits155: REHAU Ltd. - Product / Service
- Exhibits156: REHAU Ltd. - Key offerings
- Exhibits157: VEKA AG - Overview
- Exhibits158: VEKA AG - Product / Service
- Exhibits159: VEKA AG - Key news
- Exhibits160: VEKA AG - Key offerings
- Exhibits161: Inclusions checklist
- Exhibits162: Exclusions checklist
- Exhibits163: Currency conversion rates for US$
- Exhibits164: Research methodology
- Exhibits165: Information sources
- Exhibits166: Data validation
- Exhibits167: Validation techniques employed for market sizing
- Exhibits168: Data synthesis
- Exhibits169: 360 degree market analysis
- Exhibits170: List of abbreviations
The unplasticized polyvinyl chloride (UPVC) windows market is forecasted to grow by USD 10165.8 mn during 2023-2028, accelerating at a CAGR of 7.76% during the forecast period. The report on the unplasticized polyvinyl chloride (UPVC) windows market provides a holistic analysis, market size and forecast, trends, growth drivers, and challenges, as well as vendor analysis covering around 25 vendors.
The report offers an up-to-date analysis regarding the current market scenario, the latest trends and drivers, and the overall market environment. The market is driven by growth in housing construction sector, demand for energy-efficient windows, and growing adoption of upvc windows.
| Market Scope | |
|---|---|
| Base Year | 2024 |
| End Year | 2028 |
| Series Year | 2024-2028 |
| Growth Momentum | Accelerate |
| YOY 2024 | 7.05% |
| CAGR | 7.76% |
| Incremental Value | $10165.8mn |
Technavio's unplasticized polyvinyl chloride (UPVC) windows market is segmented as below:
ByApplication
- Residential
- Commercial
ByDistribution Channel
- Offline
- Online
ByGeography
- APAC
- North America
- Europe
- Middle East and Africa
- South America
This study identifies the evolution toward cellular pvc windows as one of the prime reasons driving the unplasticized polyvinyl chloride (UPVC) windows market growth during the next few years. Also, increasing focus on aesthetics and emergence of automation and remote operation will lead to sizable demand in the market.
The report on the unplasticized polyvinyl chloride (UPVC) windows market covers the following areas:
- Unplasticized polyvinyl chloride (UPVC) windows market sizing
- Unplasticized polyvinyl chloride (UPVC) windows market forecast
- Unplasticized polyvinyl chloride (UPVC) windows market industry analysis
The robust vendor analysis is designed to help clients improve their market position, and in line with this, this report provides a detailed analysis of several leading unplasticized polyvinyl chloride (UPVC) windows market vendors that include ADOPEN Plastik Sanayi AS, AIS Glass Solutions Ltd., Aluplast GmbH, Aparna Enterprises Ltd., Canadian Choice Windows and Doors, China Lesso Group Holdings Ltd., Dalian Shide Plastic Building Materials Co. Ltd., Deceuninck Group, Duroplast Extrusions Pvt. Ltd., Encraft India Pvt. Ltd., Everest 2020 Ltd., Fenesta, Internorm International GmbH, Karl Lingel Fensterbau Gmbh and Co. KG, Malplas Ltd., Munster Joinery, profine GmbH, REHAU Ltd., VEKA AG, and Welltech Systems. Also, the unplasticized polyvinyl chloride (UPVC) windows market analysis report includes information on upcoming trends and challenges that will influence market growth. This is to help companies strategize and leverage all forthcoming growth opportunities.
The study was conducted using an objective combination of primary and secondary information including inputs from key participants in the industry. The report contains a comprehensive market and vendor landscape in addition to an analysis of the key vendors.
The publisher presents a detailed picture of the market by the way of study, synthesis, and summation of data from multiple sources by an analysis of key parameters such as profit, pricing, competition, and promotions. It presents various market facets by identifying the key industry influencers. The data presented is comprehensive, reliable, and a result of extensive research - both primary and secondary. The market research reports provide a complete competitive landscape and an in-depth vendor selection methodology and analysis using qualitative and quantitative research to forecast the accurate market growth.
Table of Contents
1 Executive Summary
- 1.1 Market overview
- Executive Summary - Chart on Market Overview
- Executive Summary - Data Table on Market Overview
- Executive Summary - Chart on Global Market Characteristics
- Executive Summary - Chart on Market By Geographical Landscape
- Executive Summary - Chart on Market Segmentation by Application
- Executive Summary - Chart on Market Segmentation by Distribution Channel
- Executive Summary - Chart on Incremental Growth
- Executive Summary - Data Table on Incremental Growth
- Executive Summary - Chart on Company Market Positioning
2 Market Landscape
- 2.1 Market ecosystem
- Parent Market
- Data Table on - Parent Market
- 2.2 Market characteristics
- Market characteristics analysis
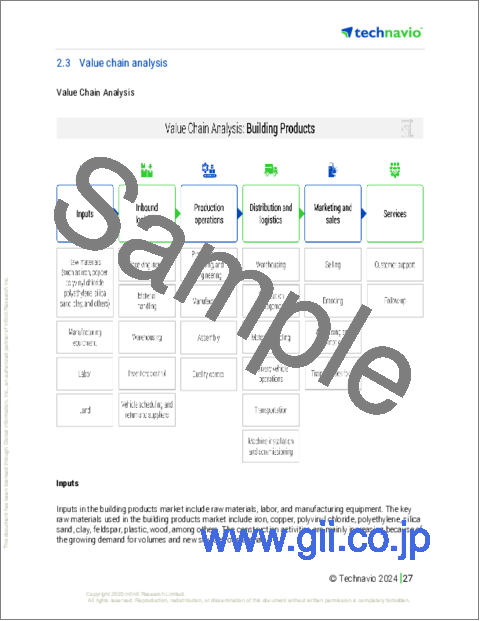
- 2.3 Value chain analysis
- Value Chain Analysis
3 Market Sizing
- 3.1 Market definition
- Offerings of companies included in the market definition
- 3.2 Market segment analysis
- Market segments
- 3.3 Market size 2023
- 3.4 Market outlook: Forecast for 2023-2028
- Chart on Global - Market size and forecast 2023-2028 ($ million)
- Data Table on Global - Market size and forecast 2023-2028 ($ million)
- Chart on Global Market: Year-over-year growth 2023-2028 (%)
- Data Table on Global Market: Year-over-year growth 2023-2028 (%)
4 Historic Market Size
- 4.1 Global Unplasticized Polyvinyl Chloride (UPVC) Windows Market 2018 - 2022
- Historic Market Size - Data Table on Global Unplasticized Polyvinyl Chloride (UPVC) Windows Market 2018 - 2022 ($ million)
- 4.2 Application segment analysis 2018 - 2022
- Historic Market Size - Application Segment 2018 - 2022 ($ million)
- 4.3 Distribution Channel segment analysis 2018 - 2022
- Historic Market Size - Distribution Channel Segment 2018 - 2022 ($ million)
- 4.4 Geography segment analysis 2018 - 2022
- Historic Market Size - Geography Segment 2018 - 2022 ($ million)
- 4.5 Country segment analysis 2018 - 2022
- Historic Market Size - Country Segment 2018 - 2022 ($ million)
5 Five Forces Analysis
- 5.1 Five forces summary
- Five forces analysis - Comparison between 2023 and 2028
- 5.2 Bargaining power of buyers
- Bargaining power of buyers - Impact of key factors 2023 and 2028
- 5.3 Bargaining power of suppliers
- Bargaining power of suppliers - Impact of key factors in 2023 and 2028
- 5.4 Threat of new entrants
- Threat of new entrants - Impact of key factors in 2023 and 2028
- 5.5 Threat of substitutes
- Threat of substitutes - Impact of key factors in 2023 and 2028
- 5.6 Threat of rivalry
- Threat of rivalry - Impact of key factors in 2023 and 2028
- 5.7 Market condition
- Chart on Market condition - Five forces 2023 and 2028
6 Market Segmentation by Application
- 6.1 Market segments
- Chart on Application - Market share 2023-2028 (%)
- Data Table on Application - Market share 2023-2028 (%)
- 6.2 Comparison by Application
- Chart on Comparison by Application
- Data Table on Comparison by Application
- 6.3 Residential - Market size and forecast 2023-2028
- Chart on Residential - Market size and forecast 2023-2028 ($ million)
- Data Table on Residential - Market size and forecast 2023-2028 ($ million)
- Chart on Residential - Year-over-year growth 2023-2028 (%)
- Data Table on Residential - Year-over-year growth 2023-2028 (%)
- 6.4 Commercial - Market size and forecast 2023-2028
- Chart on Commercial - Market size and forecast 2023-2028 ($ million)
- Data Table on Commercial - Market size and forecast 2023-2028 ($ million)
- Chart on Commercial - Year-over-year growth 2023-2028 (%)
- Data Table on Commercial - Year-over-year growth 2023-2028 (%)
- 6.5 Market opportunity by Application
- Market opportunity by Application ($ million)
- Data Table on Market opportunity by Application ($ million)
7 Market Segmentation by Distribution Channel
- 7.1 Market segments
- Chart on Distribution Channel - Market share 2023-2028 (%)
- Data Table on Distribution Channel - Market share 2023-2028 (%)
- 7.2 Comparison by Distribution Channel
- Chart on Comparison by Distribution Channel
- Data Table on Comparison by Distribution Channel
- 7.3 Offline - Market size and forecast 2023-2028
- Chart on Offline - Market size and forecast 2023-2028 ($ million)
- Data Table on Offline - Market size and forecast 2023-2028 ($ million)
- Chart on Offline - Year-over-year growth 2023-2028 (%)
- Data Table on Offline - Year-over-year growth 2023-2028 (%)
- 7.4 Online - Market size and forecast 2023-2028
- Chart on Online - Market size and forecast 2023-2028 ($ million)
- Data Table on Online - Market size and forecast 2023-2028 ($ million)
- Chart on Online - Year-over-year growth 2023-2028 (%)
- Data Table on Online - Year-over-year growth 2023-2028 (%)
- 7.5 Market opportunity by Distribution Channel
- Market opportunity by Distribution Channel ($ million)
- Data Table on Market opportunity by Distribution Channel ($ million)
8 Customer Landscape
- 8.1 Customer landscape overview
- Analysis of price sensitivity, lifecycle, customer purchase basket, adoption rates, and purchase criteria
9 Geographic Landscape
- 9.1 Geographic segmentation
- Chart on Market share By Geographical Landscape 2023-2028 (%)
- Data Table on Market share By Geographical Landscape 2023-2028 (%)
- 9.2 Geographic comparison
- Chart on Geographic comparison
- Data Table on Geographic comparison
- 9.3 APAC - Market size and forecast 2023-2028
- Chart on APAC - Market size and forecast 2023-2028 ($ million)
- Data Table on APAC - Market size and forecast 2023-2028 ($ million)
- Chart on APAC - Year-over-year growth 2023-2028 (%)
- Data Table on APAC - Year-over-year growth 2023-2028 (%)
- 9.4 North America - Market size and forecast 2023-2028
- Chart on North America - Market size and forecast 2023-2028 ($ million)
- Data Table on North America - Market size and forecast 2023-2028 ($ million)
- Chart on North America - Year-over-year growth 2023-2028 (%)
- Data Table on North America - Year-over-year growth 2023-2028 (%)
- 9.5 Europe - Market size and forecast 2023-2028
- Chart on Europe - Market size and forecast 2023-2028 ($ million)
- Data Table on Europe - Market size and forecast 2023-2028 ($ million)
- Chart on Europe - Year-over-year growth 2023-2028 (%)
- Data Table on Europe - Year-over-year growth 2023-2028 (%)
- 9.6 Middle East and Africa - Market size and forecast 2023-2028
- Chart on Middle East and Africa - Market size and forecast 2023-2028 ($ million)
- Data Table on Middle East and Africa - Market size and forecast 2023-2028 ($ million)
- Chart on Middle East and Africa - Year-over-year growth 2023-2028 (%)
- Data Table on Middle East and Africa - Year-over-year growth 2023-2028 (%)
- 9.7 South America - Market size and forecast 2023-2028
- Chart on South America - Market size and forecast 2023-2028 ($ million)
- Data Table on South America - Market size and forecast 2023-2028 ($ million)
- Chart on South America - Year-over-year growth 2023-2028 (%)
- Data Table on South America - Year-over-year growth 2023-2028 (%)
- 9.8 US - Market size and forecast 2023-2028
- Chart on US - Market size and forecast 2023-2028 ($ million)
- Data Table on US - Market size and forecast 2023-2028 ($ million)
- Chart on US - Year-over-year growth 2023-2028 (%)
- Data Table on US - Year-over-year growth 2023-2028 (%)
- 9.9 China - Market size and forecast 2023-2028
- Chart on China - Market size and forecast 2023-2028 ($ million)
- Data Table on China - Market size and forecast 2023-2028 ($ million)
- Chart on China - Year-over-year growth 2023-2028 (%)
- Data Table on China - Year-over-year growth 2023-2028 (%)
- 9.10 India - Market size and forecast 2023-2028
- Chart on India - Market size and forecast 2023-2028 ($ million)
- Data Table on India - Market size and forecast 2023-2028 ($ million)
- Chart on India - Year-over-year growth 2023-2028 (%)
- Data Table on India - Year-over-year growth 2023-2028 (%)
- 9.11 Germany - Market size and forecast 2023-2028
- Chart on Germany - Market size and forecast 2023-2028 ($ million)
- Data Table on Germany - Market size and forecast 2023-2028 ($ million)
- Chart on Germany - Year-over-year growth 2023-2028 (%)
- Data Table on Germany - Year-over-year growth 2023-2028 (%)
- 9.12 Japan - Market size and forecast 2023-2028
- Chart on Japan - Market size and forecast 2023-2028 ($ million)
- Data Table on Japan - Market size and forecast 2023-2028 ($ million)
- Chart on Japan - Year-over-year growth 2023-2028 (%)
- Data Table on Japan - Year-over-year growth 2023-2028 (%)
- 9.13 Market opportunity By Geographical Landscape
- Market opportunity By Geographical Landscape ($ million)
- Data Tables on Market opportunity By Geographical Landscape ($ million)
10 Drivers, Challenges, and Opportunity/Restraints
- 10.1 Market drivers
- 10.2 Market challenges
- 10.3 Impact of drivers and challenges
- Impact of drivers and challenges in 2023 and 2028
- 10.4 Market opportunities/restraints
11 Competitive Landscape
- 11.1 Overview
- 11.2 Competitive Landscape
- Overview on criticality of inputs and factors of differentiation
- 11.3 Landscape disruption
- Overview on factors of disruption
- 11.4 Industry risks
- Impact of key risks on business
12 Competitive Analysis
- 12.1 Companies profiled
- Companies covered
- 12.2 Market positioning of companies
- Matrix on companies position and classification
- 12.3 ADOPEN Plastik Sanayi AS
- ADOPEN Plastik Sanayi AS - Overview
- ADOPEN Plastik Sanayi AS - Product / Service
- ADOPEN Plastik Sanayi AS - Key offerings
- 12.4 Aluplast GmbH
- Aluplast GmbH - Overview
- Aluplast GmbH - Product / Service
- Aluplast GmbH - Key offerings
- 12.5 Aparna Enterprises Ltd.
- Aparna Enterprises Ltd. - Overview
- Aparna Enterprises Ltd. - Product / Service
- Aparna Enterprises Ltd. - Key offerings
- 12.6 China Lesso Group Holdings Ltd.
- China Lesso Group Holdings Ltd. - Overview
- China Lesso Group Holdings Ltd. - Business segments
- China Lesso Group Holdings Ltd. - Key offerings
- China Lesso Group Holdings Ltd. - Segment focus
- 12.7 Deceuninck Group
- Deceuninck Group - Overview
- Deceuninck Group - Business segments
- Deceuninck Group - Key offerings
- Deceuninck Group - Segment focus
- 12.8 Duroplast Extrusions Pvt. Ltd.
- Duroplast Extrusions Pvt. Ltd. - Overview
- Duroplast Extrusions Pvt. Ltd. - Product / Service
- Duroplast Extrusions Pvt. Ltd. - Key offerings
- 12.9 Encraft India Pvt. Ltd.
- Encraft India Pvt. Ltd. - Overview
- Encraft India Pvt. Ltd. - Product / Service
- Encraft India Pvt. Ltd. - Key offerings
- 12.10 Everest 2020 Ltd.
- Everest 2020 Ltd. - Overview
- Everest 2020 Ltd. - Product / Service
- Everest 2020 Ltd. - Key offerings
- 12.11 Fenesta
- Fenesta - Overview
- Fenesta - Product / Service
- Fenesta - Key offerings
- 12.12 Internorm International GmbH
- Internorm International GmbH - Overview
- Internorm International GmbH - Product / Service
- Internorm International GmbH - Key offerings
- 12.13 Karl Lingel Fensterbau Gmbh and Co. KG
- Karl Lingel Fensterbau Gmbh and Co. KG - Overview
- Karl Lingel Fensterbau Gmbh and Co. KG - Product / Service
- Karl Lingel Fensterbau Gmbh and Co. KG - Key offerings
- 12.14 Munster Joinery
- Munster Joinery - Overview
- Munster Joinery - Product / Service
- Munster Joinery - Key offerings
- 12.15 profine GmbH
- profine GmbH - Overview
- profine GmbH - Product / Service
- profine GmbH - Key offerings
- 12.16 REHAU Ltd.
- REHAU Ltd. - Overview
- REHAU Ltd. - Product / Service
- REHAU Ltd. - Key offerings
- 12.17 VEKA AG
- VEKA AG - Overview
- VEKA AG - Product / Service
- VEKA AG - Key news
- VEKA AG - Key offerings
13 Appendix
- 13.1 Scope of the report
- 13.2 Inclusions and exclusions checklist
- Inclusions checklist
- Exclusions checklist
- 13.3 Currency conversion rates for US$
- Currency conversion rates for US$
- 13.4 Research methodology
- Research methodology
- 13.5 Data procurement
- Information sources
- 13.6 Data validation
- Data validation
- 13.7 Validation techniques employed for market sizing
- Validation techniques employed for market sizing
- 13.8 Data synthesis
- Data synthesis
- 13.9 360 degree market analysis
- 360 degree market analysis
- 13.10 List of abbreviations
- List of abbreviations
