|
|
市場調査レポート
商品コード
1491509
エアハンドリングユニットの世界市場 2024-2028Global air handling unit market 2024-2028 |
||||||

|
|||||||
カスタマイズ可能
|
|||||||

| エアハンドリングユニットの世界市場 2024-2028 |
|
出版日: 2024年05月20日
発行: TechNavio
ページ情報: 英文 174 Pages
納期: 即納可能
|

全表示
- 概要
- 図表
- 目次
エアハンドリングユニット市場は2023-2028年に46億9,900万米ドル、予測期間中のCAGRは8.22%で成長すると予測されます。
当レポートでは、エアハンドリングユニット市場の全体的な分析、市場規模・予測、動向、成長促進要因、課題、約25のベンダーを網羅したベンダー分析などを掲載しています。
現在の市場シナリオ、最新動向と促進要因、市場環境全体に関する最新分析を提供しています。市場は、建設部門の成長、データセンターの増加、先進国における買い替えや改修需要の高まりによって牽引されています。
| 市場範囲 | |
|---|---|
| 基準年 | 2024 |
| 終了年 | 2028 |
| 予測期間 | 2024-2028 |
| 成長モメンタム | 加速 |
| 前年比2024年 | 7.43% |
| CAGR | 8.22% |
| 増分額 | 46億9,900万米ドル |
本調査では、今後数年間のエアハンドリングユニット市場成長を牽引する主要因の1つとして、ビルディングオートメーションシステム(BAS)の導入増加を挙げています。また、グリーン技術、グリーンビルディング、高度な監視システム、インテリジェント技術への重点の高まりは、市場の大きな需要につながります。
目次
第1章 エグゼクティブサマリー
- 市場概要
第2章 市場情勢
- 市場エコシステム
- 市場の特徴
- バリューチェーン分析
第3章 市場規模の評価
- 市場の定義
- 市場セグメント分析
- 市場規模 2023
- 市場の見通し 2023-2028
第4章 市場規模実績
- 世界エアハンドリングユニット市場 2018-2022
- エンドユーザーセグメント分析 2018-2022
- 容量セグメント分析 2018-2022
- 地域別セグメント分析 2018-2022
- 国別セグメント分析 2018-2022
第5章 ファイブフォース分析
- ファイブフォースの要約
- 買い手の交渉力
- 供給企業の交渉力
- 新規参入業者の脅威
- 代替品の脅威
- 競争の脅威
- 市況
第6章 市場セグメンテーション:エンドユーザー別
- 市場セグメンテーション
- 比較:エンドユーザー別
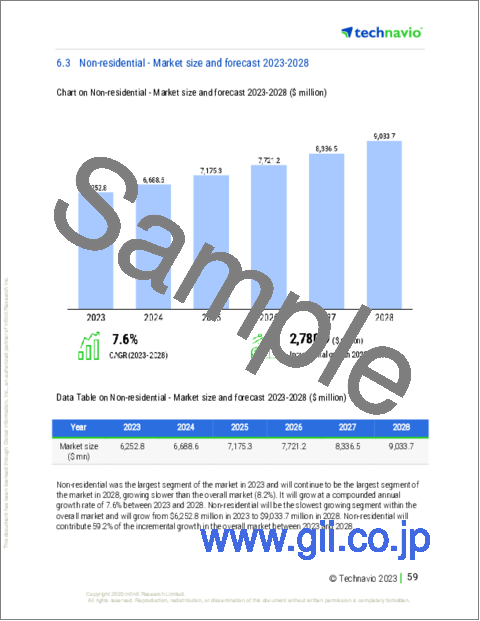
- 非居住:市場規模と予測 2023-2028
- 住宅用:市場規模と予測 2023-2028
- 市場機会:エンドユーザー別
第7章 市場セグメンテーション:容量別
- 市場セグメンテーション
- 比較:容量別
- 1時間あたり最大5000m3:市場規模と予測 2023-2028
- 1時間あたり15000m3以上:市場規模と予測 2023-2028
- 市場機会:容量別
第8章 顧客情勢
- 顧客情勢の概要
第9章 地域別情勢
- 地域別セグメンテーション
- 地域別比較
- アジア太平洋:市場規模と予測 2023-2028
- 欧州:市場規模と予測 2023-2028
- 北米:市場規模と予測 2023-2028
- 中東・アフリカ:市場規模と予測 2023-2028
- 南米:市場規模と予測 2023-2028
- 中国:市場規模と予測 2023-2028
- 米国:市場規模と予測 2023-2028
- 日本:市場規模と予測 2023-2028
- ドイツ:市場規模と予測 2023-2028
- 英国:市場規模と予測 2023-2028
- 市場機会:地域情勢別
第10章 促進要因・課題・機会・抑制要因
- 市場促進要因
- 市場の課題
- 促進要因と課題の影響
- 市場の機会・抑制要因
第11章 競合情勢
- 概要
- 競合情勢
- 混乱の状況
- 業界のリスク
第12章 競合分析
- 企業プロファイル
- 企業の市場ポジショニング
- American Air Filter Co. Inc.
- Arbonia AG
- Ariston Holding NV
- Breezeair Technology
- Carrier Global Corp.
- Cooke Industries
- Daikin Industries Ltd.
- Desiccant Technologies Group
- FlaktGroup Holding GmbH
- Johnson Controls International Plc.
- Lennox International Inc.
- MIDEA Group Co. Ltd.
- Systemair AB
- Trane Technologies plc
- VTS Polska Sp. z o. o.
第13章 付録
Exhibits:
- Exhibits1: Executive Summary - Chart on Market Overview
- Exhibits2: Executive Summary - Data Table on Market Overview
- Exhibits3: Executive Summary - Chart on Global Market Characteristics
- Exhibits4: Executive Summary - Chart on Market By Geographical Landscape
- Exhibits5: Executive Summary - Chart on Market Segmentation by End-user
- Exhibits6: Executive Summary - Chart on Market Segmentation by Capacity
- Exhibits7: Executive Summary - Chart on Incremental Growth
- Exhibits8: Executive Summary - Data Table on Incremental Growth
- Exhibits9: Executive Summary - Chart on Company Market Positioning
- Exhibits10: Parent Market
- Exhibits11: Data Table on - Parent Market
- Exhibits12: Market characteristics analysis
- Exhibits13: Value Chain Analysis
- Exhibits14: Offerings of companies included in the market definition
- Exhibits15: Market segments
- Exhibits16: Chart on Global - Market size and forecast 2023-2028 ($ million)
- Exhibits17: Data Table on Global - Market size and forecast 2023-2028 ($ million)
- Exhibits18: Chart on Global Market: Year-over-year growth 2023-2028 (%)
- Exhibits19: Data Table on Global Market: Year-over-year growth 2023-2028 (%)
- Exhibits20: Historic Market Size - Data Table on Global Air Handling Unit Market 2018 - 2022 ($ million)
- Exhibits21: Historic Market Size - End-user Segment 2018 - 2022 ($ million)
- Exhibits22: Historic Market Size - Capacity Segment 2018 - 2022 ($ million)
- Exhibits23: Historic Market Size - Geography Segment 2018 - 2022 ($ million)
- Exhibits24: Historic Market Size - Country Segment 2018 - 2022 ($ million)
- Exhibits25: Five forces analysis - Comparison between 2023 and 2028
- Exhibits26: Bargaining power of buyers - Impact of key factors 2023 and 2028
- Exhibits27: Bargaining power of suppliers - Impact of key factors in 2023 and 2028
- Exhibits28: Threat of new entrants - Impact of key factors in 2023 and 2028
- Exhibits29: Threat of substitutes - Impact of key factors in 2023 and 2028
- Exhibits30: Threat of rivalry - Impact of key factors in 2023 and 2028
- Exhibits31: Chart on Market condition - Five forces 2023 and 2028
- Exhibits32: Chart on End-user - Market share 2023-2028 (%)
- Exhibits33: Data Table on End-user - Market share 2023-2028 (%)
- Exhibits34: Chart on Comparison by End-user
- Exhibits35: Data Table on Comparison by End-user
- Exhibits36: Chart on Non-residential - Market size and forecast 2023-2028 ($ million)
- Exhibits37: Data Table on Non-residential - Market size and forecast 2023-2028 ($ million)
- Exhibits38: Chart on Non-residential - Year-over-year growth 2023-2028 (%)
- Exhibits39: Data Table on Non-residential - Year-over-year growth 2023-2028 (%)
- Exhibits40: Chart on Residential - Market size and forecast 2023-2028 ($ million)
- Exhibits41: Data Table on Residential - Market size and forecast 2023-2028 ($ million)
- Exhibits42: Chart on Residential - Year-over-year growth 2023-2028 (%)
- Exhibits43: Data Table on Residential - Year-over-year growth 2023-2028 (%)
- Exhibits44: Market opportunity by End-user ($ million)
- Exhibits45: Data Table on Market opportunity by End-user ($ million)
- Exhibits46: Chart on Capacity - Market share 2023-2028 (%)
- Exhibits47: Data Table on Capacity - Market share 2023-2028 (%)
- Exhibits48: Chart on Comparison by Capacity
- Exhibits49: Data Table on Comparison by Capacity
- Exhibits50: Chart on Up to 5000 m3 per hour - Market size and forecast 2023-2028 ($ million)
- Exhibits51: Data Table on Up to 5000 m3 per hour - Market size and forecast 2023-2028 ($ million)
- Exhibits52: Chart on Up to 5000 m3 per hour - Year-over-year growth 2023-2028 (%)
- Exhibits53: Data Table on Up to 5000 m3 per hour - Year-over-year growth 2023-2028 (%)
- Exhibits54: Chart on Above 15000 m3 per hour - Market size and forecast 2023-2028 ($ million)
- Exhibits55: Data Table on Above 15000 m3 per hour - Market size and forecast 2023-2028 ($ million)
- Exhibits56: Chart on Above 15000 m3 per hour - Year-over-year growth 2023-2028 (%)
- Exhibits57: Data Table on Above 15000 m3 per hour - Year-over-year growth 2023-2028 (%)
- Exhibits58: Chart on 5000 to 15000 m3 per hour - Market size and forecast 2023-2028 ($ million)
- Exhibits59: Data Table on 5000 to 15000 m3 per hour - Market size and forecast 2023-2028 ($ million)
- Exhibits60: Chart on 5000 to 15000 m3 per hour - Year-over-year growth 2023-2028 (%)
- Exhibits61: Data Table on 5000 to 15000 m3 per hour - Year-over-year growth 2023-2028 (%)
- Exhibits62: Market opportunity by Capacity ($ million)
- Exhibits63: Data Table on Market opportunity by Capacity ($ million)
- Exhibits64: Analysis of price sensitivity, lifecycle, customer purchase basket, adoption rates, and purchase criteria
- Exhibits65: Chart on Market share By Geographical Landscape 2023-2028 (%)
- Exhibits66: Data Table on Market share By Geographical Landscape 2023-2028 (%)
- Exhibits67: Chart on Geographic comparison
- Exhibits68: Data Table on Geographic comparison
- Exhibits69: Chart on APAC - Market size and forecast 2023-2028 ($ million)
- Exhibits70: Data Table on APAC - Market size and forecast 2023-2028 ($ million)
- Exhibits71: Chart on APAC - Year-over-year growth 2023-2028 (%)
- Exhibits72: Data Table on APAC - Year-over-year growth 2023-2028 (%)
- Exhibits73: Chart on Europe - Market size and forecast 2023-2028 ($ million)
- Exhibits74: Data Table on Europe - Market size and forecast 2023-2028 ($ million)
- Exhibits75: Chart on Europe - Year-over-year growth 2023-2028 (%)
- Exhibits76: Data Table on Europe - Year-over-year growth 2023-2028 (%)
- Exhibits77: Chart on North America - Market size and forecast 2023-2028 ($ million)
- Exhibits78: Data Table on North America - Market size and forecast 2023-2028 ($ million)
- Exhibits79: Chart on North America - Year-over-year growth 2023-2028 (%)
- Exhibits80: Data Table on North America - Year-over-year growth 2023-2028 (%)
- Exhibits81: Chart on Middle East and Africa - Market size and forecast 2023-2028 ($ million)
- Exhibits82: Data Table on Middle East and Africa - Market size and forecast 2023-2028 ($ million)
- Exhibits83: Chart on Middle East and Africa - Year-over-year growth 2023-2028 (%)
- Exhibits84: Data Table on Middle East and Africa - Year-over-year growth 2023-2028 (%)
- Exhibits85: Chart on South America - Market size and forecast 2023-2028 ($ million)
- Exhibits86: Data Table on South America - Market size and forecast 2023-2028 ($ million)
- Exhibits87: Chart on South America - Year-over-year growth 2023-2028 (%)
- Exhibits88: Data Table on South America - Year-over-year growth 2023-2028 (%)
- Exhibits89: Chart on China - Market size and forecast 2023-2028 ($ million)
- Exhibits90: Data Table on China - Market size and forecast 2023-2028 ($ million)
- Exhibits91: Chart on China - Year-over-year growth 2023-2028 (%)
- Exhibits92: Data Table on China - Year-over-year growth 2023-2028 (%)
- Exhibits93: Chart on US - Market size and forecast 2023-2028 ($ million)
- Exhibits94: Data Table on US - Market size and forecast 2023-2028 ($ million)
- Exhibits95: Chart on US - Year-over-year growth 2023-2028 (%)
- Exhibits96: Data Table on US - Year-over-year growth 2023-2028 (%)
- Exhibits97: Chart on Japan - Market size and forecast 2023-2028 ($ million)
- Exhibits98: Data Table on Japan - Market size and forecast 2023-2028 ($ million)
- Exhibits99: Chart on Japan - Year-over-year growth 2023-2028 (%)
- Exhibits100: Data Table on Japan - Year-over-year growth 2023-2028 (%)
- Exhibits101: Chart on Germany - Market size and forecast 2023-2028 ($ million)
- Exhibits102: Data Table on Germany - Market size and forecast 2023-2028 ($ million)
- Exhibits103: Chart on Germany - Year-over-year growth 2023-2028 (%)
- Exhibits104: Data Table on Germany - Year-over-year growth 2023-2028 (%)
- Exhibits105: Chart on UK - Market size and forecast 2023-2028 ($ million)
- Exhibits106: Data Table on UK - Market size and forecast 2023-2028 ($ million)
- Exhibits107: Chart on UK - Year-over-year growth 2023-2028 (%)
- Exhibits108: Data Table on UK - Year-over-year growth 2023-2028 (%)
- Exhibits109: Market opportunity By Geographical Landscape ($ million)
- Exhibits110: Data Tables on Market opportunity By Geographical Landscape ($ million)
- Exhibits111: Impact of drivers and challenges in 2023 and 2028
- Exhibits112: Overview on criticality of inputs and factors of differentiation
- Exhibits113: Overview on factors of disruption
- Exhibits114: Impact of key risks on business
- Exhibits115: Companies covered
- Exhibits116: Matrix on companies position and classification
- Exhibits117: American Air Filter Co. Inc. - Overview
- Exhibits118: American Air Filter Co. Inc. - Product / Service
- Exhibits119: American Air Filter Co. Inc. - Key offerings
- Exhibits120: Arbonia AG - Overview
- Exhibits121: Arbonia AG - Business segments
- Exhibits122: Arbonia AG - Key offerings
- Exhibits123: Arbonia AG - Segment focus
- Exhibits124: Ariston Holding NV - Overview
- Exhibits125: Ariston Holding NV - Product / Service
- Exhibits126: Ariston Holding NV - Key offerings
- Exhibits127: Breezeair Technology - Overview
- Exhibits128: Breezeair Technology - Product / Service
- Exhibits129: Breezeair Technology - Key offerings
- Exhibits130: Carrier Global Corp. - Overview
- Exhibits131: Carrier Global Corp. - Business segments
- Exhibits132: Carrier Global Corp. - Key news
- Exhibits133: Carrier Global Corp. - Key offerings
- Exhibits134: Carrier Global Corp. - Segment focus
- Exhibits135: Cooke Industries - Overview
- Exhibits136: Cooke Industries - Product / Service
- Exhibits137: Cooke Industries - Key offerings
- Exhibits138: Daikin Industries Ltd. - Overview
- Exhibits139: Daikin Industries Ltd. - Business segments
- Exhibits140: Daikin Industries Ltd. - Key news
- Exhibits141: Daikin Industries Ltd. - Key offerings
- Exhibits142: Daikin Industries Ltd. - Segment focus
- Exhibits143: Desiccant Technologies Group - Overview
- Exhibits144: Desiccant Technologies Group - Product / Service
- Exhibits145: Desiccant Technologies Group - Key offerings
- Exhibits146: FlaktGroup Holding GmbH - Overview
- Exhibits147: FlaktGroup Holding GmbH - Product / Service
- Exhibits148: FlaktGroup Holding GmbH - Key offerings
- Exhibits149: Johnson Controls International Plc. - Overview
- Exhibits150: Johnson Controls International Plc. - Business segments
- Exhibits151: Johnson Controls International Plc. - Key news
- Exhibits152: Johnson Controls International Plc. - Key offerings
- Exhibits153: Johnson Controls International Plc. - Segment focus
- Exhibits154: Lennox International Inc. - Overview
- Exhibits155: Lennox International Inc. - Business segments
- Exhibits156: Lennox International Inc. - Key news
- Exhibits157: Lennox International Inc. - Key offerings
- Exhibits158: Lennox International Inc. - Segment focus
- Exhibits159: MIDEA Group Co. Ltd. - Overview
- Exhibits160: MIDEA Group Co. Ltd. - Product / Service
- Exhibits161: MIDEA Group Co. Ltd. - Key offerings
- Exhibits162: Systemair AB - Overview
- Exhibits163: Systemair AB - Business segments
- Exhibits164: Systemair AB - Key offerings
- Exhibits165: Systemair AB - Segment focus
- Exhibits166: Trane Technologies plc - Overview
- Exhibits167: Trane Technologies plc - Business segments
- Exhibits168: Trane Technologies plc - Key offerings
- Exhibits169: Trane Technologies plc - Segment focus
- Exhibits170: VTS Polska Sp. z o. o. - Overview
- Exhibits171: VTS Polska Sp. z o. o. - Product / Service
- Exhibits172: VTS Polska Sp. z o. o. - Key offerings
- Exhibits173: Inclusions checklist
- Exhibits174: Exclusions checklist
- Exhibits175: Currency conversion rates for US$
- Exhibits176: Research methodology
- Exhibits177: Information sources
- Exhibits178: Data validation
- Exhibits179: Validation techniques employed for market sizing
- Exhibits180: Data synthesis
- Exhibits181: 360 degree market analysis
- Exhibits182: List of abbreviations
The air handling unit market is forecasted to grow by USD 4699 mn during 2023-2028, accelerating at a CAGR of 8.22% during the forecast period. The report on the air handling unit market provides a holistic analysis, market size and forecast, trends, growth drivers, and challenges, as well as vendor analysis covering around 25 vendors.
The report offers an up-to-date analysis regarding the current market scenario, the latest trends and drivers, and the overall market environment. The market is driven by the growing construction sector, increasing data centers, and growing replacement and refurbishment demand in developed countries.
Technavio's air handling unit market is segmented as below:
| Market Scope | |
|---|---|
| Base Year | 2024 |
| End Year | 2028 |
| Series Year | 2024-2028 |
| Growth Momentum | Accelerate |
| YOY 2024 | 7.43% |
| CAGR | 8.22% |
| Incremental Value | $4699mn |
ByEnd-user
- Non-residential
- Residential
ByCapacity
- Up to 5000 m3 per hour
- Above 15000 m3 per hour
5000 to 15000 m3 per hour
ByGeography
- APAC
- Europe
- North America
- Middle East and Africa
- South America
This study identifies the rise in the incorporation of building automation systems (BAS) as one of the prime reasons driving the air handling unit market growth during the next few years. Also, increased emphasis on green technology, green buildings and advanced monitoring systems and intelligent technologies will lead to sizable demand in the market.
The report on the air handling unit market covers the following areas:
- Air handling unit market sizing
- Air handling unit market forecast
- Air handling unit market industry analysis
The robust vendor analysis is designed to help clients improve their market position, and in line with this, this report provides a detailed analysis of several leading air handling unit market vendors that include American Air Filter Co. Inc., Arbonia AG, Ariston Holding NV, Breezeair Technology, Carrier Global Corp., Cooke Industries, Daikin Industries Ltd., Desiccant Technologies Group, Environmental Air Systems LLC, Euroclima AG, Fischbach Luft und Ventilatorentechnik GmbH, FlaktGroup Holding GmbH, Heinen and Hopman, Johnson Controls International Plc., Lennox International Inc., MANDIKA AS, MIDEA Group Co. Ltd., Systemair AB, Trane Technologies plc, and VTS Polska Sp. z o. o. Also, the air handling unit market analysis report includes information on upcoming trends and challenges that will influence market growth. This is to help companies strategize and leverage all forthcoming growth opportunities.
The study was conducted using an objective combination of primary and secondary information including inputs from key participants in the industry. The report contains a comprehensive market and vendor landscape in addition to an analysis of the key vendors.
The publisher presents a detailed picture of the market by way of study, synthesis, and summation of data from multiple sources through an analysis of key parameters such as profit, pricing, competition, and promotions. It presents various market facets by identifying the key industry influencers. The data presented is comprehensive, reliable, and a result of extensive research - both primary and secondary. The market research reports provide a complete competitive landscape and an in-depth vendor selection methodology and analysis using qualitative and quantitative research to forecast accurate market growth.
Table of Contents
1 Executive Summary
- 1.1 Market overview
- Executive Summary - Chart on Market Overview
- Executive Summary - Data Table on Market Overview
- Executive Summary - Chart on Global Market Characteristics
- Executive Summary - Chart on Market By Geographical Landscape
- Executive Summary - Chart on Market Segmentation by End-user
- Executive Summary - Chart on Market Segmentation by Capacity
- Executive Summary - Chart on Incremental Growth
- Executive Summary - Data Table on Incremental Growth
- Executive Summary - Chart on Company Market Positioning
2 Market Landscape
- 2.1 Market ecosystem
- Parent Market
- Data Table on - Parent Market
- 2.2 Market characteristics
- Market characteristics analysis
- 2.3 Value chain analysis
- Value Chain Analysis
3 Market Sizing
- 3.1 Market definition
- Offerings of companies included in the market definition
- 3.2 Market segment analysis
- Market segments
- 3.3 Market size 2023
- 3.4 Market outlook: Forecast for 2023-2028
- Chart on Global - Market size and forecast 2023-2028 ($ million)
- Data Table on Global - Market size and forecast 2023-2028 ($ million)
- Chart on Global Market: Year-over-year growth 2023-2028 (%)
- Data Table on Global Market: Year-over-year growth 2023-2028 (%)
4 Historic Market Size
- 4.1 Global Air Handling Unit Market 2018 - 2022
- Historic Market Size - Data Table on Global Air Handling Unit Market 2018 - 2022 ($ million)
- 4.2 End-user segment analysis 2018 - 2022
- Historic Market Size - End-user Segment 2018 - 2022 ($ million)
- 4.3 Capacity segment analysis 2018 - 2022
- Historic Market Size - Capacity Segment 2018 - 2022 ($ million)
- 4.4 Geography segment analysis 2018 - 2022
- Historic Market Size - Geography Segment 2018 - 2022 ($ million)
- 4.5 Country segment analysis 2018 - 2022
- Historic Market Size - Country Segment 2018 - 2022 ($ million)
5 Five Forces Analysis
- 5.1 Five forces summary
- Five forces analysis - Comparison between 2023 and 2028
- 5.2 Bargaining power of buyers
- Bargaining power of buyers - Impact of key factors 2023 and 2028
- 5.3 Bargaining power of suppliers
- Bargaining power of suppliers - Impact of key factors in 2023 and 2028
- 5.4 Threat of new entrants
- Threat of new entrants - Impact of key factors in 2023 and 2028
- 5.5 Threat of substitutes
- Threat of substitutes - Impact of key factors in 2023 and 2028
- 5.6 Threat of rivalry
- Threat of rivalry - Impact of key factors in 2023 and 2028
- 5.7 Market condition
- Chart on Market condition - Five forces 2023 and 2028
6 Market Segmentation by End-user
- 6.1 Market segments
- Chart on End-user - Market share 2023-2028 (%)
- Data Table on End-user - Market share 2023-2028 (%)
- 6.2 Comparison by End-user
- Chart on Comparison by End-user
- Data Table on Comparison by End-user
- 6.3 Non-residential - Market size and forecast 2023-2028
- Chart on Non-residential - Market size and forecast 2023-2028 ($ million)
- Data Table on Non-residential - Market size and forecast 2023-2028 ($ million)
- Chart on Non-residential - Year-over-year growth 2023-2028 (%)
- Data Table on Non-residential - Year-over-year growth 2023-2028 (%)
- 6.4 Residential - Market size and forecast 2023-2028
- Chart on Residential - Market size and forecast 2023-2028 ($ million)
- Data Table on Residential - Market size and forecast 2023-2028 ($ million)
- Chart on Residential - Year-over-year growth 2023-2028 (%)
- Data Table on Residential - Year-over-year growth 2023-2028 (%)
- 6.5 Market opportunity by End-user
- Market opportunity by End-user ($ million)
- Data Table on Market opportunity by End-user ($ million)
7 Market Segmentation by Capacity
- 7.1 Market segments
- Chart on Capacity - Market share 2023-2028 (%)
- Data Table on Capacity - Market share 2023-2028 (%)
- 7.2 Comparison by Capacity
- Chart on Comparison by Capacity
- Data Table on Comparison by Capacity
- 7.3 Up to 5000 m3 per hour - Market size and forecast 2023-2028
- Chart on Up to 5000 m3 per hour - Market size and forecast 2023-2028 ($ million)
- Data Table on Up to 5000 m3 per hour - Market size and forecast 2023-2028 ($ million)
- Chart on Up to 5000 m3 per hour - Year-over-year growth 2023-2028 (%)
- Data Table on Up to 5000 m3 per hour - Year-over-year growth 2023-2028 (%)
- 7.4 Above 15000 m3 per hour - Market size and forecast 2023-2028
- Chart on Above 15000 m3 per hour - Market size and forecast 2023-2028 ($ million)
- Data Table on Above 15000 m3 per hour - Market size and forecast 2023-2028 ($ million)
- Chart on Above 15000 m3 per hour - Year-over-year growth 2023-2028 (%)
- Data Table on Above 15000 m3 per hour - Year-over-year growth 2023-2028 (%)
- 5000 to 15000 m3 per hour - Market size and forecast 2023-2028
- Chart on 5000 to 15000 m3 per hour - Market size and forecast 2023-2028 ($ million)
- Data Table on 5000 to 15000 m3 per hour - Market size and forecast 2023-2028 ($ million)
- Chart on 5000 to 15000 m3 per hour - Year-over-year growth 2023-2028 (%)
- Data Table on 5000 to 15000 m3 per hour - Year-over-year growth 2023-2028 (%)
- 7.6 Market opportunity by Capacity
- Market opportunity by Capacity ($ million)
- Data Table on Market opportunity by Capacity ($ million)
8 Customer Landscape
- 8.1 Customer landscape overview
- Analysis of price sensitivity, lifecycle, customer purchase basket, adoption rates, and purchase criteria
9 Geographic Landscape
- 9.1 Geographic segmentation
- Chart on Market share By Geographical Landscape 2023-2028 (%)
- Data Table on Market share By Geographical Landscape 2023-2028 (%)
- 9.2 Geographic comparison
- Chart on Geographic comparison
- Data Table on Geographic comparison
- 9.3 APAC - Market size and forecast 2023-2028
- Chart on APAC - Market size and forecast 2023-2028 ($ million)
- Data Table on APAC - Market size and forecast 2023-2028 ($ million)
- Chart on APAC - Year-over-year growth 2023-2028 (%)
- Data Table on APAC - Year-over-year growth 2023-2028 (%)
- 9.4 Europe - Market size and forecast 2023-2028
- Chart on Europe - Market size and forecast 2023-2028 ($ million)
- Data Table on Europe - Market size and forecast 2023-2028 ($ million)
- Chart on Europe - Year-over-year growth 2023-2028 (%)
- Data Table on Europe - Year-over-year growth 2023-2028 (%)
- 9.5 North America - Market size and forecast 2023-2028
- Chart on North America - Market size and forecast 2023-2028 ($ million)
- Data Table on North America - Market size and forecast 2023-2028 ($ million)
- Chart on North America - Year-over-year growth 2023-2028 (%)
- Data Table on North America - Year-over-year growth 2023-2028 (%)
- 9.6 Middle East and Africa - Market size and forecast 2023-2028
- Chart on Middle East and Africa - Market size and forecast 2023-2028 ($ million)
- Data Table on Middle East and Africa - Market size and forecast 2023-2028 ($ million)
- Chart on Middle East and Africa - Year-over-year growth 2023-2028 (%)
- Data Table on Middle East and Africa - Year-over-year growth 2023-2028 (%)
- 9.7 South America - Market size and forecast 2023-2028
- Chart on South America - Market size and forecast 2023-2028 ($ million)
- Data Table on South America - Market size and forecast 2023-2028 ($ million)
- Chart on South America - Year-over-year growth 2023-2028 (%)
- Data Table on South America - Year-over-year growth 2023-2028 (%)
- 9.8 China - Market size and forecast 2023-2028
- Chart on China - Market size and forecast 2023-2028 ($ million)
- Data Table on China - Market size and forecast 2023-2028 ($ million)
- Chart on China - Year-over-year growth 2023-2028 (%)
- Data Table on China - Year-over-year growth 2023-2028 (%)
- 9.9 US - Market size and forecast 2023-2028
- Chart on US - Market size and forecast 2023-2028 ($ million)
- Data Table on US - Market size and forecast 2023-2028 ($ million)
- Chart on US - Year-over-year growth 2023-2028 (%)
- Data Table on US - Year-over-year growth 2023-2028 (%)
- 9.10 Japan - Market size and forecast 2023-2028
- Chart on Japan - Market size and forecast 2023-2028 ($ million)
- Data Table on Japan - Market size and forecast 2023-2028 ($ million)
- Chart on Japan - Year-over-year growth 2023-2028 (%)
- Data Table on Japan - Year-over-year growth 2023-2028 (%)
- 9.11 Germany - Market size and forecast 2023-2028
- Chart on Germany - Market size and forecast 2023-2028 ($ million)
- Data Table on Germany - Market size and forecast 2023-2028 ($ million)
- Chart on Germany - Year-over-year growth 2023-2028 (%)
- Data Table on Germany - Year-over-year growth 2023-2028 (%)
- 9.12 UK - Market size and forecast 2023-2028
- Chart on UK - Market size and forecast 2023-2028 ($ million)
- Data Table on UK - Market size and forecast 2023-2028 ($ million)
- Chart on UK - Year-over-year growth 2023-2028 (%)
- Data Table on UK - Year-over-year growth 2023-2028 (%)
- 9.13 Market opportunity By Geographical Landscape
- Market opportunity By Geographical Landscape ($ million)
- Data Tables on Market opportunity By Geographical Landscape ($ million)
10 Drivers, Challenges, and Opportunity/Restraints
- 10.1 Market drivers
- 10.2 Market challenges
- 10.3 Impact of drivers and challenges
- Impact of drivers and challenges in 2023 and 2028
- 10.4 Market opportunities/restraints
11 Competitive Landscape
- 11.1 Overview
- 11.2 Competitive Landscape
- Overview on criticality of inputs and factors of differentiation
- 11.3 Landscape disruption
- Overview on factors of disruption
- 11.4 Industry risks
- Impact of key risks on business
12 Competitive Analysis
- 12.1 Companies profiled
- Companies covered
- 12.2 Market positioning of companies
- Matrix on companies position and classification
- 12.3 American Air Filter Co. Inc.
- American Air Filter Co. Inc. - Overview
- American Air Filter Co. Inc. - Product / Service
- American Air Filter Co. Inc. - Key offerings
- 12.4 Arbonia AG
- Arbonia AG - Overview
- Arbonia AG - Business segments
- Arbonia AG - Key offerings
- Arbonia AG - Segment focus
- 12.5 Ariston Holding NV
- Ariston Holding NV - Overview
- Ariston Holding NV - Product / Service
- Ariston Holding NV - Key offerings
- 12.6 Breezeair Technology
- Breezeair Technology - Overview
- Breezeair Technology - Product / Service
- Breezeair Technology - Key offerings
- 12.7 Carrier Global Corp.
- Carrier Global Corp. - Overview
- Carrier Global Corp. - Business segments
- Carrier Global Corp. - Key news
- Carrier Global Corp. - Key offerings
- Carrier Global Corp. - Segment focus
- 12.8 Cooke Industries
- Cooke Industries - Overview
- Cooke Industries - Product / Service
- Cooke Industries - Key offerings
- 12.9 Daikin Industries Ltd.
- Daikin Industries Ltd. - Overview
- Daikin Industries Ltd. - Business segments
- Daikin Industries Ltd. - Key news
- Daikin Industries Ltd. - Key offerings
- Daikin Industries Ltd. - Segment focus
- 12.10 Desiccant Technologies Group
- Desiccant Technologies Group - Overview
- Desiccant Technologies Group - Product / Service
- Desiccant Technologies Group - Key offerings
- 12.11 FlaktGroup Holding GmbH
- FlaktGroup Holding GmbH - Overview
- FlaktGroup Holding GmbH - Product / Service
- FlaktGroup Holding GmbH - Key offerings
- 12.12 Johnson Controls International Plc.
- Johnson Controls International Plc. - Overview
- Johnson Controls International Plc. - Business segments
- Johnson Controls International Plc. - Key news
- Johnson Controls International Plc. - Key offerings
- Johnson Controls International Plc. - Segment focus
- 12.13 Lennox International Inc.
- Lennox International Inc. - Overview
- Lennox International Inc. - Business segments
- Lennox International Inc. - Key news
- Lennox International Inc. - Key offerings
- Lennox International Inc. - Segment focus
- 12.14 MIDEA Group Co. Ltd.
- MIDEA Group Co. Ltd. - Overview
- MIDEA Group Co. Ltd. - Product / Service
- MIDEA Group Co. Ltd. - Key offerings
- 12.15 Systemair AB
- Systemair AB - Overview
- Systemair AB - Business segments
- Systemair AB - Key offerings
- Systemair AB - Segment focus
- 12.16 Trane Technologies plc
- Trane Technologies plc - Overview
- Trane Technologies plc - Business segments
- Trane Technologies plc - Key offerings
- Trane Technologies plc - Segment focus
- 12.17 VTS Polska Sp. z o. o.
- VTS Polska Sp. z o. o. - Overview
- VTS Polska Sp. z o. o. - Product / Service
- VTS Polska Sp. z o. o. - Key offerings
13 Appendix
- 13.1 Scope of the report
- 13.2 Inclusions and exclusions checklist
- Inclusions checklist
- Exclusions checklist
- 13.3 Currency conversion rates for US$
- Currency conversion rates for US$
- 13.4 Research methodology
- Research methodology
- 13.5 Data procurement
- Information sources
- 13.6 Data validation
- Data validation
- 13.7 Validation techniques employed for market sizing
- Validation techniques employed for market sizing
- 13.8 Data synthesis
- Data synthesis
- 13.9 360 degree market analysis
- 360 degree market analysis
- 13.10 List of abbreviations
- List of abbreviations
