|
|
市場調査レポート
商品コード
1490726
同軸ケーブルの世界市場(2024年~2028年)Global coaxial cables market 2024-2028 |
||||||

|
|||||||
カスタマイズ可能
|
|||||||


| 同軸ケーブルの世界市場(2024年~2028年) |
|
出版日: 2024年05月17日
発行: TechNavio
ページ情報: 英文 178 Pages
納期: 即納可能
|

全表示
- 概要
- 図表
- 目次
世界の同軸ケーブルの市場規模は、2023年~2028年に29億7,570万米ドル、予測期間中のCAGRは4.68%で成長すると予測されます。 当レポートでは、同軸ケーブル市場の全体的な分析、市場規模・予測、動向、成長促進要因、課題、約25のベンダーを網羅したベンダー分析などを掲載しています。
現在の市場シナリオ、最新動向と促進要因、市場環境全体に関する最新分析を提供しています。市場は、ブロードバンドインターネットアクセス用ケーブルの採用、新興国市場におけるテレビネットワークのデジタル化、DOCSIS通信規格の開発によって牽引されています。
| 市場範囲 | |
|---|---|
| 基準年 | 2024年 |
| 終了年 | 2028年 |
| 予測期間 | 2024年~2028年 |
| 成長推進力 | 加速 |
| 前年比2024年 | 4.39% |
| CAGR | 4.68% |
| 増分額 | 29億7,570万米ドル |
本調査では、今後数年間の同軸ケーブル市場成長を牽引する主要因の1つとして、航空宇宙分野への投資拡大を挙げています。また、ケーブルTVインフラストラクチャのインフラストラクチャ拡大、建設の成長、規制も市場の大きな需要につながります。
目次
第1章 エグゼクティブサマリー
- 市場概要
第2章 市場情勢
- 市場エコシステム
- 市場の特徴
- バリューチェーン分析
第3章 市場規模の評価
- 市場の定義
- 市場セグメント分析
- 市場規模(2023年)
- 市場の見通し(2023年~2028年)
第4章 市場規模実績
- 世界同軸ケーブル市場(2018年~2022年)
- エンドユーザーセグメント分析(2018年~2022年)
- 用途セグメント分析(2018年~2022年)
- 地域セグメント分析(2018年~2022年)
- 国セグメント分析(2018年~2022年)
第5章 ファイブフォース分析
- ファイブフォースの要約
- 買い手の交渉力
- 供給企業の交渉力
- 新規参入業者の脅威
- 代替品の脅威
- 競争の脅威
- 市況
第6章 市場セグメンテーション:エンドユーザー別
- 市場セグメンテーション
- 比較:エンドユーザー別
- 通信:市場規模と予測(2023年~2028年)
- 輸送と軍事:市場規模と予測(2023年~2028年)
- CATVプロバイダー:市場規模と予測(2023年~2028年)
- その他:市場規模と予測(2023年~2028年)
- 市場機会:エンドユーザー別
第7章 市場セグメンテーション:用途別
- 市場セグメンテーション
- 比較:用途別
- 動画配信:市場規模と予測(2023年~2028年)
- インターネットデータ転送:市場規模と予測(2023年~2028年)
- 無線周波数転送:市場規模と予測(2023年~2028年)
- 市場機会:用途別
第8章 顧客情勢
- 顧客情勢の概要
第9章 地域情勢
- 地域セグメンテーション
- 地域別比較
- アジア太平洋:市場規模と予測(2023年~2028年)
- 欧州:市場規模と予測(2023年~2028年)
- 北米:市場規模と予測(2023年~2028年)
- 中東・アフリカ:市場規模と予測(2023年~2028年)
- 南米:市場規模と予測(2023年~2028年)
- 中国:市場規模と予測(2023年~2028年)
- 米国:市場規模と予測(2023年~2028年)
- 日本:市場規模と予測(2023年~2028年)
- ドイツ:市場規模と予測(2023年~2028年)
- 韓国:市場規模と予測(2023年~2028年)
- 市場機会:地域情勢別
第10章 促進要因・課題・機会・抑制要因
- 市場促進要因
- 市場の課題
- 促進要因と課題の影響
- 市場の機会・抑制要因
第11章 競合情勢
- 概要
- 競合情勢
- 混乱の状況
- 業界のリスク
第12章 競合分析
- 企業プロファイル
- 企業の市場ポジショニング
- Amphenol Corp.
- Belden Inc.
- Coleman Wires and Cables
- CommScope Holding Co. Inc.
- Habia Cable AB
- Hengxin Technology Ltd.
- HUBER SUHNER AG
- Infinite Electronics Inc.
- Infinite Electronics International Inc.
- Leoni AG
- LS Cable and System Ltd.
- Prysmian Spa
- Sumitomo Electric Industries Ltd.
- Trigiant Group Ltd.
- Zhuhai Hansen Technology Co. Ltd.
第13章 付録
Exhibits:
- Exhibits1: Executive Summary - Chart on Market Overview
- Exhibits2: Executive Summary - Data Table on Market Overview
- Exhibits3: Executive Summary - Chart on Global Market Characteristics
- Exhibits4: Executive Summary - Chart on Market By Geographical Landscape
- Exhibits5: Executive Summary - Chart on Market Segmentation by End-user
- Exhibits6: Executive Summary - Chart on Market Segmentation by Application
- Exhibits7: Executive Summary - Chart on Incremental Growth
- Exhibits8: Executive Summary - Data Table on Incremental Growth
- Exhibits9: Executive Summary - Chart on Company Market Positioning
- Exhibits10: Parent Market
- Exhibits11: Data Table on - Parent Market
- Exhibits12: Market characteristics analysis
- Exhibits13: Value Chain Analysis
- Exhibits14: Offerings of companies included in the market definition
- Exhibits15: Market segments
- Exhibits16: Chart on Global - Market size and forecast 2023-2028 ($ million)
- Exhibits17: Data Table on Global - Market size and forecast 2023-2028 ($ million)
- Exhibits18: Chart on Global Market: Year-over-year growth 2023-2028 (%)
- Exhibits19: Data Table on Global Market: Year-over-year growth 2023-2028 (%)
- Exhibits20: Historic Market Size - Data Table on Global Coaxial Cables Market 2018 - 2022 ($ million)
- Exhibits21: Historic Market Size - End-user Segment 2018 - 2022 ($ million)
- Exhibits22: Historic Market Size - Application Segment 2018 - 2022 ($ million)
- Exhibits23: Historic Market Size - Geography Segment 2018 - 2022 ($ million)
- Exhibits24: Historic Market Size - Country Segment 2018 - 2022 ($ million)
- Exhibits25: Five forces analysis - Comparison between 2023 and 2028
- Exhibits26: Bargaining power of buyers - Impact of key factors 2023 and 2028
- Exhibits27: Bargaining power of suppliers - Impact of key factors in 2023 and 2028
- Exhibits28: Threat of new entrants - Impact of key factors in 2023 and 2028
- Exhibits29: Threat of substitutes - Impact of key factors in 2023 and 2028
- Exhibits30: Threat of rivalry - Impact of key factors in 2023 and 2028
- Exhibits31: Chart on Market condition - Five forces 2023 and 2028
- Exhibits32: Chart on End-user - Market share 2023-2028 (%)
- Exhibits33: Data Table on End-user - Market share 2023-2028 (%)
- Exhibits34: Chart on Comparison by End-user
- Exhibits35: Data Table on Comparison by End-user
- Exhibits36: Chart on Telecommunication - Market size and forecast 2023-2028 ($ million)
- Exhibits37: Data Table on Telecommunication - Market size and forecast 2023-2028 ($ million)
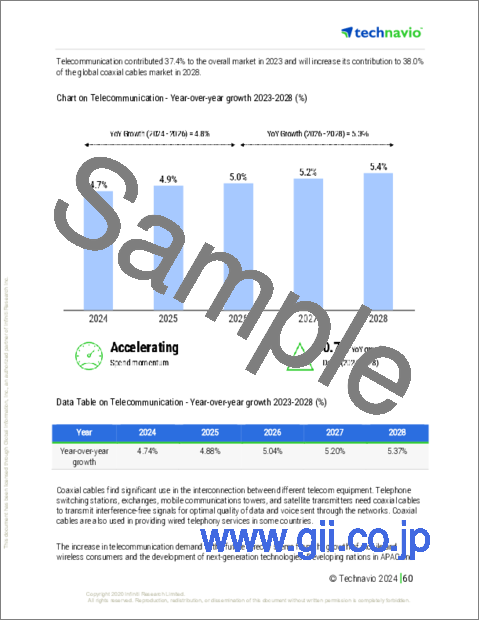
- Exhibits38: Chart on Telecommunication - Year-over-year growth 2023-2028 (%)
- Exhibits39: Data Table on Telecommunication - Year-over-year growth 2023-2028 (%)
- Exhibits40: Chart on Transportation and military - Market size and forecast 2023-2028 ($ million)
- Exhibits41: Data Table on Transportation and military - Market size and forecast 2023-2028 ($ million)
- Exhibits42: Chart on Transportation and military - Year-over-year growth 2023-2028 (%)
- Exhibits43: Data Table on Transportation and military - Year-over-year growth 2023-2028 (%)
- Exhibits44: Chart on CATV providers - Market size and forecast 2023-2028 ($ million)
- Exhibits45: Data Table on CATV providers - Market size and forecast 2023-2028 ($ million)
- Exhibits46: Chart on CATV providers - Year-over-year growth 2023-2028 (%)
- Exhibits47: Data Table on CATV providers - Year-over-year growth 2023-2028 (%)
- Exhibits48: Chart on Others - Market size and forecast 2023-2028 ($ million)
- Exhibits49: Data Table on Others - Market size and forecast 2023-2028 ($ million)
- Exhibits50: Chart on Others - Year-over-year growth 2023-2028 (%)
- Exhibits51: Data Table on Others - Year-over-year growth 2023-2028 (%)
- Exhibits52: Market opportunity by End-user ($ million)
- Exhibits53: Data Table on Market opportunity by End-user ($ million)
- Exhibits54: Chart on Application - Market share 2023-2028 (%)
- Exhibits55: Data Table on Application - Market share 2023-2028 (%)
- Exhibits56: Chart on Comparison by Application
- Exhibits57: Data Table on Comparison by Application
- Exhibits58: Chart on Video distribution - Market size and forecast 2023-2028 ($ million)
- Exhibits59: Data Table on Video distribution - Market size and forecast 2023-2028 ($ million)
- Exhibits60: Chart on Video distribution - Year-over-year growth 2023-2028 (%)
- Exhibits61: Data Table on Video distribution - Year-over-year growth 2023-2028 (%)
- Exhibits62: Chart on Internet data transfer - Market size and forecast 2023-2028 ($ million)
- Exhibits63: Data Table on Internet data transfer - Market size and forecast 2023-2028 ($ million)
- Exhibits64: Chart on Internet data transfer - Year-over-year growth 2023-2028 (%)
- Exhibits65: Data Table on Internet data transfer - Year-over-year growth 2023-2028 (%)
- Exhibits66: Chart on Radio frequency transfer - Market size and forecast 2023-2028 ($ million)
- Exhibits67: Data Table on Radio frequency transfer - Market size and forecast 2023-2028 ($ million)
- Exhibits68: Chart on Radio frequency transfer - Year-over-year growth 2023-2028 (%)
- Exhibits69: Data Table on Radio frequency transfer - Year-over-year growth 2023-2028 (%)
- Exhibits70: Market opportunity by Application ($ million)
- Exhibits71: Data Table on Market opportunity by Application ($ million)
- Exhibits72: Analysis of price sensitivity, lifecycle, customer purchase basket, adoption rates, and purchase criteria
- Exhibits73: Chart on Market share By Geographical Landscape 2023-2028 (%)
- Exhibits74: Data Table on Market share By Geographical Landscape 2023-2028 (%)
- Exhibits75: Chart on Geographic comparison
- Exhibits76: Data Table on Geographic comparison
- Exhibits77: Chart on APAC - Market size and forecast 2023-2028 ($ million)
- Exhibits78: Data Table on APAC - Market size and forecast 2023-2028 ($ million)
- Exhibits79: Chart on APAC - Year-over-year growth 2023-2028 (%)
- Exhibits80: Data Table on APAC - Year-over-year growth 2023-2028 (%)
- Exhibits81: Chart on Europe - Market size and forecast 2023-2028 ($ million)
- Exhibits82: Data Table on Europe - Market size and forecast 2023-2028 ($ million)
- Exhibits83: Chart on Europe - Year-over-year growth 2023-2028 (%)
- Exhibits84: Data Table on Europe - Year-over-year growth 2023-2028 (%)
- Exhibits85: Chart on North America - Market size and forecast 2023-2028 ($ million)
- Exhibits86: Data Table on North America - Market size and forecast 2023-2028 ($ million)
- Exhibits87: Chart on North America - Year-over-year growth 2023-2028 (%)
- Exhibits88: Data Table on North America - Year-over-year growth 2023-2028 (%)
- Exhibits89: Chart on Middle East and Africa - Market size and forecast 2023-2028 ($ million)
- Exhibits90: Data Table on Middle East and Africa - Market size and forecast 2023-2028 ($ million)
- Exhibits91: Chart on Middle East and Africa - Year-over-year growth 2023-2028 (%)
- Exhibits92: Data Table on Middle East and Africa - Year-over-year growth 2023-2028 (%)
- Exhibits93: Chart on South America - Market size and forecast 2023-2028 ($ million)
- Exhibits94: Data Table on South America - Market size and forecast 2023-2028 ($ million)
- Exhibits95: Chart on South America - Year-over-year growth 2023-2028 (%)
- Exhibits96: Data Table on South America - Year-over-year growth 2023-2028 (%)
- Exhibits97: Chart on China - Market size and forecast 2023-2028 ($ million)
- Exhibits98: Data Table on China - Market size and forecast 2023-2028 ($ million)
- Exhibits99: Chart on China - Year-over-year growth 2023-2028 (%)
- Exhibits100: Data Table on China - Year-over-year growth 2023-2028 (%)
- Exhibits101: Chart on US - Market size and forecast 2023-2028 ($ million)
- Exhibits102: Data Table on US - Market size and forecast 2023-2028 ($ million)
- Exhibits103: Chart on US - Year-over-year growth 2023-2028 (%)
- Exhibits104: Data Table on US - Year-over-year growth 2023-2028 (%)
- Exhibits105: Chart on Japan - Market size and forecast 2023-2028 ($ million)
- Exhibits106: Data Table on Japan - Market size and forecast 2023-2028 ($ million)
- Exhibits107: Chart on Japan - Year-over-year growth 2023-2028 (%)
- Exhibits108: Data Table on Japan - Year-over-year growth 2023-2028 (%)
- Exhibits109: Chart on Germany - Market size and forecast 2023-2028 ($ million)
- Exhibits110: Data Table on Germany - Market size and forecast 2023-2028 ($ million)
- Exhibits111: Chart on Germany - Year-over-year growth 2023-2028 (%)
- Exhibits112: Data Table on Germany - Year-over-year growth 2023-2028 (%)
- Exhibits113: Chart on South Korea - Market size and forecast 2023-2028 ($ million)
- Exhibits114: Data Table on South Korea - Market size and forecast 2023-2028 ($ million)
- Exhibits115: Chart on South Korea - Year-over-year growth 2023-2028 (%)
- Exhibits116: Data Table on South Korea - Year-over-year growth 2023-2028 (%)
- Exhibits117: Market opportunity By Geographical Landscape ($ million)
- Exhibits118: Data Tables on Market opportunity By Geographical Landscape ($ million)
- Exhibits119: Impact of drivers and challenges in 2023 and 2028
- Exhibits120: Overview on criticality of inputs and factors of differentiation
- Exhibits121: Overview on factors of disruption
- Exhibits122: Impact of key risks on business
- Exhibits123: Companies covered
- Exhibits124: Matrix on companies position and classification
- Exhibits125: Amphenol Corp. - Overview
- Exhibits126: Amphenol Corp. - Business segments
- Exhibits127: Amphenol Corp. - Key news
- Exhibits128: Amphenol Corp. - Key offerings
- Exhibits129: Amphenol Corp. - Segment focus
- Exhibits130: Belden Inc. - Overview
- Exhibits131: Belden Inc. - Business segments
- Exhibits132: Belden Inc. - Key news
- Exhibits133: Belden Inc. - Key offerings
- Exhibits134: Belden Inc. - Segment focus
- Exhibits135: Coleman Wires and Cables - Overview
- Exhibits136: Coleman Wires and Cables - Product / Service
- Exhibits137: Coleman Wires and Cables - Key offerings
- Exhibits138: CommScope Holding Co. Inc. - Overview
- Exhibits139: CommScope Holding Co. Inc. - Business segments
- Exhibits140: CommScope Holding Co. Inc. - Key news
- Exhibits141: CommScope Holding Co. Inc. - Key offerings
- Exhibits142: CommScope Holding Co. Inc. - Segment focus
- Exhibits143: Habia Cable AB - Overview
- Exhibits144: Habia Cable AB - Product / Service
- Exhibits145: Habia Cable AB - Key offerings
- Exhibits146: Hengxin Technology Ltd. - Overview
- Exhibits147: Hengxin Technology Ltd. - Business segments
- Exhibits148: Hengxin Technology Ltd. - Key offerings
- Exhibits149: Hengxin Technology Ltd. - Segment focus
- Exhibits150: HUBER SUHNER AG - Overview
- Exhibits151: HUBER SUHNER AG - Business segments
- Exhibits152: HUBER SUHNER AG - Key offerings
- Exhibits153: HUBER SUHNER AG - Segment focus
- Exhibits154: Infinite Electronics Inc. - Overview
- Exhibits155: Infinite Electronics Inc. - Product / Service
- Exhibits156: Infinite Electronics Inc. - Key offerings
- Exhibits157: Infinite Electronics International Inc. - Overview
- Exhibits158: Infinite Electronics International Inc. - Product / Service
- Exhibits159: Infinite Electronics International Inc. - Key offerings
- Exhibits160: Leoni AG - Overview
- Exhibits161: Leoni AG - Business segments
- Exhibits162: Leoni AG - Key offerings
- Exhibits163: Leoni AG - Segment focus
- Exhibits164: LS Cable and System Ltd. - Overview
- Exhibits165: LS Cable and System Ltd. - Product / Service
- Exhibits166: LS Cable and System Ltd. - Key offerings
- Exhibits167: Prysmian Spa - Overview
- Exhibits168: Prysmian Spa - Business segments
- Exhibits169: Prysmian Spa - Key news
- Exhibits170: Prysmian Spa - Key offerings
- Exhibits171: Prysmian Spa - Segment focus
- Exhibits172: Sumitomo Electric Industries Ltd. - Overview
- Exhibits173: Sumitomo Electric Industries Ltd. - Business segments
- Exhibits174: Sumitomo Electric Industries Ltd. - Key news
- Exhibits175: Sumitomo Electric Industries Ltd. - Key offerings
- Exhibits176: Sumitomo Electric Industries Ltd. - Segment focus
- Exhibits177: Trigiant Group Ltd. - Overview
- Exhibits178: Trigiant Group Ltd. - Product / Service
- Exhibits179: Trigiant Group Ltd. - Key offerings
- Exhibits180: Zhuhai Hansen Technology Co. Ltd. - Overview
- Exhibits181: Zhuhai Hansen Technology Co. Ltd. - Product / Service
- Exhibits182: Zhuhai Hansen Technology Co. Ltd. - Key offerings
- Exhibits183: Inclusions checklist
- Exhibits184: Exclusions checklist
- Exhibits185: Currency conversion rates for US$
- Exhibits186: Research methodology
- Exhibits187: Information sources
- Exhibits188: Data validation
- Exhibits189: Validation techniques employed for market sizing
- Exhibits190: Data synthesis
- Exhibits191: 360 degree market analysis
- Exhibits192: List of abbreviations
The coaxial cables market is forecasted to grow by USD 2975.7 million during 2023-2028, accelerating at a CAGR of 4.68% during the forecast period. The report on the coaxial cables market provides a holistic analysis, market size and forecast, trends, growth drivers, and challenges, as well as vendor analysis covering around 25 vendors.
The report offers an up-to-date analysis regarding the current market scenario, the latest trends and drivers, and the overall market environment. The market is driven by the adoption of cables for broadband internet access, the digitization of television networks in developing countries, and the development of DOCSIS telecommunication standards.
Technavio's coaxial cables market is segmented as below:
| Market Scope | |
|---|---|
| Base Year | 2024 |
| End Year | 2028 |
| Series Year | 2024-2028 |
| Growth Momentum | Accelerate |
| YOY 2024 | 4.39% |
| CAGR | 4.68% |
| Incremental Value | $2975.7mn |
By End-user
- Telecommunication
- Transportation and military
- CATV providers
- Others
By Application
- Video distribution
- Internet data transfer
- Radio frequency transfer
By Geographical Landscape
- APAC
- Europe
- North America
- Middle East and Africa
- South America
This study identifies the growing investment in the aerospace sector as one of the prime reasons driving the coaxial cables market growth during the next few years. Also, expanding infrastructure and construction growth and regulations for cable TV infrastructure will lead to sizable demand in the market.
The report on the coaxial cables market covers the following areas:
- Coaxial cables market sizing
- Coaxial cables market forecast
- Coaxial cables market industry analysis
The robust vendor analysis is designed to help clients improve their market position, and in line with this, this report provides a detailed analysis of several leading coaxial cables market vendors that include Alpha Wire Inc., Amphenol Corp., Belden Inc., Coleman Wires and Cables, CommScope Holding Co. Inc., Habia Cable AB, Hengxin Technology Ltd., HUBER SUHNER AG, Infinite Electronics Inc., Infinite Electronics International Inc., Kingsignal Technology Co. Ltd., Leoni AG, LS Cable and System Ltd., Prysmian Spa, Southwire Co. LLC, Sumitomo Electric Industries Ltd., TE Connectivity Ltd., Trigiant Group Ltd., W. L. Gore and Associates Inc., and Zhuhai Hansen Technology Co. Ltd.. Also, the coaxial cables market analysis report includes information on upcoming trends and challenges that will influence market growth. This is to help companies strategize and leverage all forthcoming growth opportunities.
The study was conducted using an objective combination of primary and secondary information including inputs from key participants in the industry. The report contains a comprehensive market and vendor landscape in addition to an analysis of the key vendors.
The publisher presents a detailed picture of the market by way of study, synthesis, and summation of data from multiple sources through an analysis of key parameters such as profit, pricing, competition, and promotions. It presents various market facets by identifying the key industry influencers. The data presented is comprehensive, reliable, and a result of extensive research - both primary and secondary. The market research reports provide a complete competitive landscape and an in-depth vendor selection methodology and analysis using qualitative and quantitative research to forecast accurate market growth.
Table of Contents
1 Executive Summary
- 1.1 Market overview
- Executive Summary - Chart on Market Overview
- Executive Summary - Data Table on Market Overview
- Executive Summary - Chart on Global Market Characteristics
- Executive Summary - Chart on Market By Geographical Landscape
- Executive Summary - Chart on Market Segmentation by End-user
- Executive Summary - Chart on Market Segmentation by Application
- Executive Summary - Chart on Incremental Growth
- Executive Summary - Data Table on Incremental Growth
- Executive Summary - Chart on Company Market Positioning
2 Market Landscape
- 2.1 Market ecosystem
- Parent Market
- Data Table on - Parent Market
- 2.2 Market characteristics
- Market characteristics analysis
- 2.3 Value chain analysis
- Value Chain Analysis
3 Market Sizing
- 3.1 Market definition
- Offerings of companies included in the market definition
- 3.2 Market segment analysis
- Market segments
- 3.3 Market size 2023
- 3.4 Market outlook: Forecast for 2023-2028
- Chart on Global - Market size and forecast 2023-2028 ($ million)
- Data Table on Global - Market size and forecast 2023-2028 ($ million)
- Chart on Global Market: Year-over-year growth 2023-2028 (%)
- Data Table on Global Market: Year-over-year growth 2023-2028 (%)
4 Historic Market Size
- 4.1 Global Coaxial Cables Market 2018 - 2022
- Historic Market Size - Data Table on Global Coaxial Cables Market 2018 - 2022 ($ million)
- 4.2 End-user segment analysis 2018 - 2022
- Historic Market Size - End-user Segment 2018 - 2022 ($ million)
- 4.3 Application segment analysis 2018 - 2022
- Historic Market Size - Application Segment 2018 - 2022 ($ million)
- 4.4 Geography segment analysis 2018 - 2022
- Historic Market Size - Geography Segment 2018 - 2022 ($ million)
- 4.5 Country segment analysis 2018 - 2022
- Historic Market Size - Country Segment 2018 - 2022 ($ million)
5 Five Forces Analysis
- 5.1 Five forces summary
- Five forces analysis - Comparison between 2023 and 2028
- 5.2 Bargaining power of buyers
- Bargaining power of buyers - Impact of key factors 2023 and 2028
- 5.3 Bargaining power of suppliers
- Bargaining power of suppliers - Impact of key factors in 2023 and 2028
- 5.4 Threat of new entrants
- Threat of new entrants - Impact of key factors in 2023 and 2028
- 5.5 Threat of substitutes
- Threat of substitutes - Impact of key factors in 2023 and 2028
- 5.6 Threat of rivalry
- Threat of rivalry - Impact of key factors in 2023 and 2028
- 5.7 Market condition
- Chart on Market condition - Five forces 2023 and 2028
6 Market Segmentation by End-user
- 6.1 Market segments
- Chart on End-user - Market share 2023-2028 (%)
- Data Table on End-user - Market share 2023-2028 (%)
- 6.2 Comparison by End-user
- Chart on Comparison by End-user
- Data Table on Comparison by End-user
- 6.3 Telecommunication - Market size and forecast 2023-2028
- Chart on Telecommunication - Market size and forecast 2023-2028 ($ million)
- Data Table on Telecommunication - Market size and forecast 2023-2028 ($ million)
- Chart on Telecommunication - Year-over-year growth 2023-2028 (%)
- Data Table on Telecommunication - Year-over-year growth 2023-2028 (%)
- 6.4 Transportation and military - Market size and forecast 2023-2028
- Chart on Transportation and military - Market size and forecast 2023-2028 ($ million)
- Data Table on Transportation and military - Market size and forecast 2023-2028 ($ million)
- Chart on Transportation and military - Year-over-year growth 2023-2028 (%)
- Data Table on Transportation and military - Year-over-year growth 2023-2028 (%)
- 6.5 CATV providers - Market size and forecast 2023-2028
- Chart on CATV providers - Market size and forecast 2023-2028 ($ million)
- Data Table on CATV providers - Market size and forecast 2023-2028 ($ million)
- Chart on CATV providers - Year-over-year growth 2023-2028 (%)
- Data Table on CATV providers - Year-over-year growth 2023-2028 (%)
- 6.6 Others - Market size and forecast 2023-2028
- Chart on Others - Market size and forecast 2023-2028 ($ million)
- Data Table on Others - Market size and forecast 2023-2028 ($ million)
- Chart on Others - Year-over-year growth 2023-2028 (%)
- Data Table on Others - Year-over-year growth 2023-2028 (%)
- 6.7 Market opportunity by End-user
- Market opportunity by End-user ($ million)
- Data Table on Market opportunity by End-user ($ million)
7 Market Segmentation by Application
- 7.1 Market segments
- Chart on Application - Market share 2023-2028 (%)
- Data Table on Application - Market share 2023-2028 (%)
- 7.2 Comparison by Application
- Chart on Comparison by Application
- Data Table on Comparison by Application
- 7.3 Video distribution - Market size and forecast 2023-2028
- Chart on Video distribution - Market size and forecast 2023-2028 ($ million)
- Data Table on Video distribution - Market size and forecast 2023-2028 ($ million)
- Chart on Video distribution - Year-over-year growth 2023-2028 (%)
- Data Table on Video distribution - Year-over-year growth 2023-2028 (%)
- 7.4 Internet data transfer - Market size and forecast 2023-2028
- Chart on Internet data transfer - Market size and forecast 2023-2028 ($ million)
- Data Table on Internet data transfer - Market size and forecast 2023-2028 ($ million)
- Chart on Internet data transfer - Year-over-year growth 2023-2028 (%)
- Data Table on Internet data transfer - Year-over-year growth 2023-2028 (%)
- 7.5 Radio frequency transfer - Market size and forecast 2023-2028
- Chart on Radio frequency transfer - Market size and forecast 2023-2028 ($ million)
- Data Table on Radio frequency transfer - Market size and forecast 2023-2028 ($ million)
- Chart on Radio frequency transfer - Year-over-year growth 2023-2028 (%)
- Data Table on Radio frequency transfer - Year-over-year growth 2023-2028 (%)
- 7.6 Market opportunity by Application
- Market opportunity by Application ($ million)
- Data Table on Market opportunity by Application ($ million)
8 Customer Landscape
- 8.1 Customer landscape overview
- Analysis of price sensitivity, lifecycle, customer purchase basket, adoption rates, and purchase criteria
9 Geographic Landscape
- 9.1 Geographic segmentation
- Chart on Market share By Geographical Landscape 2023-2028 (%)
- Data Table on Market share By Geographical Landscape 2023-2028 (%)
- 9.2 Geographic comparison
- Chart on Geographic comparison
- Data Table on Geographic comparison
- 9.3 APAC - Market size and forecast 2023-2028
- Chart on APAC - Market size and forecast 2023-2028 ($ million)
- Data Table on APAC - Market size and forecast 2023-2028 ($ million)
- Chart on APAC - Year-over-year growth 2023-2028 (%)
- Data Table on APAC - Year-over-year growth 2023-2028 (%)
- 9.4 Europe - Market size and forecast 2023-2028
- Chart on Europe - Market size and forecast 2023-2028 ($ million)
- Data Table on Europe - Market size and forecast 2023-2028 ($ million)
- Chart on Europe - Year-over-year growth 2023-2028 (%)
- Data Table on Europe - Year-over-year growth 2023-2028 (%)
- 9.5 North America - Market size and forecast 2023-2028
- Chart on North America - Market size and forecast 2023-2028 ($ million)
- Data Table on North America - Market size and forecast 2023-2028 ($ million)
- Chart on North America - Year-over-year growth 2023-2028 (%)
- Data Table on North America - Year-over-year growth 2023-2028 (%)
- 9.6 Middle East and Africa - Market size and forecast 2023-2028
- Chart on Middle East and Africa - Market size and forecast 2023-2028 ($ million)
- Data Table on Middle East and Africa - Market size and forecast 2023-2028 ($ million)
- Chart on Middle East and Africa - Year-over-year growth 2023-2028 (%)
- Data Table on Middle East and Africa - Year-over-year growth 2023-2028 (%)
- 9.7 South America - Market size and forecast 2023-2028
- Chart on South America - Market size and forecast 2023-2028 ($ million)
- Data Table on South America - Market size and forecast 2023-2028 ($ million)
- Chart on South America - Year-over-year growth 2023-2028 (%)
- Data Table on South America - Year-over-year growth 2023-2028 (%)
- 9.8 China - Market size and forecast 2023-2028
- Chart on China - Market size and forecast 2023-2028 ($ million)
- Data Table on China - Market size and forecast 2023-2028 ($ million)
- Chart on China - Year-over-year growth 2023-2028 (%)
- Data Table on China - Year-over-year growth 2023-2028 (%)
- 9.9 US - Market size and forecast 2023-2028
- Chart on US - Market size and forecast 2023-2028 ($ million)
- Data Table on US - Market size and forecast 2023-2028 ($ million)
- Chart on US - Year-over-year growth 2023-2028 (%)
- Data Table on US - Year-over-year growth 2023-2028 (%)
- 9.10 Japan - Market size and forecast 2023-2028
- Chart on Japan - Market size and forecast 2023-2028 ($ million)
- Data Table on Japan - Market size and forecast 2023-2028 ($ million)
- Chart on Japan - Year-over-year growth 2023-2028 (%)
- Data Table on Japan - Year-over-year growth 2023-2028 (%)
- 9.11 Germany - Market size and forecast 2023-2028
- Chart on Germany - Market size and forecast 2023-2028 ($ million)
- Data Table on Germany - Market size and forecast 2023-2028 ($ million)
- Chart on Germany - Year-over-year growth 2023-2028 (%)
- Data Table on Germany - Year-over-year growth 2023-2028 (%)
- 9.12 South Korea - Market size and forecast 2023-2028
- Chart on South Korea - Market size and forecast 2023-2028 ($ million)
- Data Table on South Korea - Market size and forecast 2023-2028 ($ million)
- Chart on South Korea - Year-over-year growth 2023-2028 (%)
- Data Table on South Korea - Year-over-year growth 2023-2028 (%)
- 9.13 Market opportunity By Geographical Landscape
- Market opportunity By Geographical Landscape ($ million)
- Data Tables on Market opportunity By Geographical Landscape ($ million)
10 Drivers, Challenges, and Opportunity/Restraints
- 10.1 Market drivers
- 10.2 Market challenges
- 10.3 Impact of drivers and challenges
- Impact of drivers and challenges in 2023 and 2028
- 10.4 Market opportunities/restraints
11 Competitive Landscape
- 11.1 Overview
- 11.2 Competitive Landscape
- Overview on criticality of inputs and factors of differentiation
- 11.3 Landscape disruption
- Overview on factors of disruption
- 11.4 Industry risks
- Impact of key risks on business
12 Competitive Analysis
- 12.1 Companies profiled
- Companies covered
- 12.2 Market positioning of companies
- Matrix on companies position and classification
- 12.3 Amphenol Corp.
- Amphenol Corp. - Overview
- Amphenol Corp. - Business segments
- Amphenol Corp. - Key news
- Amphenol Corp. - Key offerings
- Amphenol Corp. - Segment focus
- 12.4 Belden Inc.
- Belden Inc. - Overview
- Belden Inc. - Business segments
- Belden Inc. - Key news
- Belden Inc. - Key offerings
- Belden Inc. - Segment focus
- 12.5 Coleman Wires and Cables
- Coleman Wires and Cables - Overview
- Coleman Wires and Cables - Product / Service
- Coleman Wires and Cables - Key offerings
- 12.6 CommScope Holding Co. Inc.
- CommScope Holding Co. Inc. - Overview
- CommScope Holding Co. Inc. - Business segments
- CommScope Holding Co. Inc. - Key news
- CommScope Holding Co. Inc. - Key offerings
- CommScope Holding Co. Inc. - Segment focus
- 12.7 Habia Cable AB
- Habia Cable AB - Overview
- Habia Cable AB - Product / Service
- Habia Cable AB - Key offerings
- 12.8 Hengxin Technology Ltd.
- Hengxin Technology Ltd. - Overview
- Hengxin Technology Ltd. - Business segments
- Hengxin Technology Ltd. - Key offerings
- Hengxin Technology Ltd. - Segment focus
- 12.9 HUBER SUHNER AG
- HUBER SUHNER AG - Overview
- HUBER SUHNER AG - Business segments
- HUBER SUHNER AG - Key offerings
- HUBER SUHNER AG - Segment focus
- 12.10 Infinite Electronics Inc.
- Infinite Electronics Inc. - Overview
- Infinite Electronics Inc. - Product / Service
- Infinite Electronics Inc. - Key offerings
- 12.11 Infinite Electronics International Inc.
- Infinite Electronics International Inc. - Overview
- Infinite Electronics International Inc. - Product / Service
- Infinite Electronics International Inc. - Key offerings
- 12.12 Leoni AG
- Leoni AG - Overview
- Leoni AG - Business segments
- Leoni AG - Key offerings
- Leoni AG - Segment focus
- 12.13 LS Cable and System Ltd.
- LS Cable and System Ltd. - Overview
- LS Cable and System Ltd. - Product / Service
- LS Cable and System Ltd. - Key offerings
- 12.14 Prysmian Spa
- Prysmian Spa - Overview
- Prysmian Spa - Business segments
- Prysmian Spa - Key news
- Prysmian Spa - Key offerings
- Prysmian Spa - Segment focus
- 12.15 Sumitomo Electric Industries Ltd.
- Sumitomo Electric Industries Ltd. - Overview
- Sumitomo Electric Industries Ltd. - Business segments
- Sumitomo Electric Industries Ltd. - Key news
- Sumitomo Electric Industries Ltd. - Key offerings
- Sumitomo Electric Industries Ltd. - Segment focus
- 12.16 Trigiant Group Ltd.
- Trigiant Group Ltd. - Overview
- Trigiant Group Ltd. - Product / Service
- Trigiant Group Ltd. - Key offerings
- 12.17 Zhuhai Hansen Technology Co. Ltd.
- Zhuhai Hansen Technology Co. Ltd. - Overview
- Zhuhai Hansen Technology Co. Ltd. - Product / Service
- Zhuhai Hansen Technology Co. Ltd. - Key offerings
13 Appendix
- 13.1 Scope of the report
- 13.2 Inclusions and exclusions checklist
- Inclusions checklist
- Exclusions checklist
- 13.3 Currency conversion rates for US$
- Currency conversion rates for US$
- 13.4 Research methodology
- Research methodology
- 13.5 Data procurement
- Information sources
- 13.6 Data validation
- Data validation
- 13.7 Validation techniques employed for market sizing
- Validation techniques employed for market sizing
- 13.8 Data synthesis
- Data synthesis
- 360 degree market analysis
- 360 degree market analysis
- 13.10 List of abbreviations
- List of abbreviations
