|
|
市場調査レポート
商品コード
1479790
免疫グロブリン製剤の世界市場 2024-2028Global Immunoglobulin Products Market 2024-2028 |
||||||
|
|||||||
カスタマイズ可能
|
|||||||

| 免疫グロブリン製剤の世界市場 2024-2028 |
|
出版日: 2024年05月07日
発行: TechNavio
ページ情報: 英文 169 Pages
納期: 即納可能
|

全表示
- 概要
- 図表
- 目次
免疫グロブリン製剤市場は2023-2028年に96億9,984万米ドル、予測期間中のCAGRは10.11%で成長すると予測されます。
当レポートでは、免疫グロブリン製剤市場の全体的な分析、市場規模・予測、動向、成長促進要因、課題、約25のベンダーを網羅したベンダー分析などを掲載しています。
現在の市場シナリオ、最新動向と促進要因、市場環境全体に関する最新分析を提供しています。市場は、最近の免疫グロブリン製品の開発、免疫不全症や自己免疫疾患の有病率の上昇、高齢者人口の増加によって牽引されています。
| 市場範囲 | |
|---|---|
| 基準年 | 2024 |
| 終了年 | 2028 |
| 予測期間 | 2024-2028 |
| 成長モメンタム | 加速 |
| 前年比2024年 | 8.65% |
| CAGR | 10.11% |
| 増分額 | 96億9,984万米ドル |
本調査では、バイオテクノロジーと製造プロセスの進歩が、今後数年間の免疫グロブリン製剤市場成長を牽引する主要因の1つであると特定しています。また、皮下投与の採用が増加し、個別化医療への注目が高まっていることも、市場の大きな需要につながります。
目次
第1章 エグゼクティブサマリー
- 市場概要
第2章 市場情勢
- 市場エコシステム
第3章 市場規模の評価
- 市場の定義
- 市場セグメント分析
- 市場規模 2023
- 市場の見通し 2023-2028
第4章 市場規模実績
- 免疫グロブリン製剤の世界市場 2018-2022
- 製品セグメント分析 2018-2022
- 投与経路セグメント分析 2018-2022
- 地域別セグメント分析 2018-2022
- 国別セグメント分析 2018-2022
第5章 ファイブフォース分析
- ファイブフォースの要約
- 買い手の交渉力
- 供給企業の交渉力
- 新規参入業者の脅威
- 代替品の脅威
- 競争の脅威
- 市況
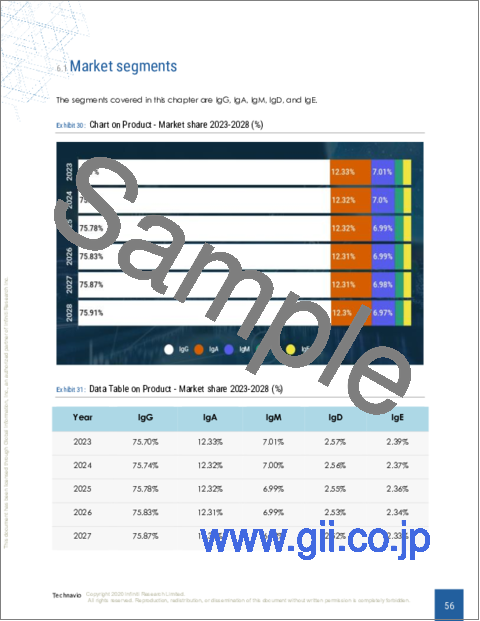
第6章 製品別の市場セグメンテーション
- 市場セグメント
- 比較:製品別
- IgG:市場規模と予測 2023-2028
- IgA:市場規模と予測 2023-2028
- IgM:市場規模と予測 2023-2028
- IgD:市場規模と予測 2023-2028
- IgE:市場規模と予測 2023-2028
- 市場機会:製品別
第7章 投与経路別市場セグメンテーション
- 市場セグメント
- 比較:投与経路別
- 静脈内(IV):市場規模と予測 2023-2028
- 皮下(SC):市場規模と予測 2023-2028
- 筋肉内(IM):市場規模と予測 2023-2028
- 市場機会:投与経路別
第8章 顧客情勢
- 顧客情勢の概要
第9章 地域別情勢
- 地域別セグメンテーション
- 地域別比較
- 北米:市場規模と予測 2023-2028
- 欧州:市場規模と予測 2023-2028
- アジア:市場規模と予測 2023-2028
- 世界のその他の地域:市場規模と予測 2023-2028
- 米国:市場規模と予測 2023-2028
- 中国:市場規模と予測 2023-2028
- ドイツ:市場規模と予測 2023-2028
- 英国:市場規模と予測 2023-2028
- 日本:市場規模と予測 2023-2028
- 市場機会:地域情勢別
第10章 促進要因、課題、および動向
- 市場促進要因
- 市場の課題
- 促進要因と課題の影響
- 市場動向
第11章 ベンダー情勢
- 概要
- ベンダー情勢
- 混乱の状況
- 業界のリスク
第12章 ベンダー分析
- 対象ベンダー
- ベンダーの市場ポジショニング
- ADMA Biologics Inc.
- Bio Products Laboratory Ltd.
- Biocon Ltd.
- CSL Ltd.
- GC Biopharma corp.
- Grifols SA
- Kedrion S.p.A
- LFB SA
- Novartis AG
- Octapharma AG
- Pfizer Inc.
- Serum Institute of India Pvt. Ltd.
- Shanghai RAAS Blood Products Co. Ltd.
- Taibang Biological Group Co. Ltd.
- Taj Pharmaceuticals Ltd.
- Takeda Pharmaceutical Co. Ltd.
第13章 付録
Exhibits:
- Exhibits1: Executive Summary - Chart on Market Overview
- Exhibits2: Executive Summary - Data Table on Market Overview
- Exhibits3: Executive Summary - Chart on Global Market Characteristics
- Exhibits4: Executive Summary - Chart on Market By Geographical Landscape
- Exhibits5: Executive Summary - Chart on Market Segmentation by Product
- Exhibits6: Executive Summary - Chart on Market Segmentation by Route of Administration
- Exhibits7: Executive Summary - Chart on Incremental Growth
- Exhibits8: Executive Summary - Data Table on Incremental Growth
- Exhibits9: Executive Summary - Chart on Vendor Market Positioning
- Exhibits10: Parent market
- Exhibits11: Market Characteristics
- Exhibits12: Offerings of vendors included in the market definition
- Exhibits13: Market segments
- Exhibits14: Chart on Global - Market size and forecast 2023-2028 ($ million)
- Exhibits15: Data Table on Global - Market size and forecast 2023-2028 ($ million)
- Exhibits16: Chart on Global Market: Year-over-year growth 2023-2028 (%)
- Exhibits17: Data Table on Global Market: Year-over-year growth 2023-2028 (%)
- Exhibits18: Historic Market Size - Data Table on global immunoglobulin products market 2018 - 2022 ($ million)
- Exhibits19: Historic Market Size - Product Segment 2018 - 2022 ($ million)
- Exhibits20: Historic Market Size - Route of Administration Segment 2018 - 2022 ($ million)
- Exhibits21: Historic Market Size - Geography Segment 2018 - 2022 ($ million)
- Exhibits22: Historic Market Size - Country Segment 2018 - 2022 ($ million)
- Exhibits23: Five forces analysis - Comparison between 2023 and 2028
- Exhibits24: Chart on Bargaining power of buyers - Impact of key factors 2023 and 2028
- Exhibits25: Bargaining power of suppliers - Impact of key factors in 2023 and 2028
- Exhibits26: Threat of new entrants - Impact of key factors in 2023 and 2028
- Exhibits27: Threat of substitutes - Impact of key factors in 2023 and 2028
- Exhibits28: Threat of rivalry - Impact of key factors in 2023 and 2028
- Exhibits29: Chart on Market condition - Five forces 2023 and 2028
- Exhibits30: Chart on Product - Market share 2023-2028 (%)
- Exhibits31: Data Table on Product - Market share 2023-2028 (%)
- Exhibits32: Chart on Comparison by Product
- Exhibits33: Data Table on Comparison by Product
- Exhibits34: Chart on IgG - Market size and forecast 2023-2028 ($ million)
- Exhibits35: Data Table on IgG - Market size and forecast 2023-2028 ($ million)
- Exhibits36: Chart on IgG - Year-over-year growth 2023-2028 (%)
- Exhibits37: Data Table on IgG - Year-over-year growth 2023-2028 (%)
- Exhibits38: Chart on IgA - Market size and forecast 2023-2028 ($ million)
- Exhibits39: Data Table on IgA - Market size and forecast 2023-2028 ($ million)
- Exhibits40: Chart on IgA - Year-over-year growth 2023-2028 (%)
- Exhibits41: Data Table on IgA - Year-over-year growth 2023-2028 (%)
- Exhibits42: Chart on IgM - Market size and forecast 2023-2028 ($ million)
- Exhibits43: Data Table on IgM - Market size and forecast 2023-2028 ($ million)
- Exhibits44: Chart on IgM - Year-over-year growth 2023-2028 (%)
- Exhibits45: Data Table on IgM - Year-over-year growth 2023-2028 (%)
- Exhibits46: Chart on IgD - Market size and forecast 2023-2028 ($ million)
- Exhibits47: Data Table on IgD - Market size and forecast 2023-2028 ($ million)
- Exhibits48: Chart on IgD - Year-over-year growth 2023-2028 (%)
- Exhibits49: Data Table on IgD - Year-over-year growth 2023-2028 (%)
- Exhibits50: Chart on IgE - Market size and forecast 2023-2028 ($ million)
- Exhibits51: Data Table on IgE - Market size and forecast 2023-2028 ($ million)
- Exhibits52: Chart on IgE - Year-over-year growth 2023-2028 (%)
- Exhibits53: Data Table on IgE - Year-over-year growth 2023-2028 (%)
- Exhibits54: Market opportunity by Product ($ million)
- Exhibits55: Data Table on Market opportunity by Product ($ million)
- Exhibits56: Chart on Route of Administration - Market share 2023-2028 (%)
- Exhibits57: Data Table on Route of Administration - Market share 2023-2028 (%)
- Exhibits58: Chart on Comparison by Route of Administration
- Exhibits59: Data Table on Comparison by Route of Administration
- Exhibits60: Chart on Intravenous (IV) - Market size and forecast 2023-2028 ($ million)
- Exhibits61: Data Table on Intravenous (IV) - Market size and forecast 2023-2028 ($ million)
- Exhibits62: Chart on Intravenous (IV) - Year-over-year growth 2023-2028 (%)
- Exhibits63: Data Table on Intravenous (IV) - Year-over-year growth 2023-2028 (%)
- Exhibits64: Chart on Subcutaneous (SC) - Market size and forecast 2023-2028 ($ million)
- Exhibits65: Data Table on Subcutaneous (SC) - Market size and forecast 2023-2028 ($ million)
- Exhibits66: Chart on Subcutaneous (SC) - Year-over-year growth 2023-2028 (%)
- Exhibits67: Data Table on Subcutaneous (SC) - Year-over-year growth 2023-2028 (%)
- Exhibits68: Chart on Intramuscular (IM) - Market size and forecast 2023-2028 ($ million)
- Exhibits69: Data Table on Intramuscular (IM) - Market size and forecast 2023-2028 ($ million)
- Exhibits70: Chart on Intramuscular (IM) - Year-over-year growth 2023-2028 (%)
- Exhibits71: Data Table on Intramuscular (IM) - Year-over-year growth 2023-2028 (%)
- Exhibits72: Market opportunity by Route of Administration ($ million)
- Exhibits73: Data Table on Market opportunity by Route of Administration ($ million)
- Exhibits74: Analysis of price sensitivity, lifecycle, customer purchase basket, adoption rates, and purchase criteria
- Exhibits75: Chart on Market share By Geographical Landscape 2023-2028 (%)
- Exhibits76: Data Table on Market share By Geographical Landscape 2023-2028 (%)
- Exhibits77: Chart on Geographic comparison
- Exhibits78: Data Table on Geographic comparison
- Exhibits79: Chart on North America - Market size and forecast 2023-2028 ($ million)
- Exhibits80: Data Table on North America - Market size and forecast 2023-2028 ($ million)
- Exhibits81: Chart on North America - Year-over-year growth 2023-2028 (%)
- Exhibits82: Data Table on North America - Year-over-year growth 2023-2028 (%)
- Exhibits83: Chart on Europe - Market size and forecast 2023-2028 ($ million)
- Exhibits84: Data Table on Europe - Market size and forecast 2023-2028 ($ million)
- Exhibits85: Chart on Europe - Year-over-year growth 2023-2028 (%)
- Exhibits86: Data Table on Europe - Year-over-year growth 2023-2028 (%)
- Exhibits87: Chart on Asia - Market size and forecast 2023-2028 ($ million)
- Exhibits88: Data Table on Asia - Market size and forecast 2023-2028 ($ million)
- Exhibits89: Chart on Asia - Year-over-year growth 2023-2028 (%)
- Exhibits90: Data Table on Asia - Year-over-year growth 2023-2028 (%)
- Exhibits91: Chart on Rest of World (ROW) - Market size and forecast 2023-2028 ($ million)
- Exhibits92: Data Table on Rest of World (ROW) - Market size and forecast 2023-2028 ($ million)
- Exhibits93: Chart on Rest of World (ROW) - Year-over-year growth 2023-2028 (%)
- Exhibits94: Data Table on Rest of World (ROW) - Year-over-year growth 2023-2028 (%)
- Exhibits95: Chart on US - Market size and forecast 2023-2028 ($ million)
- Exhibits96: Data Table on US - Market size and forecast 2023-2028 ($ million)
- Exhibits97: Chart on US - Year-over-year growth 2023-2028 (%)
- Exhibits98: Data Table on US - Year-over-year growth 2023-2028 (%)
- Exhibits99: Chart on China - Market size and forecast 2023-2028 ($ million)
- Exhibits100: Data Table on China - Market size and forecast 2023-2028 ($ million)
- Exhibits101: Chart on China - Year-over-year growth 2023-2028 (%)
- Exhibits102: Data Table on China - Year-over-year growth 2023-2028 (%)
- Exhibits103: Chart on Germany - Market size and forecast 2023-2028 ($ million)
- Exhibits104: Data Table on Germany - Market size and forecast 2023-2028 ($ million)
- Exhibits105: Chart on Germany - Year-over-year growth 2023-2028 (%)
- Exhibits106: Data Table on Germany - Year-over-year growth 2023-2028 (%)
- Exhibits107: Chart on UK - Market size and forecast 2023-2028 ($ million)
- Exhibits108: Data Table on UK - Market size and forecast 2023-2028 ($ million)
- Exhibits109: Chart on UK - Year-over-year growth 2023-2028 (%)
- Exhibits110: Data Table on UK - Year-over-year growth 2023-2028 (%)
- Exhibits111: Chart on Japan - Market size and forecast 2023-2028 ($ million)
- Exhibits112: Data Table on Japan - Market size and forecast 2023-2028 ($ million)
- Exhibits113: Chart on Japan - Year-over-year growth 2023-2028 (%)
- Exhibits114: Data Table on Japan - Year-over-year growth 2023-2028 (%)
- Exhibits115: Market opportunity By Geographical Landscape ($ million)
- Exhibits116: Data Tables on Market opportunity By Geographical Landscape ($ million)
- Exhibits117: Impact of drivers and challenges in 2023 and 2028
- Exhibits118: Overview on Criticality of inputs and Factors of differentiation
- Exhibits119: Overview on factors of disruption
- Exhibits120: Impact of key risks on business
- Exhibits121: Vendors covered
- Exhibits122: Matrix on vendor position and classification
- Exhibits123: ADMA Biologics Inc. - Overview
- Exhibits124: ADMA Biologics Inc. - Business segments
- Exhibits125: ADMA Biologics Inc. - Key offerings
- Exhibits126: ADMA Biologics Inc. - Segment focus
- Exhibits127: Bio Products Laboratory Ltd. - Overview
- Exhibits128: Bio Products Laboratory Ltd. - Product / Service
- Exhibits129: Bio Products Laboratory Ltd. - Key offerings
- Exhibits130: Biocon Ltd. - Overview
- Exhibits131: Biocon Ltd. - Business segments
- Exhibits132: Biocon Ltd. - Key news
- Exhibits133: Biocon Ltd. - Key offerings
- Exhibits134: Biocon Ltd. - Segment focus
- Exhibits135: CSL Ltd. - Overview
- Exhibits136: CSL Ltd. - Business segments
- Exhibits137: CSL Ltd. - Key news
- Exhibits138: CSL Ltd. - Key offerings
- Exhibits139: CSL Ltd. - Segment focus
- Exhibits140: GC Biopharma corp. - Overview
- Exhibits141: GC Biopharma corp. - Product / Service
- Exhibits142: GC Biopharma corp. - Key offerings
- Exhibits143: Grifols SA - Overview
- Exhibits144: Grifols SA - Product / Service
- Exhibits145: Grifols SA - Key offerings
- Exhibits146: Kedrion S.p.A - Overview
- Exhibits147: Kedrion S.p.A - Product / Service
- Exhibits148: Kedrion S.p.A - Key offerings
- Exhibits149: LFB SA - Overview
- Exhibits150: LFB SA - Product / Service
- Exhibits151: LFB SA - Key offerings
- Exhibits152: Novartis AG - Overview
- Exhibits153: Novartis AG - Business segments
- Exhibits154: Novartis AG - Key news
- Exhibits155: Novartis AG - Key offerings
- Exhibits156: Novartis AG - Segment focus
- Exhibits157: Octapharma AG - Overview
- Exhibits158: Octapharma AG - Product / Service
- Exhibits159: Octapharma AG - Key offerings
- Exhibits160: Pfizer Inc. - Overview
- Exhibits161: Pfizer Inc. - Product / Service
- Exhibits162: Pfizer Inc. - Key news
- Exhibits163: Pfizer Inc. - Key offerings
- Exhibits164: Serum Institute of India Pvt. Ltd. - Overview
- Exhibits165: Serum Institute of India Pvt. Ltd. - Product / Service
- Exhibits166: Serum Institute of India Pvt. Ltd. - Key offerings
- Exhibits167: Shanghai RAAS Blood Products Co. Ltd. - Overview
- Exhibits168: Shanghai RAAS Blood Products Co. Ltd. - Product / Service
- Exhibits169: Shanghai RAAS Blood Products Co. Ltd. - Key offerings
- Exhibits170: Taibang Biological Group Co. Ltd. - Overview
- Exhibits171: Taibang Biological Group Co. Ltd. - Product / Service
- Exhibits172: Taibang Biological Group Co. Ltd. - Key offerings
- Exhibits173: Taj Pharmaceuticals Ltd. - Overview
- Exhibits174: Taj Pharmaceuticals Ltd. - Product / Service
- Exhibits175: Taj Pharmaceuticals Ltd. - Key offerings
- Exhibits176: Takeda Pharmaceutical Co. Ltd. - Overview
- Exhibits177: Takeda Pharmaceutical Co. Ltd. - Product / Service
- Exhibits178: Takeda Pharmaceutical Co. Ltd. - Key offerings
- Exhibits179: Inclusions checklist
- Exhibits180: Exclusions checklist
- Exhibits181: Currency conversion rates for US$
- Exhibits182: Research methodology
- Exhibits183: Validation techniques employed for market sizing
- Exhibits184: Information sources
- Exhibits185: List of abbreviations
The immunoglobulin products market is forecasted to grow by USD 9699.84 mn during 2023-2028, accelerating at a CAGR of 10.11% during the forecast period. The report on the immunoglobulin products market provides a holistic analysis, market size and forecast, trends, growth drivers, and challenges, as well as vendor analysis covering around 25 vendors.
The report offers an up-to-date analysis regarding the current market scenario, the latest trends and drivers, and the overall market environment. The market is driven by recent immunoglobulin product developments, rising prevalence of immunodeficiency disorders and autoimmune diseases, and growing geriatric population.
Technavio's immunoglobulin products market is segmented as below:
| Market Scope | |
|---|---|
| Base Year | 2024 |
| End Year | 2028 |
| Series Year | 2024-2028 |
| Growth Momentum | Accelerate |
| YOY 2024 | 8.65% |
| CAGR | 10.11% |
| Incremental Value | $9699.84mn |
By Product
- IgG
- IgA
- IgM
- IgD
- IgE
By Route Of Administration
- Intravenous (IV)
- Subcutaneous (SC)
- Intramuscular (IM)
By Geographical Landscape
- North America
- Europe
- Asia
- Rest of World (ROW)
This study identifies the advancements in biotechnology and manufacturing processes as one of the prime reasons driving the immunoglobulin products market growth during the next few years. Also, increasing adoption of subcutaneous administration and growing focus on personalized medicine will lead to sizable demand in the market.
The report on the immunoglobulin products market covers the following areas:
- Immunoglobulin products market sizing
- Immunoglobulin products market forecast
- Immunoglobulin products market industry analysis
The robust vendor analysis is designed to help clients improve their market position, and in line with this, this report provides a detailed analysis of several leading immunoglobulin products market vendors that include ADMA Biologics Inc., Bio Products Laboratory Ltd., Biocon Ltd., CSL Ltd., GC Biopharma corp. , Grifols SA, Kedrion S.p.A, LFB SA, Novartis AG, Octapharma AG, Pfizer Inc., Serum Institute of India Pvt. Ltd., Shanghai RAAS Blood Products Co. Ltd., Taibang Biological Group Co. Ltd., Taj Pharmaceuticals Ltd., and Takeda Pharmaceutical Co. Ltd.. Also, the immunoglobulin products market analysis report includes information on upcoming trends and challenges that will influence market growth. This is to help companies strategize and leverage all forthcoming growth opportunities.
The study was conducted using an objective combination of primary and secondary information including inputs from key participants in the industry. The report contains a comprehensive market and vendor landscape in addition to an analysis of the key vendors.
The publisher presents a detailed picture of the market by the way of study, synthesis, and summation of data from multiple sources by an analysis of key parameters such as profit, pricing, competition, and promotions. It presents various market facets by identifying the key industry influencers. The data presented is comprehensive, reliable, and a result of extensive research - both primary and secondary. The market research reports provide a complete competitive landscape and an in-depth vendor selection methodology and analysis using qualitative and quantitative research to forecast the accurate market growth.
Table of Contents
1 Executive Summary
- 1.1 Market overview
2 Market Landscape
- 2.1 Market ecosystem
3 Market Sizing
- 3.1 Market definition
- 3.2 Market segment analysis
- 3.3 Market size 2023
- 3.4 Market outlook: Forecast for 2023-2028
4 Historic Market Size
- 4.1 Global immunoglobulin products market 2018 - 2022
- 4.2 Product Segment Analysis 2018 - 2022
- 4.3 Route of Administration Segment Analysis 2018 - 2022
- 4.4 Geography Segment Analysis 2018 - 2022
- 4.5 Country Segment Analysis 2018 - 2022
5 Five Forces Analysis
- 5.1 Five forces summary
- 5.2 Bargaining power of buyers
- 5.3 Bargaining power of suppliers
- 5.4 Threat of new entrants
- 5.5 Threat of substitutes
- 5.6 Threat of rivalry
- 5.7 Market condition
6 Market Segmentation by Product
- 6.1 Market segments
- 6.2 Comparison by Product
- 6.3 IgG - Market size and forecast 2023-2028
- 6.4 IgA - Market size and forecast 2023-2028
- 6.5 IgM - Market size and forecast 2023-2028
- 6.6 IgD - Market size and forecast 2023-2028
- 6.7 IgE - Market size and forecast 2023-2028
- 6.8 Market opportunity by Product
7 Market Segmentation by Route of Administration
- 7.1 Market segments
- 7.2 Comparison by Route of Administration
- 7.3 Intravenous (IV) - Market size and forecast 2023-2028
- 7.4 Subcutaneous (SC) - Market size and forecast 2023-2028
- 7.5 Intramuscular (IM) - Market size and forecast 2023-2028
- 7.6 Market opportunity by Route of Administration
8 Customer Landscape
- 8.1 Customer landscape overview
9 Geographic Landscape
- 9.1 Geographic segmentation
- 9.2 Geographic comparison
- 9.3 North America - Market size and forecast 2023-2028
- 9.4 Europe - Market size and forecast 2023-2028
- 9.5 Asia - Market size and forecast 2023-2028
- 9.6 Rest of World (ROW) - Market size and forecast 2023-2028
- 9.7 US - Market size and forecast 2023-2028
- 9.8 China - Market size and forecast 2023-2028
- 9.9 Germany - Market size and forecast 2023-2028
- 9.10 UK - Market size and forecast 2023-2028
- 9.11 Japan - Market size and forecast 2023-2028
- 9.12 Market opportunity By Geographical Landscape
10 Drivers, Challenges, and Trends
- 10.1 Market drivers
- 10.2 Market challenges
- 10.3 Impact of drivers and challenges
- 10.4 Market trends
11 Vendor Landscape
- 11.1 Overview
- 11.2 Vendor landscape
- 11.3 Landscape disruption
- 11.4 Industry risks
12 Vendor Analysis
- 12.1 Vendors covered
- 12.2 Market positioning of vendors
- 12.3 ADMA Biologics Inc.
- 12.4 Bio Products Laboratory Ltd.
- 12.5 Biocon Ltd.
- 12.6 CSL Ltd.
- 12.7 GC Biopharma corp.
- 12.8 Grifols SA
- 12.9 Kedrion S.p.A
- 12.10 LFB SA
- 12.11 Novartis AG
- 12.12 Octapharma AG
- 12.13 Pfizer Inc.
- 12.14 Serum Institute of India Pvt. Ltd.
- 12.15 Shanghai RAAS Blood Products Co. Ltd.
- 12.16 Taibang Biological Group Co. Ltd.
- 12.17 Taj Pharmaceuticals Ltd.
- 12.18 Takeda Pharmaceutical Co. Ltd.
13 Appendix
- 13.1 Scope of the report
- 13.2 Inclusions and exclusions checklist
- 13.3 Currency conversion rates for US$
- 13.4 Research methodology
- 13.5 List of abbreviations

