|
|
市場調査レポート
商品コード
1473731
オリゴヌクレオチド治療薬の世界市場 2024-2028Global Oligonucleotide Therapeutics Market 2024-2028 |
||||||

|
|||||||
カスタマイズ可能
|
|||||||

| オリゴヌクレオチド治療薬の世界市場 2024-2028 |
|
出版日: 2024年04月17日
発行: TechNavio
ページ情報: 英文 169 Pages
納期: 即納可能
|

全表示
- 概要
- 図表
- 目次
オリゴヌクレオチド治療薬市場は2023-2028年に134億4,370万米ドル、予測期間中のCAGRは19.87%で成長すると予測されています。
当レポートでは、オリゴヌクレオチド治療薬市場の全体的な分析、市場規模・予測、動向、成長促進要因、課題、約25のベンダーを網羅したベンダー分析などを掲載しています。
現在の市場シナリオ、最新動向と促進要因、市場環境全体に関する最新分析を提供しています。市場は、がん罹患率の増加による新規診断薬需要の増加、神経疾患に対する個別化医薬品のニーズ、オリゴヌクレオチド治療薬の入手可能性の増加などが牽引しています。
| 市場範囲 | |
|---|---|
| 基準年 | 2024 |
| 終了年 | 2028 |
| 予測期間 | 2024-2028 |
| 成長モメンタム | 加速 |
| 前年比2024年 | 17.98% |
| CAGR | 19.87% |
| 増分額 | 134億4,370万米ドル |
本調査では、DNAシーケンシングの進歩が今後数年間のオリゴヌクレオチド治療薬市場成長を牽引する主要因の1つとして、マイクロ流体技術の採用を増加させていることを指摘しています。また、新興経済諸国における高い市場成長ポテンシャルと、疾患評価における人工知能の採用拡大が、市場の大きな需要につながります。
目次
第1章 エグゼクティブサマリー
- 市場概要
第2章 市場情勢
- 市場エコシステム
第3章 市場規模の評価
- 市場の定義
- 市場セグメント分析
- 市場規模 2023
- 市場の見通し 2023-2028
第4章 市場規模実績
- オリゴヌクレオチド治療薬の世界市場 2018-2022
- タイプセグメント分析 2018-2022
- 用途別セグメント分析 2018-2022
- 地域別セグメント分析 2018-2022
- 国別セグメント分析 2018-2022
第5章 ファイブフォース分析
- ファイブフォースの要約
- 買い手の交渉力
- 供給企業の交渉力
- 新規参入業者の脅威
- 代替品の脅威
- 競争の脅威
- 市況
第6章 市場セグメンテーション:タイプ別
- 市場セグメント
- 比較:タイプ別
- アンチセンスオリゴヌクレオチド(ASO):市場規模と予測 2023-2028
- RNAi(RNA干渉):市場規模と予測 2023-2028
- アプタマーなど:市場規模と予測 2023-2028
- 市場機会:タイプ別
第7章 市場セグメンテーション:用途別
- 市場セグメント
- 比較:用途別
- 神経学:市場規模と予測 2023-2028
- がん:市場規模と予測 2023-2028
- 感染症など:市場規模と予測 2023-2028
- 市場機会:用途別
第8章 顧客情勢
- 顧客情勢の概要
第9章 地域別情勢
- 地域別セグメンテーション
- 地域別比較
- 北米:市場規模と予測 2023-2028
- 欧州:市場規模と予測 2023-2028
- アジア:市場規模と予測 2023-2028
- 世界のその他の地域:市場規模と予測 2023-2028
- 米国:市場規模と予測 2023-2028
- 英国:市場規模と予測 2023-2028
- ドイツ:市場規模と予測 2023-2028
- カナダ:市場規模と予測 2023-2028
- 日本:市場規模と予測 2023-2028
- 市場機会:地域情勢別
第10章 促進要因、課題、および動向
- 市場促進要因
- 市場の課題
- 促進要因と課題の影響
- 市場動向
第11章 ベンダー情勢
- 概要
- ベンダー情勢
- 混乱の状況
- 業界のリスク
第12章 ベンダー分析
- 対象ベンダー
- ベンダーの市場ポジショニング
- Agilent Technologies Inc.
- Alnylam Pharmaceuticals Inc.
- Biogen Inc.
- CSL Ltd.
- GlaxoSmithKline Plc
- Ionis Pharmaceuticals Inc.
- Maravai LifeSciences Holdings Inc.
- Merck KGaA
- Nippon Shinyaku Co. Ltd.
- Novartis AG
- Pfizer Inc.
- Sarepta Therapeutics Inc.
- Thermo Fisher Scientific Inc.
第13章 付録
Exhibits:
- Exhibits1: Executive Summary - Chart on Market Overview
- Exhibits2: Executive Summary - Data Table on Market Overview
- Exhibits3: Executive Summary - Chart on Global Market Characteristics
- Exhibits4: Executive Summary - Chart on Market By Geographical Landscape
- Exhibits5: Executive Summary - Chart on Market Segmentation by Type
- Exhibits6: Executive Summary - Chart on Market Segmentation by Application
- Exhibits7: Executive Summary - Chart on Incremental Growth
- Exhibits8: Executive Summary - Data Table on Incremental Growth
- Exhibits9: Executive Summary - Chart on Vendor Market Positioning
- Exhibits10: Parent market
- Exhibits11: Market Characteristics
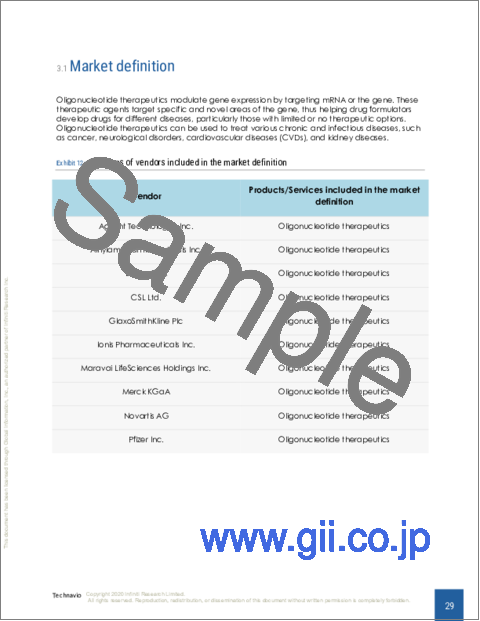
- Exhibits12: Offerings of vendors included in the market definition
- Exhibits13: Market segments
- Exhibits14: Chart on Global - Market size and forecast 2023-2028 ($ million)
- Exhibits15: Data Table on Global - Market size and forecast 2023-2028 ($ million)
- Exhibits16: Chart on Global Market: Year-over-year growth 2023-2028 (%)
- Exhibits17: Data Table on Global Market: Year-over-year growth 2023-2028 (%)
- Exhibits18: Historic Market Size - Data Table on global oligonucleotide therapeutics market 2018 - 2022 ($ million)
- Exhibits19: Historic Market Size - Type Segment 2018 - 2022 ($ million)
- Exhibits20: Historic Market Size - Application Segment 2018 - 2022 ($ million)
- Exhibits21: Historic Market Size - Geography Segment 2018 - 2022 ($ million)
- Exhibits22: Historic Market Size - Country Segment 2018 - 2022 ($ million)
- Exhibits23: Five forces analysis - Comparison between 2023 and 2028
- Exhibits24: Chart on Bargaining power of buyers - Impact of key factors 2023 and 2028
- Exhibits25: Bargaining power of suppliers - Impact of key factors in 2023 and 2028
- Exhibits26: Threat of new entrants - Impact of key factors in 2023 and 2028
- Exhibits27: Threat of substitutes - Impact of key factors in 2023 and 2028
- Exhibits28: Threat of rivalry - Impact of key factors in 2023 and 2028
- Exhibits29: Chart on Market condition - Five forces 2023 and 2028
- Exhibits30: Chart on Type - Market share 2023-2028 (%)
- Exhibits31: Data Table on Type - Market share 2023-2028 (%)
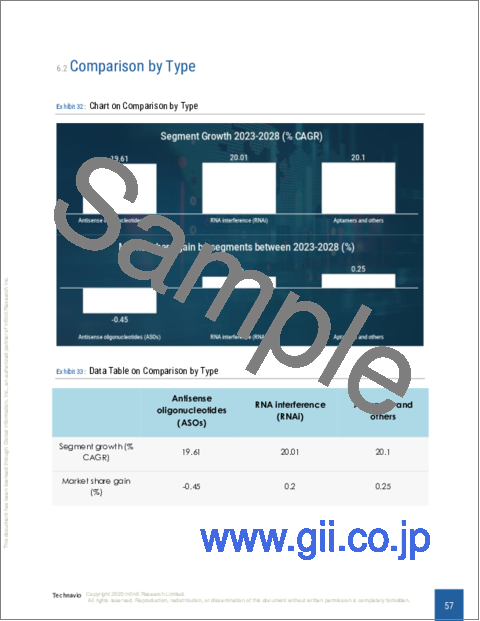
- Exhibits32: Chart on Comparison by Type
- Exhibits33: Data Table on Comparison by Type
- Exhibits34: Chart on Antisense oligonucleotides (ASOs) - Market size and forecast 2023-2028 ($ million)
- Exhibits35: Data Table on Antisense oligonucleotides (ASOs) - Market size and forecast 2023-2028 ($ million)
- Exhibits36: Chart on Antisense oligonucleotides (ASOs) - Year-over-year growth 2023-2028 (%)
- Exhibits37: Data Table on Antisense oligonucleotides (ASOs) - Year-over-year growth 2023-2028 (%)
- Exhibits38: Chart on RNA interference (RNAi) - Market size and forecast 2023-2028 ($ million)
- Exhibits39: Data Table on RNA interference (RNAi) - Market size and forecast 2023-2028 ($ million)
- Exhibits40: Chart on RNA interference (RNAi) - Year-over-year growth 2023-2028 (%)
- Exhibits41: Data Table on RNA interference (RNAi) - Year-over-year growth 2023-2028 (%)
- Exhibits42: Chart on Aptamers and others - Market size and forecast 2023-2028 ($ million)
- Exhibits43: Data Table on Aptamers and others - Market size and forecast 2023-2028 ($ million)
- Exhibits44: Chart on Aptamers and others - Year-over-year growth 2023-2028 (%)
- Exhibits45: Data Table on Aptamers and others - Year-over-year growth 2023-2028 (%)
- Exhibits46: Market opportunity by Type ($ million)
- Exhibits47: Data Table on Market opportunity by Type ($ million)
- Exhibits48: Chart on Application - Market share 2023-2028 (%)
- Exhibits49: Data Table on Application - Market share 2023-2028 (%)
- Exhibits50: Chart on Comparison by Application
- Exhibits51: Data Table on Comparison by Application
- Exhibits52: Chart on Neurological - Market size and forecast 2023-2028 ($ million)
- Exhibits53: Data Table on Neurological - Market size and forecast 2023-2028 ($ million)
- Exhibits54: Chart on Neurological - Year-over-year growth 2023-2028 (%)
- Exhibits55: Data Table on Neurological - Year-over-year growth 2023-2028 (%)
- Exhibits56: Chart on Cancer - Market size and forecast 2023-2028 ($ million)
- Exhibits57: Data Table on Cancer - Market size and forecast 2023-2028 ($ million)
- Exhibits58: Chart on Cancer - Year-over-year growth 2023-2028 (%)
- Exhibits59: Data Table on Cancer - Year-over-year growth 2023-2028 (%)
- Exhibits60: Chart on Infectious diseases and others - Market size and forecast 2023-2028 ($ million)
- Exhibits61: Data Table on Infectious diseases and others - Market size and forecast 2023-2028 ($ million)
- Exhibits62: Chart on Infectious diseases and others - Year-over-year growth 2023-2028 (%)
- Exhibits63: Data Table on Infectious diseases and others - Year-over-year growth 2023-2028 (%)
- Exhibits64: Market opportunity by Application ($ million)
- Exhibits65: Data Table on Market opportunity by Application ($ million)
- Exhibits66: Analysis of price sensitivity, lifecycle, customer purchase basket, adoption rates, and purchase criteria
- Exhibits67: Chart on Market share By Geographical Landscape 2023-2028 (%)
- Exhibits68: Data Table on Market share By Geographical Landscape 2023-2028 (%)
- Exhibits69: Chart on Geographic comparison
- Exhibits70: Data Table on Geographic comparison
- Exhibits71: Chart on North America - Market size and forecast 2023-2028 ($ million)
- Exhibits72: Data Table on North America - Market size and forecast 2023-2028 ($ million)
- Exhibits73: Chart on North America - Year-over-year growth 2023-2028 (%)
- Exhibits74: Data Table on North America - Year-over-year growth 2023-2028 (%)
- Exhibits75: Chart on Europe - Market size and forecast 2023-2028 ($ million)
- Exhibits76: Data Table on Europe - Market size and forecast 2023-2028 ($ million)
- Exhibits77: Chart on Europe - Year-over-year growth 2023-2028 (%)
- Exhibits78: Data Table on Europe - Year-over-year growth 2023-2028 (%)
- Exhibits79: Chart on Asia - Market size and forecast 2023-2028 ($ million)
- Exhibits80: Data Table on Asia - Market size and forecast 2023-2028 ($ million)
- Exhibits81: Chart on Asia - Year-over-year growth 2023-2028 (%)
- Exhibits82: Data Table on Asia - Year-over-year growth 2023-2028 (%)
- Exhibits83: Chart on Rest of World (ROW) - Market size and forecast 2023-2028 ($ million)
- Exhibits84: Data Table on Rest of World (ROW) - Market size and forecast 2023-2028 ($ million)
- Exhibits85: Chart on Rest of World (ROW) - Year-over-year growth 2023-2028 (%)
- Exhibits86: Data Table on Rest of World (ROW) - Year-over-year growth 2023-2028 (%)
- Exhibits87: Chart on US - Market size and forecast 2023-2028 ($ million)
- Exhibits88: Data Table on US - Market size and forecast 2023-2028 ($ million)
- Exhibits89: Chart on US - Year-over-year growth 2023-2028 (%)
- Exhibits90: Data Table on US - Year-over-year growth 2023-2028 (%)
- Exhibits91: Chart on UK - Market size and forecast 2023-2028 ($ million)
- Exhibits92: Data Table on UK - Market size and forecast 2023-2028 ($ million)
- Exhibits93: Chart on UK - Year-over-year growth 2023-2028 (%)
- Exhibits94: Data Table on UK - Year-over-year growth 2023-2028 (%)
- Exhibits95: Chart on Germany - Market size and forecast 2023-2028 ($ million)
- Exhibits96: Data Table on Germany - Market size and forecast 2023-2028 ($ million)
- Exhibits97: Chart on Germany - Year-over-year growth 2023-2028 (%)
- Exhibits98: Data Table on Germany - Year-over-year growth 2023-2028 (%)
- Exhibits99: Chart on Canada - Market size and forecast 2023-2028 ($ million)
- Exhibits100: Data Table on Canada - Market size and forecast 2023-2028 ($ million)
- Exhibits101: Chart on Canada - Year-over-year growth 2023-2028 (%)
- Exhibits102: Data Table on Canada - Year-over-year growth 2023-2028 (%)
- Exhibits103: Chart on Japan - Market size and forecast 2023-2028 ($ million)
- Exhibits104: Data Table on Japan - Market size and forecast 2023-2028 ($ million)
- Exhibits105: Chart on Japan - Year-over-year growth 2023-2028 (%)
- Exhibits106: Data Table on Japan - Year-over-year growth 2023-2028 (%)
- Exhibits107: Market opportunity By Geographical Landscape ($ million)
- Exhibits108: Data Tables on Market opportunity By Geographical Landscape ($ million)
- Exhibits109: Impact of drivers and challenges in 2023 and 2028
- Exhibits110: Overview on Criticality of inputs and Factors of differentiation
- Exhibits111: Overview on factors of disruption
- Exhibits112: Impact of key risks on business
- Exhibits113: Vendors covered
- Exhibits114: Matrix on vendor position and classification
- Exhibits115: Agilent Technologies Inc. - Overview
- Exhibits116: Agilent Technologies Inc. - Business segments
- Exhibits117: Agilent Technologies Inc. - Key news
- Exhibits118: Agilent Technologies Inc. - Key offerings
- Exhibits119: Agilent Technologies Inc. - Segment focus
- Exhibits120: Alnylam Pharmaceuticals Inc. - Overview
- Exhibits121: Alnylam Pharmaceuticals Inc. - Product / Service
- Exhibits122: Alnylam Pharmaceuticals Inc. - Key offerings
- Exhibits123: Biogen Inc. - Overview
- Exhibits124: Biogen Inc. - Product / Service
- Exhibits125: Biogen Inc. - Key news
- Exhibits126: Biogen Inc. - Key offerings
- Exhibits127: CSL Ltd. - Overview
- Exhibits128: CSL Ltd. - Business segments
- Exhibits129: CSL Ltd. - Key news
- Exhibits130: CSL Ltd. - Key offerings
- Exhibits131: CSL Ltd. - Segment focus
- Exhibits132: GlaxoSmithKline Plc - Overview
- Exhibits133: GlaxoSmithKline Plc - Business segments
- Exhibits134: GlaxoSmithKline Plc - Key news
- Exhibits135: GlaxoSmithKline Plc - Key offerings
- Exhibits136: GlaxoSmithKline Plc - Segment focus
- Exhibits137: Ionis Pharmaceuticals Inc. - Overview
- Exhibits138: Ionis Pharmaceuticals Inc. - Business segments
- Exhibits139: Ionis Pharmaceuticals Inc. - Key news
- Exhibits140: Ionis Pharmaceuticals Inc. - Key offerings
- Exhibits141: Ionis Pharmaceuticals Inc. - Segment focus
- Exhibits142: Maravai LifeSciences Holdings Inc. - Overview
- Exhibits143: Maravai LifeSciences Holdings Inc. - Business segments
- Exhibits144: Maravai LifeSciences Holdings Inc. - Key offerings
- Exhibits145: Maravai LifeSciences Holdings Inc. - Segment focus
- Exhibits146: Merck KGaA - Overview
- Exhibits147: Merck KGaA - Business segments
- Exhibits148: Merck KGaA - Key news
- Exhibits149: Merck KGaA - Key offerings
- Exhibits150: Merck KGaA - Segment focus
- Exhibits151: Nippon Shinyaku Co. Ltd. - Overview
- Exhibits152: Nippon Shinyaku Co. Ltd. - Business segments
- Exhibits153: Nippon Shinyaku Co. Ltd. - Key offerings
- Exhibits154: Nippon Shinyaku Co. Ltd. - Segment focus
- Exhibits155: Novartis AG - Overview
- Exhibits156: Novartis AG - Business segments
- Exhibits157: Novartis AG - Key news
- Exhibits158: Novartis AG - Key offerings
- Exhibits159: Novartis AG - Segment focus
- Exhibits160: Pfizer Inc. - Overview
- Exhibits161: Pfizer Inc. - Product / Service
- Exhibits162: Pfizer Inc. - Key news
- Exhibits163: Pfizer Inc. - Key offerings
- Exhibits164: Sarepta Therapeutics Inc. - Overview
- Exhibits165: Sarepta Therapeutics Inc. - Product / Service
- Exhibits166: Sarepta Therapeutics Inc. - Key offerings
- Exhibits167: Thermo Fisher Scientific Inc. - Overview
- Exhibits168: Thermo Fisher Scientific Inc. - Business segments
- Exhibits169: Thermo Fisher Scientific Inc. - Key news
- Exhibits170: Thermo Fisher Scientific Inc. - Key offerings
- Exhibits171: Thermo Fisher Scientific Inc. - Segment focus
- Exhibits172: Inclusions checklist
- Exhibits173: Exclusions checklist
- Exhibits174: Currency conversion rates for US$
- Exhibits175: Research methodology
- Exhibits176: Validation techniques employed for market sizing
- Exhibits177: Information sources
- Exhibits178: List of abbreviations
The oligonucleotide therapeutics market is forecasted to grow by USD 13443.7 mn during 2023-2028, accelerating at a CAGR of 19.87% during the forecast period. The report on the oligonucleotide therapeutics market provides a holistic analysis, market size and forecast, trends, growth drivers, and challenges, as well as vendor analysis covering around 25 vendors.
The report offers an up-to-date analysis regarding the current market scenario, the latest trends and drivers, and the overall market environment. The market is driven by increasing incidence of cancer boosts demand for novel diagnostics, need for personalized medicines for neurological disorders, and increasing availability of oligonucleotide therapeutic drugs.
Technavio's oligonucleotide therapeutics market is segmented as below:
| Market Scope | |
|---|---|
| Base Year | 2024 |
| End Year | 2028 |
| Series Year | 2024-2028 |
| Growth Momentum | Accelerate |
| YOY 2024 | 17.98% |
| CAGR | 19.87% |
| Incremental Value | $13443.7mn |
By Type
- Antisense oligonucleotides
- RNA interference
- Aptamers and others
By Application
- Neurological
- Cancer
- Infectious diseases and others
By Geographical Landscape
- North America
- Europe
- Asia
- Rest of World (ROW)
This study identifies the advances in DNA sequencing increasing adoption of microfluidic techniques as one of the prime reasons driving the oligonucleotide therapeutics market growth during the next few years. Also, high market growth potential in developing economies and growing adoption of artificial intelligence for disease evaluation will lead to sizable demand in the market.
The report on the oligonucleotide therapeutics market covers the following areas:
- Oligonucleotide therapeutics market sizing
- Oligonucleotide therapeutics market forecast
- Oligonucleotide therapeutics market industry analysis
The robust vendor analysis is designed to help clients improve their market position, and in line with this, this report provides a detailed analysis of several leading oligonucleotide therapeutics market vendors that include Agilent Technologies Inc., Alnylam Pharmaceuticals Inc., Biogen Inc., CSL Ltd., GlaxoSmithKline Plc, Ionis Pharmaceuticals Inc., Maravai LifeSciences Holdings Inc., Merck KGaA, Nippon Shinyaku Co. Ltd., Novartis AG, Pfizer Inc., Sarepta Therapeutics Inc., and Thermo Fisher Scientific Inc.. Also, the oligonucleotide therapeutics market analysis report includes information on upcoming trends and challenges that will influence market growth. This is to help companies strategize and leverage all forthcoming growth opportunities.
The study was conducted using an objective combination of primary and secondary information including inputs from key participants in the industry. The report contains a comprehensive market and vendor landscape in addition to an analysis of the key vendors.
The publisher presents a detailed picture of the market by the way of study, synthesis, and summation of data from multiple sources by an analysis of key parameters such as profit, pricing, competition, and promotions. It presents various market facets by identifying the key industry influencers. The data presented is comprehensive, reliable, and a result of extensive research - both primary and secondary. The market research reports provide a complete competitive landscape and an in-depth vendor selection methodology and analysis using qualitative and quantitative research to forecast the accurate market growth.
Table of Contents
1 Executive Summary
- 1.1 Market overview
2 Market Landscape
- 2.1 Market ecosystem
3 Market Sizing
- 3.1 Market definition
- 3.2 Market segment analysis
- 3.3 Market size 2023
- 3.4 Market outlook: Forecast for 2023-2028
4 Historic Market Size
- 4.1 Global oligonucleotide therapeutics market 2018 - 2022
- 4.2 Type Segment Analysis 2018 - 2022
- 4.3 Application Segment Analysis 2018 - 2022
- 4.4 Geography Segment Analysis 2018 - 2022
- 4.5 Country Segment Analysis 2018 - 2022
5 Five Forces Analysis
- 5.1 Five forces summary
- 5.2 Bargaining power of buyers
- 5.3 Bargaining power of suppliers
- 5.4 Threat of new entrants
- 5.5 Threat of substitutes
- 5.6 Threat of rivalry
- 5.7 Market condition
6 Market Segmentation by Type
- 6.1 Market segments
- 6.2 Comparison by Type
- 6.3 Antisense oligonucleotides (ASOs) - Market size and forecast 2023-2028
- 6.4 RNA interference (RNAi) - Market size and forecast 2023-2028
- 6.5 Aptamers and others - Market size and forecast 2023-2028
- 6.6 Market opportunity by Type
7 Market Segmentation by Application
- 7.1 Market segments
- 7.2 Comparison by Application
- 7.3 Neurological - Market size and forecast 2023-2028
- 7.4 Cancer - Market size and forecast 2023-2028
- 7.5 Infectious diseases and others - Market size and forecast 2023-2028
- 7.6 Market opportunity by Application
8 Customer Landscape
- 8.1 Customer landscape overview
9 Geographic Landscape
- 9.1 Geographic segmentation
- 9.2 Geographic comparison
- 9.3 North America - Market size and forecast 2023-2028
- 9.4 Europe - Market size and forecast 2023-2028
- 9.5 Asia - Market size and forecast 2023-2028
- 9.6 Rest of World (ROW) - Market size and forecast 2023-2028
- 9.7 US - Market size and forecast 2023-2028
- 9.8 UK - Market size and forecast 2023-2028
- 9.9 Germany - Market size and forecast 2023-2028
- 9.10 Canada - Market size and forecast 2023-2028
- 9.11 Japan - Market size and forecast 2023-2028
- 9.12 Market opportunity By Geographical Landscape
10 Drivers, Challenges, and Trends
- 10.1 Market drivers
- 10.2 Market challenges
- 10.3 Impact of drivers and challenges
- 10.4 Market trends
11 Vendor Landscape
- 11.1 Overview
- 11.2 Vendor landscape
- 11.3 Landscape disruption
- 11.4 Industry risks
12 Vendor Analysis
- 12.1 Vendors covered
- 12.2 Market positioning of vendors
- 12.3 Agilent Technologies Inc.
- 12.4 Alnylam Pharmaceuticals Inc.
- 12.5 Biogen Inc.
- 12.6 CSL Ltd.
- 12.7 GlaxoSmithKline Plc
- 12.8 Ionis Pharmaceuticals Inc.
- 12.9 Maravai LifeSciences Holdings Inc.
- 12.10 Merck KGaA
- 12.11 Nippon Shinyaku Co. Ltd.
- 12.12 Novartis AG
- 12.13 Pfizer Inc.
- 12.14 Sarepta Therapeutics Inc.
- 12.15 Thermo Fisher Scientific Inc.
13 Appendix
- 13.1 Scope of the report
- 13.2 Inclusions and exclusions checklist
- 13.3 Currency conversion rates for US$
- 13.4 Research methodology
- 13.5 List of abbreviations
