|
|
市場調査レポート
商品コード
1462452
ゲノム編集の世界市場 2024-2028Global Genome Editing Market 2024-2028 |
||||||

|
|||||||
カスタマイズ可能
|
|||||||


| ゲノム編集の世界市場 2024-2028 |
|
出版日: 2024年03月28日
発行: TechNavio
ページ情報: 英文 163 Pages
納期: 即納可能
|

全表示
- 概要
- 図表
- 目次
ゲノム編集市場は2023-2028年に72億3,000万米ドル、予測期間中のCAGRは15.88%で成長すると予測されます。
当レポートでは、ゲノム編集市場の全体的な分析、市場規模・予測、動向、成長促進要因、課題、約25のベンダーを網羅したベンダー分析などを掲載しています。
現在の市場シナリオ、最新動向と促進要因、市場環境全体に関する最新分析を提供しています。市場は、ゲノム編集における急速な技術進歩、個別化医療に対する需要の増加、新規遺伝子編集プラットフォームの出現によって牽引されています。
| 市場範囲 | |
|---|---|
| 基準年 | 2024 |
| 終了年 | 2028 |
| 予測期間 | 2024-2028 |
| 成長モメンタム | 加速 |
| 前年比2024年 | 14.56% |
| CAGR | 15.88% |
| 増分額 | 72億3,000万米ドル |
本調査では、今後数年間のゲノム編集市場成長を促進する主な理由の1つとして、CRISPRベースの診断の台頭を挙げています。また、遺伝子編集とAIやデータ解析の統合が進み、農業や家畜へのゲノム編集導入が増加していることも、市場の大きな需要につながります。
目次
第1章 エグゼクティブサマリー
- 市場概要
第2章 市場情勢
- 市場エコシステム
第3章 市場規模の評価
- 市場の定義
- 市場セグメント分析
- 市場規模 2023
- 市場の見通し 2023-2028
第4章 市場規模実績
- ゲノム編集の世界市場 2018-2022
- エンドユーザーセグメント分析 2018-2022
- 配信モードセグメント分析 2018-2022
- 地域別セグメント分析 2018-2022
- 国別セグメント分析 2018-2022
第5章 ファイブフォース分析
- ファイブフォースの要約
- 買い手の交渉力
- 供給企業の交渉力
- 新規参入業者の脅威
- 代替品の脅威
- 競争の脅威
- 市況
第6章 市場セグメンテーション:エンドユーザー別
- 市場セグメント
- 比較:エンドユーザー別
- 製薬とバイオテクノロジー企業:市場規模と予測 2023-2028
- 学術機関と調査機関:市場規模と予測 2023-2028
- 医薬品開発業務受託機関 :市場規模と予測 2023-2028
- 市場機会:エンドユーザー別
第7章 市場セグメンテーション配送方法別
- 市場セグメント
- 比較配送方法別
- 生体外:市場規模と予測 2023-2028
- 生体内:市場規模と予測 2023-2028
- 市場機会配送方法別
第8章 顧客情勢
- 顧客情勢の概要
第9章 地域別情勢
- 地域別セグメンテーション
- 地域別比較
- 北米:市場規模と予測 2023-2028
- 欧州:市場規模と予測 2023-2028
- アジア:市場規模と予測 2023-2028
- 世界のその他の地域:市場規模と予測 2023-2028
- 米国:市場規模と予測 2023-2028
- 英国:市場規模と予測 2023-2028
- ドイツ:市場規模と予測 2023-2028
- カナダ:市場規模と予測 2023-2028
- 中国:市場規模と予測 2023-2028
- 市場機会:地域情勢別
第10章 促進要因、課題、および動向
- 市場促進要因
- 市場の課題
- 促進要因と課題の影響
- 市場動向
第11章 ベンダー情勢
- 概要
- ベンダー情勢
- 混乱の状況
- 業界のリスク
第12章 ベンダー分析
- 対象ベンダー
- ベンダーの市場ポジショニング
- AstraZeneca PLC
- Caribou Biosciences Inc.
- Cellectis SA
- Cibus
- Danaher Corp.
- Editas Medicine Inc.
- Egenesis
- GenScript Biotech Corp.
- Horizon Discovery Ltd.
- Intellia Therapeutics Inc.
- Merck KGaA
- New England Biolabs Inc.
- Precision BioSciences Inc.
- Sangamo Therapeutics Inc.
- Takara Bio Inc.
第13章 付録
Exhibits:
- Exhibits1: Executive Summary - Chart on Market Overview
- Exhibits2: Executive Summary - Data Table on Market Overview
- Exhibits3: Executive Summary - Chart on Global Market Characteristics
- Exhibits4: Executive Summary - Chart on Market By Geographical Landscape
- Exhibits5: Executive Summary - Chart on Market Segmentation by End-user
- Exhibits6: Executive Summary - Chart on Market Segmentation by Delivery Mode
- Exhibits7: Executive Summary - Chart on Incremental Growth
- Exhibits8: Executive Summary - Data Table on Incremental Growth
- Exhibits9: Executive Summary - Chart on Vendor Market Positioning
- Exhibits10: Parent market
- Exhibits11: Market Characteristics
- Exhibits12: Offerings of vendors included in the market definition
- Exhibits13: Market segments
- Exhibits14: Chart on Global - Market size and forecast 2023-2028 ($ billion)
- Exhibits15: Data Table on Global - Market size and forecast 2023-2028 ($ billion)
- Exhibits16: Chart on Global Market: Year-over-year growth 2023-2028 (%)
- Exhibits17: Data Table on Global Market: Year-over-year growth 2023-2028 (%)
- Exhibits18: Historic Market Size - Data Table on global genome editing market 2018 - 2022 ($ billion)
- Exhibits19: Historic Market Size - End-user Segment 2018 - 2022 ($ billion)
- Exhibits20: Historic Market Size - Delivery mode Segment 2018 - 2022 ($ billion)
- Exhibits21: Historic Market Size - Geography Segment 2018 - 2022 ($ billion)
- Exhibits22: Historic Market Size - Country Segment 2018 - 2022 ($ billion)
- Exhibits23: Five forces analysis - Comparison between 2023 and 2028
- Exhibits24: Chart on Bargaining power of buyers - Impact of key factors 2023 and 2028
- Exhibits25: Bargaining power of suppliers - Impact of key factors in 2023 and 2028
- Exhibits26: Threat of new entrants - Impact of key factors in 2023 and 2028
- Exhibits27: Threat of substitutes - Impact of key factors in 2023 and 2028
- Exhibits28: Threat of rivalry - Impact of key factors in 2023 and 2028
- Exhibits29: Chart on Market condition - Five forces 2023 and 2028
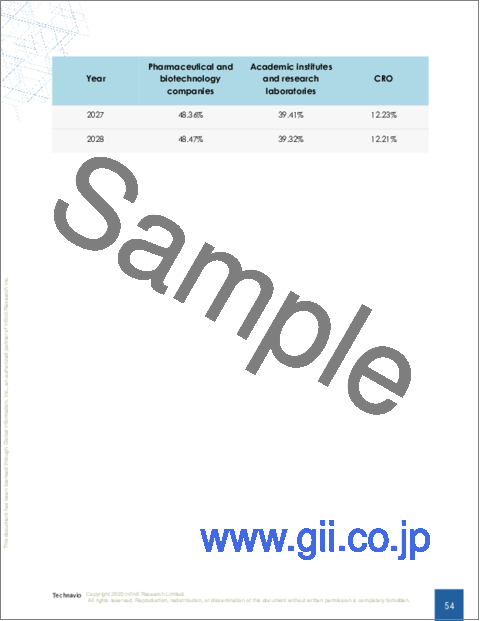
- Exhibits30: Chart on End-user - Market share 2023-2028 (%)
- Exhibits31: Data Table on End-user - Market share 2023-2028 (%)
- Exhibits32: Chart on Comparison by End-user
- Exhibits33: Data Table on Comparison by End-user
- Exhibits34: Chart on Pharmaceutical and biotechnology companies - Market size and forecast 2023-2028 ($ billion)
- Exhibits35: Data Table on Pharmaceutical and biotechnology companies - Market size and forecast 2023-2028 ($ billion)
- Exhibits36: Chart on Pharmaceutical and biotechnology companies - Year-over-year growth 2023-2028 (%)
- Exhibits37: Data Table on Pharmaceutical and biotechnology companies - Year-over-year growth 2023-2028 (%)
- Exhibits38: Chart on Academic institutes and research laboratories - Market size and forecast 2023-2028 ($ billion)
- Exhibits39: Data Table on Academic institutes and research laboratories - Market size and forecast 2023-2028 ($ billion)
- Exhibits40: Chart on Academic institutes and research laboratories - Year-over-year growth 2023-2028 (%)
- Exhibits41: Data Table on Academic institutes and research laboratories - Year-over-year growth 2023-2028 (%)
- Exhibits42: Chart on CRO - Market size and forecast 2023-2028 ($ billion)
- Exhibits43: Data Table on CRO - Market size and forecast 2023-2028 ($ billion)
- Exhibits44: Chart on CRO - Year-over-year growth 2023-2028 (%)
- Exhibits45: Data Table on CRO - Year-over-year growth 2023-2028 (%)
- Exhibits46: Market opportunity by End-user ($ billion)
- Exhibits47: Data Table on Market opportunity by End-user ($ billion)
- Exhibits48: Chart on Delivery Mode - Market share 2023-2028 (%)
- Exhibits49: Data Table on Delivery Mode - Market share 2023-2028 (%)
- Exhibits50: Chart on Comparison by Delivery Mode
- Exhibits51: Data Table on Comparison by Delivery Mode
- Exhibits52: Chart on Ex-vivo - Market size and forecast 2023-2028 ($ billion)
- Exhibits53: Data Table on Ex-vivo - Market size and forecast 2023-2028 ($ billion)
- Exhibits54: Chart on Ex-vivo - Year-over-year growth 2023-2028 (%)
- Exhibits55: Data Table on Ex-vivo - Year-over-year growth 2023-2028 (%)
- Exhibits56: Chart on In-vivo - Market size and forecast 2023-2028 ($ billion)
- Exhibits57: Data Table on In-vivo - Market size and forecast 2023-2028 ($ billion)
- Exhibits58: Chart on In-vivo - Year-over-year growth 2023-2028 (%)
- Exhibits59: Data Table on In-vivo - Year-over-year growth 2023-2028 (%)
- Exhibits60: Market opportunity by Delivery Mode ($ billion)
- Exhibits61: Data Table on Market opportunity by Delivery Mode ($ billion)
- Exhibits62: Analysis of price sensitivity, lifecycle, customer purchase basket, adoption rates, and purchase criteria
- Exhibits63: Chart on Market share By Geographical Landscape 2023-2028 (%)
- Exhibits64: Data Table on Market share By Geographical Landscape 2023-2028 (%)
- Exhibits65: Chart on Geographic comparison
- Exhibits66: Data Table on Geographic comparison
- Exhibits67: Chart on North America - Market size and forecast 2023-2028 ($ billion)
- Exhibits68: Data Table on North America - Market size and forecast 2023-2028 ($ billion)
- Exhibits69: Chart on North America - Year-over-year growth 2023-2028 (%)
- Exhibits70: Data Table on North America - Year-over-year growth 2023-2028 (%)
- Exhibits71: Chart on Europe - Market size and forecast 2023-2028 ($ billion)
- Exhibits72: Data Table on Europe - Market size and forecast 2023-2028 ($ billion)
- Exhibits73: Chart on Europe - Year-over-year growth 2023-2028 (%)
- Exhibits74: Data Table on Europe - Year-over-year growth 2023-2028 (%)
- Exhibits75: Chart on Asia - Market size and forecast 2023-2028 ($ billion)
- Exhibits76: Data Table on Asia - Market size and forecast 2023-2028 ($ billion)
- Exhibits77: Chart on Asia - Year-over-year growth 2023-2028 (%)
- Exhibits78: Data Table on Asia - Year-over-year growth 2023-2028 (%)
- Exhibits79: Chart on Rest of World (ROW) - Market size and forecast 2023-2028 ($ billion)
- Exhibits80: Data Table on Rest of World (ROW) - Market size and forecast 2023-2028 ($ billion)
- Exhibits81: Chart on Rest of World (ROW) - Year-over-year growth 2023-2028 (%)
- Exhibits82: Data Table on Rest of World (ROW) - Year-over-year growth 2023-2028 (%)
- Exhibits83: Chart on US - Market size and forecast 2023-2028 ($ billion)
- Exhibits84: Data Table on US - Market size and forecast 2023-2028 ($ billion)
- Exhibits85: Chart on US - Year-over-year growth 2023-2028 (%)
- Exhibits86: Data Table on US - Year-over-year growth 2023-2028 (%)
- Exhibits87: Chart on UK - Market size and forecast 2023-2028 ($ billion)
- Exhibits88: Data Table on UK - Market size and forecast 2023-2028 ($ billion)
- Exhibits89: Chart on UK - Year-over-year growth 2023-2028 (%)
- Exhibits90: Data Table on UK - Year-over-year growth 2023-2028 (%)
- Exhibits91: Chart on Germany - Market size and forecast 2023-2028 ($ billion)
- Exhibits92: Data Table on Germany - Market size and forecast 2023-2028 ($ billion)
- Exhibits93: Chart on Germany - Year-over-year growth 2023-2028 (%)
- Exhibits94: Data Table on Germany - Year-over-year growth 2023-2028 (%)
- Exhibits95: Chart on Canada - Market size and forecast 2023-2028 ($ billion)
- Exhibits96: Data Table on Canada - Market size and forecast 2023-2028 ($ billion)
- Exhibits97: Chart on Canada - Year-over-year growth 2023-2028 (%)
- Exhibits98: Data Table on Canada - Year-over-year growth 2023-2028 (%)
- Exhibits99: Chart on China - Market size and forecast 2023-2028 ($ billion)
- Exhibits100: Data Table on China - Market size and forecast 2023-2028 ($ billion)
- Exhibits101: Chart on China - Year-over-year growth 2023-2028 (%)
- Exhibits102: Data Table on China - Year-over-year growth 2023-2028 (%)
- Exhibits103: Market opportunity By Geographical Landscape ($ billion)
- Exhibits104: Data Tables on Market opportunity By Geographical Landscape ($ billion)
- Exhibits105: Impact of drivers and challenges in 2023 and 2028
- Exhibits106: Overview on Criticality of inputs and Factors of differentiation
- Exhibits107: Overview on factors of disruption
- Exhibits108: Impact of key risks on business
- Exhibits109: Vendors covered
- Exhibits110: Matrix on vendor position and classification
- Exhibits111: AstraZeneca PLC - Overview
- Exhibits112: AstraZeneca PLC - Product / Service
- Exhibits113: AstraZeneca PLC - Key news
- Exhibits114: AstraZeneca PLC - Key offerings
- Exhibits115: Caribou Biosciences Inc. - Overview
- Exhibits116: Caribou Biosciences Inc. - Product / Service
- Exhibits117: Caribou Biosciences Inc. - Key offerings
- Exhibits118: Cellectis SA - Overview
- Exhibits119: Cellectis SA - Product / Service
- Exhibits120: Cellectis SA - Key offerings
- Exhibits121: Cibus - Overview
- Exhibits122: Cibus - Product / Service
- Exhibits123: Cibus - Key offerings
- Exhibits124: Danaher Corp. - Overview
- Exhibits125: Danaher Corp. - Business segments
- Exhibits126: Danaher Corp. - Key news
- Exhibits127: Danaher Corp. - Key offerings
- Exhibits128: Danaher Corp. - Segment focus
- Exhibits129: Editas Medicine Inc. - Overview
- Exhibits130: Editas Medicine Inc. - Product / Service
- Exhibits131: Editas Medicine Inc. - Key offerings
- Exhibits132: Egenesis - Overview
- Exhibits133: Egenesis - Product / Service
- Exhibits134: Egenesis - Key offerings
- Exhibits135: GenScript Biotech Corp. - Overview
- Exhibits136: GenScript Biotech Corp. - Business segments
- Exhibits137: GenScript Biotech Corp. - Key offerings
- Exhibits138: GenScript Biotech Corp. - Segment focus
- Exhibits139: Horizon Discovery Ltd. - Overview
- Exhibits140: Horizon Discovery Ltd. - Business segments
- Exhibits141: Horizon Discovery Ltd. - Key offerings
- Exhibits142: Horizon Discovery Ltd. - Segment focus
- Exhibits143: Intellia Therapeutics Inc. - Overview
- Exhibits144: Intellia Therapeutics Inc. - Product / Service
- Exhibits145: Intellia Therapeutics Inc. - Key offerings
- Exhibits146: Merck KGaA - Overview
- Exhibits147: Merck KGaA - Business segments
- Exhibits148: Merck KGaA - Key news
- Exhibits149: Merck KGaA - Key offerings
- Exhibits150: Merck KGaA - Segment focus
- Exhibits151: New England Biolabs Inc. - Overview
- Exhibits152: New England Biolabs Inc. - Product / Service
- Exhibits153: New England Biolabs Inc. - Key news
- Exhibits154: New England Biolabs Inc. - Key offerings
- Exhibits155: Precision BioSciences Inc. - Overview
- Exhibits156: Precision BioSciences Inc. - Business segments
- Exhibits157: Precision BioSciences Inc. - Key offerings
- Exhibits158: Precision BioSciences Inc. - Segment focus
- Exhibits159: Sangamo Therapeutics Inc. - Overview
- Exhibits160: Sangamo Therapeutics Inc. - Product / Service
- Exhibits161: Sangamo Therapeutics Inc. - Key offerings
- Exhibits162: Takara Bio Inc. - Overview
- Exhibits163: Takara Bio Inc. - Business segments
- Exhibits164: Takara Bio Inc. - Key offerings
- Exhibits165: Takara Bio Inc. - Segment focus
- Exhibits166: Inclusions checklist
- Exhibits167: Exclusions checklist
- Exhibits168: Currency conversion rates for US$
- Exhibits169: Research methodology
- Exhibits170: Validation techniques employed for market sizing
- Exhibits171: Information sources
- Exhibits172: List of abbreviations
The genome editing market is forecasted to grow by USD 7.23 bn during 2023-2028, accelerating at a CAGR of 15.88% during the forecast period. The report on the genome editing market provides a holistic analysis, market size and forecast, trends, growth drivers, and challenges, as well as vendor analysis covering around 25 vendors.
The report offers an up-to-date analysis regarding the current market scenario, the latest trends and drivers, and the overall market environment. The market is driven by rapid technological advancements in genome editing, increasing demand for personalized medicine, and the emergence of novel gene editing platforms.
Technavio's genome editing market is segmented as below:
| Market Scope | |
|---|---|
| Base Year | 2024 |
| End Year | 2028 |
| Series Year | 2024-2028 |
| Growth Momentum | Accelerate |
| YOY 2024 | 14.56% |
| CAGR | 15.88% |
| Incremental Value | $7.23bn |
By End-user
- Pharmaceutical and biotechnology companies
- Academic institutes and research laboratories
- CRO
By Delivery Mode
- Ex-vivo
- In-vivo
By Geographical Landscape
- North America
- Europe
- Asia
- Rest of World (ROW)
This study identifies the rise of CRISPR-based diagnostics as one of the prime reasons driving the genome editing market growth during the next few years. Also, the growing integration of gene editing with AI and data analytics and increasing adoption of genome editing in agriculture and livestock will lead to sizable demand in the market.
The report on the genome editing market covers the following areas:
- Genome editing market sizing
- Genome editing market forecast
- Genome editing market industry analysis
The robust vendor analysis is designed to help clients improve their market position, and in line with this, this report provides a detailed analysis of several leading genome editing market vendors that include AstraZeneca PLC, Caribou Biosciences Inc., Cellectis SA, Cibus, Danaher Corp., Editas Medicine Inc., Egenesis, GenScript Biotech Corp., Horizon Discovery Ltd., Intellia Therapeutics Inc., Lonza Group Ltd., Merck KGaA, New England Biolabs Inc., OriGene Technologies Inc., PerkinElmer Inc, Precision BioSciences Inc., Sangamo Therapeutics Inc., Takara Bio Inc., Tecan Trading AG, and Thermo Fisher Scientific Inc.. Also, the genome editing market analysis report includes information on upcoming trends and challenges that will influence market growth. This is to help companies strategize and leverage all forthcoming growth opportunities.
The study was conducted using an objective combination of primary and secondary information including inputs from key participants in the industry. The report contains a comprehensive market and vendor landscape in addition to an analysis of the key vendors.
The publisher presents a detailed picture of the market by way of study, synthesis, and summation of data from multiple sources through an analysis of key parameters such as profit, pricing, competition, and promotions. It presents various market facets by identifying the key industry influencers. The data presented is comprehensive, reliable, and a result of extensive research - both primary and secondary. The market research reports provide a complete competitive landscape and an in-depth vendor selection methodology and analysis using qualitative and quantitative research to forecast accurate market growth.
Table of Contents
1 Executive Summary
- 1.1 Market overview
2 Market Landscape
- 2.1 Market ecosystem
3 Market Sizing
- 3.1 Market definition
- 3.2 Market segment analysis
- 3.3 Market size 2023
- 3.4 Market outlook: Forecast for 2023-2028
4 Historic Market Size
- 4.1 Global genome editing market 2018 - 2022
- 4.2 End-user Segment Analysis 2018 - 2022
- 4.3 Delivery mode Segment Analysis 2018 - 2022
- 4.4 Geography Segment Analysis 2018 - 2022
- 4.5 Country Segment Analysis 2018 - 2022
5 Five Forces Analysis
- 5.1 Five forces summary
- 5.2 Bargaining power of buyers
- 5.3 Bargaining power of suppliers
- 5.4 Threat of new entrants
- 5.5 Threat of substitutes
- 5.6 Threat of rivalry
- 5.7 Market condition
6 Market Segmentation by End-user
- 6.1 Market segments
- 6.2 Comparison by End-user
- 6.3 Pharmaceutical and biotechnology companies - Market size and forecast 2023-2028
- 6.4 Academic institutes and research laboratories - Market size and forecast 2023-2028
- 6.5 CRO - Market size and forecast 2023-2028
- 6.6 Market opportunity by End-user
7 Market Segmentation by Delivery Mode
- 7.1 Market segments
- 7.2 Comparison by Delivery Mode
- 7.3 Ex-vivo - Market size and forecast 2023-2028
- 7.4 In-vivo - Market size and forecast 2023-2028
- 7.5 Market opportunity by Delivery Mode
8 Customer Landscape
- 8.1 Customer landscape overview
9 Geographic Landscape
- 9.1 Geographic segmentation
- 9.2 Geographic comparison
- 9.3 North America - Market size and forecast 2023-2028
- 9.4 Europe - Market size and forecast 2023-2028
- 9.5 Asia - Market size and forecast 2023-2028
- 9.6 Rest of World (ROW) - Market size and forecast 2023-2028
- 9.7 US - Market size and forecast 2023-2028
- 9.8 UK - Market size and forecast 2023-2028
- 9.9 Germany - Market size and forecast 2023-2028
- 9.10 Canada - Market size and forecast 2023-2028
- 9.11 China - Market size and forecast 2023-2028
- 9.12 Market opportunity By Geographical Landscape
10 Drivers, Challenges, and Trends
- 10.1 Market drivers
- 10.2 Market challenges
- 10.3 Impact of drivers and challenges
- 10.4 Market trends
11 Vendor Landscape
- 11.1 Overview
- 11.2 Vendor landscape
- 11.3 Landscape disruption
- 11.4 Industry risks
12 Vendor Analysis
- 12.1 Vendors covered
- 12.2 Market positioning of vendors
- 12.3 AstraZeneca PLC
- 12.4 Caribou Biosciences Inc.
- 12.5 Cellectis SA
- 12.6 Cibus
- 12.7 Danaher Corp.
- 12.8 Editas Medicine Inc.
- 12.9 Egenesis
- 12.10 GenScript Biotech Corp.
- 12.11 Horizon Discovery Ltd.
- 12.12 Intellia Therapeutics Inc.
- 12.13 Merck KGaA
- 12.14 New England Biolabs Inc.
- 12.15 Precision BioSciences Inc.
- 12.16 Sangamo Therapeutics Inc.
- 12.17 Takara Bio Inc.
13 Appendix
- 13.1 Scope of the report
- 13.2 Inclusions and exclusions checklist
- 13.3 Currency conversion rates for US$
- 13.4 Research methodology
- 13.5 List of abbreviations

