|
|
市場調査レポート
商品コード
1462449
自動車用ステアリングトルクセンサの世界市場 2024-2028Global Automotive Steering Torque Sensor Market 2024-2028 |
||||||

|
|||||||
カスタマイズ可能
|
|||||||

| 自動車用ステアリングトルクセンサの世界市場 2024-2028 |
|
出版日: 2024年03月28日
発行: TechNavio
ページ情報: 英文 179 Pages
納期: 即納可能
|

全表示
- 概要
- 図表
- 目次
自動車用ステアリングトルクセンサ市場は2023-2028年に20億7,000万米ドル、予測期間中のCAGRは6.68%で成長すると予測されます。
当レポートでは、自動車用ステアリングトルクセンサ市場の全体的な分析、市場規模・予測、動向、成長促進要因、課題、約25のベンダーを網羅したベンダー分析などを掲載しています。
現在の市場シナリオ、最新動向と促進要因、市場環境全体に関する最新分析を提供しています。PVやLCVにおけるEPSシステムの高い普及率、自動車用ステアリングトルクセンサを求めるEV需要の増加、車両あたりの電子コンテンツの急速な増加などが市場を牽引しています。
| 市場範囲 | |
|---|---|
| 基準年 | 2024 |
| 終了年 | 2028 |
| 予測期間 | 2024-2028 |
| 成長モメンタム | 加速 |
| 前年比2024年 | 6.51% |
| CAGR | 6.68% |
| 増分額 | 20億7,000万米ドル |
本調査では、今後数年間の自動車用ステアリングトルクセンサ市場成長を牽引する主な要因の1つとして、新しく革新的なトルクセンサの登場を挙げています。また、トルクセンサにおけるワイヤレス接続やHCVにおける電動油圧パワーステアリングの需要の高まりは、市場の大きな需要につながります。
目次
第1章 エグゼクティブサマリー
- 市場概要
第2章 市場情勢
- 市場エコシステム
第3章 市場規模の評価
- 市場の定義
- 市場セグメント分析
- 市場規模 2023
- 市場の見通し 2023-2028
第4章 市場規模実績
- 自動車用ステアリングトルクセンサの世界市場 2018-2022
- 用途別セグメント分析 2018-2022
- タイプセグメント分析 2018-2022
- 地域別セグメント分析 2018-2022
- 国別セグメント分析 2018-2022
第5章 ファイブフォース分析
- ファイブフォースの要約
- 買い手の交渉力
- 供給企業の交渉力
- 新規参入業者の脅威
- 代替品の脅威
- 競争の脅威
- 市況
第6章 市場セグメンテーション:用途別
- 市場セグメント
- 比較:用途別
- 乗用車:市場規模と予測 2023-2028
- 商用車:市場規模と予測 2023-2028
- 市場機会:用途別
第7章 市場セグメンテーション:タイプ別
- 市場セグメント
- 比較:タイプ別
- 回転トルクセンサー:市場規模と予測 2023-2028
- 反応トルクセンサー:市場規模と予測 2023-2028
- 市場機会:タイプ別
第8章 顧客情勢
- 顧客情勢の概要
第9章 地域別情勢
- 地域別セグメンテーション
- 地域別比較
- アジア太平洋:市場規模と予測 2023-2028
- 欧州:市場規模と予測 2023-2028
- 北米:市場規模と予測 2023-2028
- 南米:市場規模と予測 2023-2028
- 中東・アフリカ:市場規模と予測 2023-2028
- 中国:市場規模と予測 2023-2028
- 日本:市場規模と予測 2023-2028
- インド:市場規模と予測 2023-2028
- 米国:市場規模と予測 2023-2028
- ドイツ:市場規模と予測 2023-2028
- 市場機会:地域情勢別
第10章 促進要因、課題、および動向
- 市場促進要因
- 市場の課題
- 促進要因と課題の影響
- 市場動向
第11章 ベンダー情勢
- 概要
- ベンダー情勢
- 混乱の状況
- 業界のリスク
第12章 ベンダー分析
- 対象ベンダー
- ベンダーの市場ポジショニング
- ABB Ltd.
- Advanced Micro Electronics Co. Ltd.
- AVL List GmbH
- Bourns Inc.
- DENSO Corp.
- FUTEK Advanced Sensor Technology Inc.
- HELLA GmbH and Co. KGaA
- Hitachi Ltd.
- Honeywell International Inc.
- Infineon Technologies AG
- Methode Electronics Inc.
- Novanta Inc.
- Robert Bosch GmbH
- TE Connectivity Ltd.
- Valeo SA
第13章 付録
Exhibits:
- Exhibits1: Executive Summary - Chart on Market Overview
- Exhibits2: Executive Summary - Data Table on Market Overview
- Exhibits3: Executive Summary - Chart on Global Market Characteristics
- Exhibits4: Executive Summary - Chart on Market By Geographical Landscape
- Exhibits5: Executive Summary - Chart on Market Segmentation by Application
- Exhibits6: Executive Summary - Chart on Market Segmentation by Type
- Exhibits7: Executive Summary - Chart on Incremental Growth
- Exhibits8: Executive Summary - Data Table on Incremental Growth
- Exhibits9: Executive Summary - Chart on Vendor Market Positioning
- Exhibits10: Parent market
- Exhibits11: Market Characteristics
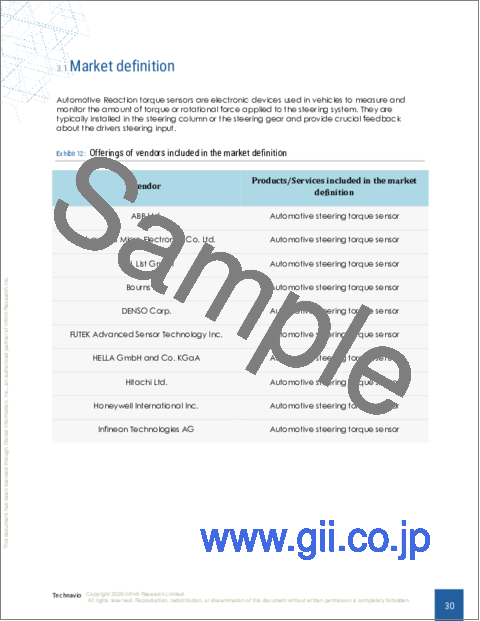
- Exhibits12: Offerings of vendors included in the market definition
- Exhibits13: Market segments
- Exhibits14: Chart on Global - Market size and forecast 2023-2028 ($ billion)
- Exhibits15: Data Table on Global - Market size and forecast 2023-2028 ($ billion)
- Exhibits16: Chart on Global Market: Year-over-year growth 2023-2028 (%)
- Exhibits17: Data Table on Global Market: Year-over-year growth 2023-2028 (%)
- Exhibits18: Historic Market Size - Data Table on global automotive steering torque sensor market 2018 - 2022 ($ billion)
- Exhibits19: Historic Market Size - Application Segment 2018 - 2022 ($ billion)
- Exhibits20: Historic Market Size - Type Segment 2018 - 2022 ($ billion)
- Exhibits21: Historic Market Size - Geography Segment 2018 - 2022 ($ billion)
- Exhibits22: Historic Market Size - Country Segment 2018 - 2022 ($ billion)
- Exhibits23: Five forces analysis - Comparison between 2023 and 2028
- Exhibits24: Chart on Bargaining power of buyers - Impact of key factors 2023 and 2028
- Exhibits25: Bargaining power of suppliers - Impact of key factors in 2023 and 2028
- Exhibits26: Threat of new entrants - Impact of key factors in 2023 and 2028
- Exhibits27: Threat of substitutes - Impact of key factors in 2023 and 2028
- Exhibits28: Threat of rivalry - Impact of key factors in 2023 and 2028
- Exhibits29: Chart on Market condition - Five forces 2023 and 2028
- Exhibits30: Chart on Application - Market share 2023-2028 (%)
- Exhibits31: Data Table on Application - Market share 2023-2028 (%)
- Exhibits32: Chart on Comparison by Application
- Exhibits33: Data Table on Comparison by Application
- Exhibits34: Chart on Passenger cars - Market size and forecast 2023-2028 ($ billion)
- Exhibits35: Data Table on Passenger cars - Market size and forecast 2023-2028 ($ billion)
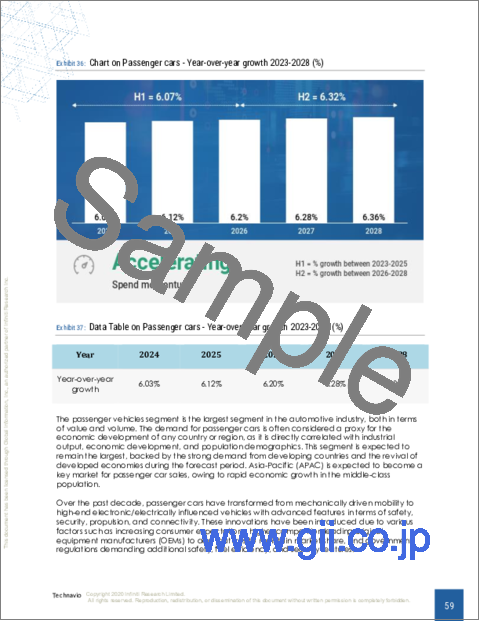
- Exhibits36: Chart on Passenger cars - Year-over-year growth 2023-2028 (%)
- Exhibits37: Data Table on Passenger cars - Year-over-year growth 2023-2028 (%)
- Exhibits38: Chart on Commercial vehicles - Market size and forecast 2023-2028 ($ billion)
- Exhibits39: Data Table on Commercial vehicles - Market size and forecast 2023-2028 ($ billion)
- Exhibits40: Chart on Commercial vehicles - Year-over-year growth 2023-2028 (%)
- Exhibits41: Data Table on Commercial vehicles - Year-over-year growth 2023-2028 (%)
- Exhibits42: Market opportunity by Application ($ billion)
- Exhibits43: Data Table on Market opportunity by Application ($ billion)
- Exhibits44: Chart on Type - Market share 2023-2028 (%)
- Exhibits45: Data Table on Type - Market share 2023-2028 (%)
- Exhibits46: Chart on Comparison by Type
- Exhibits47: Data Table on Comparison by Type
- Exhibits48: Chart on Rotary torque sensors - Market size and forecast 2023-2028 ($ billion)
- Exhibits49: Data Table on Rotary torque sensors - Market size and forecast 2023-2028 ($ billion)
- Exhibits50: Chart on Rotary torque sensors - Year-over-year growth 2023-2028 (%)
- Exhibits51: Data Table on Rotary torque sensors - Year-over-year growth 2023-2028 (%)
- Exhibits52: Chart on Reaction torque sensors - Market size and forecast 2023-2028 ($ billion)
- Exhibits53: Data Table on Reaction torque sensors - Market size and forecast 2023-2028 ($ billion)
- Exhibits54: Chart on Reaction torque sensors - Year-over-year growth 2023-2028 (%)
- Exhibits55: Data Table on Reaction torque sensors - Year-over-year growth 2023-2028 (%)
- Exhibits56: Market opportunity by Type ($ billion)
- Exhibits57: Data Table on Market opportunity by Type ($ billion)
- Exhibits58: Analysis of price sensitivity, lifecycle, customer purchase basket, adoption rates, and purchase criteria
- Exhibits59: Chart on Market share By Geographical Landscape 2023-2028 (%)
- Exhibits60: Data Table on Market share By Geographical Landscape 2023-2028 (%)
- Exhibits61: Chart on Geographic comparison
- Exhibits62: Data Table on Geographic comparison
- Exhibits63: Chart on APAC - Market size and forecast 2023-2028 ($ billion)
- Exhibits64: Data Table on APAC - Market size and forecast 2023-2028 ($ billion)
- Exhibits65: Chart on APAC - Year-over-year growth 2023-2028 (%)
- Exhibits66: Data Table on APAC - Year-over-year growth 2023-2028 (%)
- Exhibits67: Chart on Europe - Market size and forecast 2023-2028 ($ billion)
- Exhibits68: Data Table on Europe - Market size and forecast 2023-2028 ($ billion)
- Exhibits69: Chart on Europe - Year-over-year growth 2023-2028 (%)
- Exhibits70: Data Table on Europe - Year-over-year growth 2023-2028 (%)
- Exhibits71: Chart on North America - Market size and forecast 2023-2028 ($ billion)
- Exhibits72: Data Table on North America - Market size and forecast 2023-2028 ($ billion)
- Exhibits73: Chart on North America - Year-over-year growth 2023-2028 (%)
- Exhibits74: Data Table on North America - Year-over-year growth 2023-2028 (%)
- Exhibits75: Chart on South America - Market size and forecast 2023-2028 ($ billion)
- Exhibits76: Data Table on South America - Market size and forecast 2023-2028 ($ billion)
- Exhibits77: Chart on South America - Year-over-year growth 2023-2028 (%)
- Exhibits78: Data Table on South America - Year-over-year growth 2023-2028 (%)
- Exhibits79: Chart on Middle East and Africa - Market size and forecast 2023-2028 ($ billion)
- Exhibits80: Data Table on Middle East and Africa - Market size and forecast 2023-2028 ($ billion)
- Exhibits81: Chart on Middle East and Africa - Year-over-year growth 2023-2028 (%)
- Exhibits82: Data Table on Middle East and Africa - Year-over-year growth 2023-2028 (%)
- Exhibits83: Chart on China - Market size and forecast 2023-2028 ($ billion)
- Exhibits84: Data Table on China - Market size and forecast 2023-2028 ($ billion)
- Exhibits85: Chart on China - Year-over-year growth 2023-2028 (%)
- Exhibits86: Data Table on China - Year-over-year growth 2023-2028 (%)
- Exhibits87: Chart on Japan - Market size and forecast 2023-2028 ($ billion)
- Exhibits88: Data Table on Japan - Market size and forecast 2023-2028 ($ billion)
- Exhibits89: Chart on Japan - Year-over-year growth 2023-2028 (%)
- Exhibits90: Data Table on Japan - Year-over-year growth 2023-2028 (%)
- Exhibits91: Chart on India - Market size and forecast 2023-2028 ($ billion)
- Exhibits92: Data Table on India - Market size and forecast 2023-2028 ($ billion)
- Exhibits93: Chart on India - Year-over-year growth 2023-2028 (%)
- Exhibits94: Data Table on India - Year-over-year growth 2023-2028 (%)
- Exhibits95: Chart on US - Market size and forecast 2023-2028 ($ billion)
- Exhibits96: Data Table on US - Market size and forecast 2023-2028 ($ billion)
- Exhibits97: Chart on US - Year-over-year growth 2023-2028 (%)
- Exhibits98: Data Table on US - Year-over-year growth 2023-2028 (%)
- Exhibits99: Chart on Germany - Market size and forecast 2023-2028 ($ billion)
- Exhibits100: Data Table on Germany - Market size and forecast 2023-2028 ($ billion)
- Exhibits101: Chart on Germany - Year-over-year growth 2023-2028 (%)
- Exhibits102: Data Table on Germany - Year-over-year growth 2023-2028 (%)
- Exhibits103: Market opportunity By Geographical Landscape ($ billion)
- Exhibits104: Data Tables on Market opportunity By Geographical Landscape ($ billion)
- Exhibits105: Impact of drivers and challenges in 2023 and 2028
- Exhibits106: Overview on Criticality of inputs and Factors of differentiation
- Exhibits107: Overview on factors of disruption
- Exhibits108: Impact of key risks on business
- Exhibits109: Vendors covered
- Exhibits110: Matrix on vendor position and classification
- Exhibits111: ABB Ltd. - Overview
- Exhibits112: ABB Ltd. - Business segments
- Exhibits113: ABB Ltd. - Key news
- Exhibits114: ABB Ltd. - Key offerings
- Exhibits115: ABB Ltd. - Segment focus
- Exhibits116: Advanced Micro Electronics Co. Ltd. - Overview
- Exhibits117: Advanced Micro Electronics Co. Ltd. - Product / Service
- Exhibits118: Advanced Micro Electronics Co. Ltd. - Key offerings
- Exhibits119: AVL List GmbH - Overview
- Exhibits120: AVL List GmbH - Product / Service
- Exhibits121: AVL List GmbH - Key news
- Exhibits122: AVL List GmbH - Key offerings
- Exhibits123: Bourns Inc. - Overview
- Exhibits124: Bourns Inc. - Product / Service
- Exhibits125: Bourns Inc. - Key offerings
- Exhibits126: DENSO Corp. - Overview
- Exhibits127: DENSO Corp. - Business segments
- Exhibits128: DENSO Corp. - Key news
- Exhibits129: DENSO Corp. - Key offerings
- Exhibits130: DENSO Corp. - Segment focus
- Exhibits131: FUTEK Advanced Sensor Technology Inc. - Overview
- Exhibits132: FUTEK Advanced Sensor Technology Inc. - Product / Service
- Exhibits133: FUTEK Advanced Sensor Technology Inc. - Key offerings
- Exhibits134: HELLA GmbH and Co. KGaA - Overview
- Exhibits135: HELLA GmbH and Co. KGaA - Business segments
- Exhibits136: HELLA GmbH and Co. KGaA - Key news
- Exhibits137: HELLA GmbH and Co. KGaA - Key offerings
- Exhibits138: HELLA GmbH and Co. KGaA - Segment focus
- Exhibits139: Hitachi Ltd. - Overview
- Exhibits140: Hitachi Ltd. - Business segments
- Exhibits141: Hitachi Ltd. - Key news
- Exhibits142: Hitachi Ltd. - Key offerings
- Exhibits143: Hitachi Ltd. - Segment focus
- Exhibits144: Honeywell International Inc. - Overview
- Exhibits145: Honeywell International Inc. - Business segments
- Exhibits146: Honeywell International Inc. - Key news
- Exhibits147: Honeywell International Inc. - Key offerings
- Exhibits148: Honeywell International Inc. - Segment focus
- Exhibits149: Infineon Technologies AG - Overview
- Exhibits150: Infineon Technologies AG - Business segments
- Exhibits151: Infineon Technologies AG - Key news
- Exhibits152: Infineon Technologies AG - Key offerings
- Exhibits153: Infineon Technologies AG - Segment focus
- Exhibits154: Methode Electronics Inc. - Overview
- Exhibits155: Methode Electronics Inc. - Business segments
- Exhibits156: Methode Electronics Inc. - Key offerings
- Exhibits157: Methode Electronics Inc. - Segment focus
- Exhibits158: Novanta Inc. - Overview
- Exhibits159: Novanta Inc. - Business segments
- Exhibits160: Novanta Inc. - Key offerings
- Exhibits161: Novanta Inc. - Segment focus
- Exhibits162: Robert Bosch GmbH - Overview
- Exhibits163: Robert Bosch GmbH - Business segments
- Exhibits164: Robert Bosch GmbH - Key news
- Exhibits165: Robert Bosch GmbH - Key offerings
- Exhibits166: Robert Bosch GmbH - Segment focus
- Exhibits167: TE Connectivity Ltd. - Overview
- Exhibits168: TE Connectivity Ltd. - Business segments
- Exhibits169: TE Connectivity Ltd. - Key news
- Exhibits170: TE Connectivity Ltd. - Key offerings
- Exhibits171: TE Connectivity Ltd. - Segment focus
- Exhibits172: Valeo SA - Overview
- Exhibits173: Valeo SA - Business segments
- Exhibits174: Valeo SA - Key news
- Exhibits175: Valeo SA - Key offerings
- Exhibits176: Valeo SA - Segment focus
- Exhibits177: Inclusions checklist
- Exhibits178: Exclusions checklist
- Exhibits179: Currency conversion rates for US$
- Exhibits180: Research methodology
- Exhibits181: Validation techniques employed for market sizing
- Exhibits182: Information sources
- Exhibits183: List of abbreviations
The automotive steering torque sensor market is forecasted to grow by USD 2.07 bn during 2023-2028, accelerating at a CAGR of 6.68% during the forecast period. The report on the automotive steering torque sensor market provides a holistic analysis, market size and forecast, trends, growth drivers, and challenges, as well as vendor analysis covering around 25 vendors.
The report offers an up-to-date analysis regarding the current market scenario, the latest trends and drivers, and the overall market environment. The market is driven by high penetration of EPS system in PVs and LCVs, increasing demand for EVs demanding automotive steering torque sensor, and rapidly increasing electronic content per vehicle.
Technavio's automotive steering torque sensor market is segmented as below:
| Market Scope | |
|---|---|
| Base Year | 2024 |
| End Year | 2028 |
| Series Year | 2024-2028 |
| Growth Momentum | Accelerate |
| YOY 2024 | 6.51% |
| CAGR | 6.68% |
| Incremental Value | $2.07bn |
By Application
- Passenger cars
- Commercial vehicles
By Type
- Rotary torque sensors
- Reaction torque sensors
By Geographical Landscape
- APAC
- Europe
- North America
- South America
- Middle East and Africa
This study identifies the advent of new and innovative torque sensors as one of the prime reasons driving the automotive steering torque sensor market growth during the next few years. Also, rise in demand for wireless connectivity in torque sensors and electrohydraulic power steering in hcvs will lead to sizable demand in the market.
The report on the automotive steering torque sensor market covers the following areas:
- Automotive steering torque sensor market sizing
- Automotive steering torque sensor market forecast
- Automotive steering torque sensor market industry analysis
The robust vendor analysis is designed to help clients improve their market position, and in line with this, this report provides a detailed analysis of several leading automotive steering torque sensor market vendors that include ABB Ltd., Advanced Micro Electronics Co. Ltd., AVL List GmbH, Bourns Inc., DENSO Corp., Eltek Systems, FUTEK Advanced Sensor Technology Inc., HELLA GmbH and Co. KGaA, Hitachi Ltd., Honeywell International Inc., Hottinger Bruel and Kjaer GmbH, Infineon Technologies AG, Kistler Holding AG, Methode Electronics Inc., Novanta Inc., Racelogic, Robert Bosch GmbH, SENSOTEC INSTRUMENTS S.A, TE Connectivity Ltd., and Valeo SA. Also, the automotive steering torque sensor market analysis report includes information on upcoming trends and challenges that will influence market growth. This is to help companies strategize and leverage all forthcoming growth opportunities.
The study was conducted using an objective combination of primary and secondary information including inputs from key participants in the industry. The report contains a comprehensive market and vendor landscape in addition to an analysis of the key vendors.
The publisher presents a detailed picture of the market by the way of study, synthesis, and summation of data from multiple sources by an analysis of key parameters such as profit, pricing, competition, and promotions. It presents various market facets by identifying the key industry influencers. The data presented is comprehensive, reliable, and a result of extensive research - both primary and secondary. The market research reports provide a complete competitive landscape and an in-depth vendor selection methodology and analysis using qualitative and quantitative research to forecast the accurate market growth.
Table of Contents
1 Executive Summary
- 1.1 Market overview
2 Market Landscape
- 2.1 Market ecosystem
3 Market Sizing
- 3.1 Market definition
- 3.2 Market segment analysis
- 3.3 Market size 2023
- 3.4 Market outlook: Forecast for 2023-2028
4 Historic Market Size
- 4.1 Global automotive steering torque sensor market 2018 - 2022
- 4.2 Application Segment Analysis 2018 - 2022
- 4.3 Type Segment Analysis 2018 - 2022
- 4.4 Geography Segment Analysis 2018 - 2022
- 4.5 Country Segment Analysis 2018 - 2022
5 Five Forces Analysis
- 5.1 Five forces summary
- 5.2 Bargaining power of buyers
- 5.3 Bargaining power of suppliers
- 5.4 Threat of new entrants
- 5.5 Threat of substitutes
- 5.6 Threat of rivalry
- 5.7 Market condition
6 Market Segmentation by Application
- 6.1 Market segments
- 6.2 Comparison by Application
- 6.3 Passenger cars - Market size and forecast 2023-2028
- 6.4 Commercial vehicles - Market size and forecast 2023-2028
- 6.5 Market opportunity by Application
7 Market Segmentation by Type
- 7.1 Market segments
- 7.2 Comparison by Type
- 7.3 Rotary torque sensors - Market size and forecast 2023-2028
- 7.4 Reaction torque sensors - Market size and forecast 2023-2028
- 7.5 Market opportunity by Type
8 Customer Landscape
- 8.1 Customer landscape overview
9 Geographic Landscape
- 9.1 Geographic segmentation
- 9.2 Geographic comparison
- 9.3 APAC - Market size and forecast 2023-2028
- 9.4 Europe - Market size and forecast 2023-2028
- 9.5 North America - Market size and forecast 2023-2028
- 9.6 South America - Market size and forecast 2023-2028
- 9.7 Middle East and Africa - Market size and forecast 2023-2028
- 9.8 China - Market size and forecast 2023-2028
- 9.9 Japan - Market size and forecast 2023-2028
- 9.10 India - Market size and forecast 2023-2028
- 9.11 US - Market size and forecast 2023-2028
- 9.12 Germany - Market size and forecast 2023-2028
- 9.13 Market opportunity By Geographical Landscape
10 Drivers, Challenges, and Trends
- 10.1 Market drivers
- 10.2 Market challenges
- 10.3 Impact of drivers and challenges
- 10.4 Market trends
11 Vendor Landscape
- 11.1 Overview
- 11.2 Vendor landscape
- 11.3 Landscape disruption
- 11.4 Industry risks
12 Vendor Analysis
- 12.1 Vendors covered
- 12.2 Market positioning of vendors
- 12.3 ABB Ltd.
- 12.4 Advanced Micro Electronics Co. Ltd.
- 12.5 AVL List GmbH
- 12.6 Bourns Inc.
- 12.7 DENSO Corp.
- 12.8 FUTEK Advanced Sensor Technology Inc.
- 12.9 HELLA GmbH and Co. KGaA
- 12.10 Hitachi Ltd.
- 12.11 Honeywell International Inc.
- 12.12 Infineon Technologies AG
- 12.13 Methode Electronics Inc.
- 12.14 Novanta Inc.
- 12.15 Robert Bosch GmbH
- 12.16 TE Connectivity Ltd.
- 12.17 Valeo SA
13 Appendix
- 13.1 Scope of the report
- 13.2 Inclusions and exclusions checklist
- 13.3 Currency conversion rates for US$
- 13.4 Research methodology
- 13.5 List of abbreviations

