|
|
市場調査レポート
商品コード
1459483
不飽和ポリエステル樹脂の世界市場 2024-2028Global Unsaturated Polyester Resins Market 2024-2028 |
||||||
|
|||||||
カスタマイズ可能
|
|||||||

| 不飽和ポリエステル樹脂の世界市場 2024-2028 |
|
出版日: 2024年03月19日
発行: TechNavio
ページ情報: 英文 179 Pages
納期: 即納可能
|

全表示
- 概要
- 図表
- 目次
不飽和ポリエステル樹脂市場は2023-2028年に39億9,000万米ドル、予測期間中のCAGRは6.32%で成長すると予測されます。
当レポートでは、不飽和ポリエステル樹脂市場の全体的な分析、市場規模・予測、動向、成長促進要因、課題、約25のベンダーを網羅したベンダー分析などを掲載しています。
現在の市場シナリオ、最新動向と促進要因、市場環境全体に関する最新分析を提供しています。市場は、最終用途産業における成長の増加、不飽和ポリエステル樹脂の他の樹脂に対する特性の向上、不飽和ポリエステル樹脂の使用を求める環境に優しい製品へのシフトの高まりによって牽引されています。
| 市場範囲 | |
|---|---|
| 基準年 | 2024 |
| 終了年 | 2028 |
| 予測期間 | 2024-2028 |
| 成長モメンタム | 加速 |
| 前年比2024年 | 5.85% |
| CAGR | 6.32% |
| 増分額 | 39億9,000万米ドル |
本調査では、新興経済諸国におけるインフラ開発が、今後数年間の不飽和ポリエステル樹脂市場成長を牽引する主要因の1つであると分析しています。また、3Dプリンティングなどの先進的な製造プロセスの採用や、風力発電設備の増加に伴う不飽和ポリエステル樹脂の需要増加が、市場の大きな需要につながります。
目次
第1章 エグゼクティブサマリー
- 市場概要
第2章 市場情勢
- 市場エコシステム
第3章 市場規模の評価
- 市場の定義
- 市場セグメント分析
- 市場規模 2023
- 市場の見通し 2023-2028
第4章 市場規模実績
- 不飽和ポリエステル樹脂の世界市場 2018-2022
- タイプセグメント分析 2018-2022
- エンドユーザーセグメント分析 2018-2022
- 国別セグメント分析 2018-2022
第5章 ファイブフォース分析
- ファイブフォースの要約
- 買い手の交渉力
- 供給企業の交渉力
- 新規参入業者の脅威
- 代替品の脅威
- 競争の脅威
- 市況
第6章 市場セグメンテーション:タイプ別
- 市場セグメント
- 比較:タイプ別
- オルトフタル酸:市場規模と予測 2023-2028
- DCPD樹脂:市場規模と予測 2023-2028
- イソフタル酸:市場規模と予測 2023-2028
- その他:市場規模と予測 2023-2028
- 市場機会:タイプ別
第7章 市場セグメンテーション:エンドユーザー別
- 市場セグメント
- 比較:エンドユーザー別
- 建築・建設:市場規模と予測 2023-2028
- パイプとタンク:市場規模と予測 2023-2028
- 自動車:市場規模と予測 2023-2028
- 海洋:市場規模と予測 2023-2028
- 電気その他:市場規模と予測 2023-2028
- 市場機会:エンドユーザー別
第8章 顧客情勢
- 顧客情勢の概要
第9章 地域別情勢
- 地域別セグメンテーション
- 地域別比較
- アジア太平洋:市場規模と予測 2023-2028
- 北米:市場規模と予測 2023-2028
- 欧州:市場規模と予測 2023-2028
- 中東・アフリカ:市場規模と予測 2023-2028
- 南米:市場規模と予測 2023-2028
- 米国:市場規模と予測 2023-2028
- 中国:市場規模と予測 2023-2028
- 日本:市場規模と予測 2023-2028
- ドイツ:市場規模と予測 2023-2028
- インド:市場規模と予測 2023-2028
- 市場機会:地域情勢別
第10章 促進要因、課題、および動向
- 市場促進要因
- 市場の課題
- 促進要因と課題の影響
- 市場動向
第11章 ベンダー情勢
- 概要
- ベンダー情勢
- 混乱の状況
- 業界のリスク
第12章 ベンダー分析
- 対象ベンダー
- ベンダーの市場ポジショニング
- Allnex GMBH
- Ashland Inc.
- BASF SE
- Covestro AG
- Dow Chemical Co.
- Eternal Materials Co. Ltd.
- Evergreen Chemicals Co. Ltd.
- Huizhou GoodUPR Compites Ltd.
- INEOS AG
- Mitsubishi Gas Chemical Co. Inc.
- Polynt Spa
- Revex Plasticisers Pvt. Ltd.
- Swancor Holding Co. Ltd.
- UPC Technology Corp.
第13章 付録
Exhibits:
- Exhibits1: Executive Summary - Chart on Market Overview
- Exhibits2: Executive Summary - Data Table on Market Overview
- Exhibits3: Executive Summary - Chart on Global Market Characteristics
- Exhibits4: Executive Summary - Chart on Market By Geographical Landscape
- Exhibits5: Executive Summary - Chart on Market Segmentation by Type
- Exhibits6: Executive Summary - Chart on Market Segmentation by End-user
- Exhibits7: Executive Summary - Chart on Incremental Growth
- Exhibits8: Executive Summary - Data Table on Incremental Growth
- Exhibits9: Executive Summary - Chart on Vendor Market Positioning
- Exhibits10: Parent market
- Exhibits11: Market Characteristics
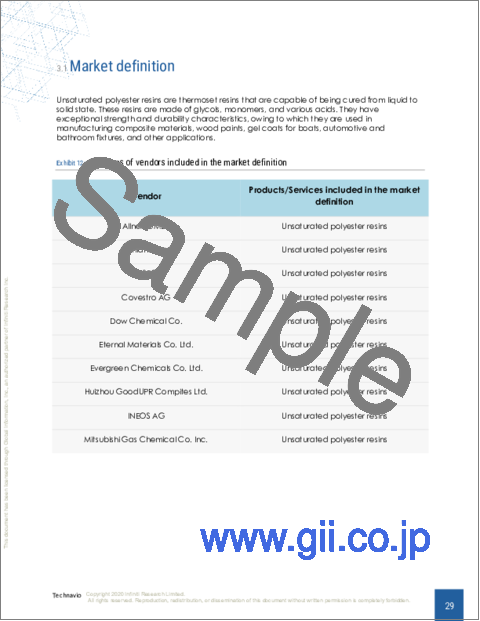
- Exhibits12: Offerings of vendors included in the market definition
- Exhibits13: Market segments
- Exhibits14: Chart on Global - Market size and forecast 2023-2028 ($ billion)
- Exhibits15: Data Table on Global - Market size and forecast 2023-2028 ($ billion)
- Exhibits16: Chart on Global Market: Year-over-year growth 2023-2028 (%)
- Exhibits17: Data Table on Global Market: Year-over-year growth 2023-2028 (%)
- Exhibits18: Historic Market Size - Data Table on global unsaturated polyester resins market 2018 - 2022 ($ billion)
- Exhibits19: Historic Market Size - Type Segment 2018 - 2022 ($ billion)
- Exhibits20: Historic Market Size - End-user Segment 2018 - 2022 ($ billion)
- Exhibits21: Historic Market Size - Country Segment 2018 - 2022 ($ billion)
- Exhibits22: Five forces analysis - Comparison between 2023 and 2028
- Exhibits23: Chart on Bargaining power of buyers - Impact of key factors 2023 and 2028
- Exhibits24: Bargaining power of suppliers - Impact of key factors in 2023 and 2028
- Exhibits25: Threat of new entrants - Impact of key factors in 2023 and 2028
- Exhibits26: Threat of substitutes - Impact of key factors in 2023 and 2028
- Exhibits27: Threat of rivalry - Impact of key factors in 2023 and 2028
- Exhibits28: Chart on Market condition - Five forces 2023 and 2028
- Exhibits29: Chart on Type - Market share 2023-2028 (%)
- Exhibits30: Data Table on Type - Market share 2023-2028 (%)
- Exhibits31: Chart on Comparison by Type
- Exhibits32: Data Table on Comparison by Type
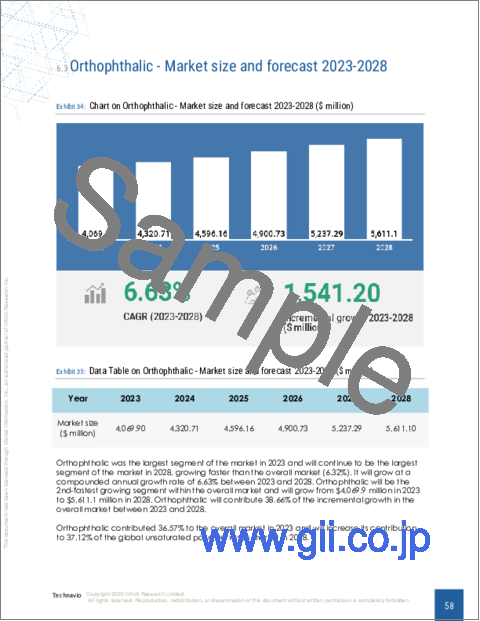
- Exhibits33: Chart on Orthophthalic - Market size and forecast 2023-2028 ($ billion)
- Exhibits34: Data Table on Orthophthalic - Market size and forecast 2023-2028 ($ billion)
- Exhibits35: Chart on Orthophthalic - Year-over-year growth 2023-2028 (%)
- Exhibits36: Data Table on Orthophthalic - Year-over-year growth 2023-2028 (%)
- Exhibits37: Chart on DCPD - Market size and forecast 2023-2028 ($ billion)
- Exhibits38: Data Table on DCPD - Market size and forecast 2023-2028 ($ billion)
- Exhibits39: Chart on DCPD - Year-over-year growth 2023-2028 (%)
- Exhibits40: Data Table on DCPD - Year-over-year growth 2023-2028 (%)
- Exhibits41: Chart on Isophthalic - Market size and forecast 2023-2028 ($ billion)
- Exhibits42: Data Table on Isophthalic - Market size and forecast 2023-2028 ($ billion)
- Exhibits43: Chart on Isophthalic - Year-over-year growth 2023-2028 (%)
- Exhibits44: Data Table on Isophthalic - Year-over-year growth 2023-2028 (%)
- Exhibits45: Chart on Others - Market size and forecast 2023-2028 ($ billion)
- Exhibits46: Data Table on Others - Market size and forecast 2023-2028 ($ billion)
- Exhibits47: Chart on Others - Year-over-year growth 2023-2028 (%)
- Exhibits48: Data Table on Others - Year-over-year growth 2023-2028 (%)
- Exhibits49: Market opportunity by Type ($ billion)
- Exhibits50: Data Table on Market opportunity by Type ($ billion)
- Exhibits51: Chart on End-user - Market share 2023-2028 (%)
- Exhibits52: Data Table on End-user - Market share 2023-2028 (%)
- Exhibits53: Chart on Comparison by End-user
- Exhibits54: Data Table on Comparison by End-user
- Exhibits55: Chart on Building and construction - Market size and forecast 2023-2028 ($ billion)
- Exhibits56: Data Table on Building and construction - Market size and forecast 2023-2028 ($ billion)
- Exhibits57: Chart on Building and construction - Year-over-year growth 2023-2028 (%)
- Exhibits58: Data Table on Building and construction - Year-over-year growth 2023-2028 (%)
- Exhibits59: Chart on Pipes and tanks - Market size and forecast 2023-2028 ($ billion)
- Exhibits60: Data Table on Pipes and tanks - Market size and forecast 2023-2028 ($ billion)
- Exhibits61: Chart on Pipes and tanks - Year-over-year growth 2023-2028 (%)
- Exhibits62: Data Table on Pipes and tanks - Year-over-year growth 2023-2028 (%)
- Exhibits63: Chart on Automotive - Market size and forecast 2023-2028 ($ billion)
- Exhibits64: Data Table on Automotive - Market size and forecast 2023-2028 ($ billion)
- Exhibits65: Chart on Automotive - Year-over-year growth 2023-2028 (%)
- Exhibits66: Data Table on Automotive - Year-over-year growth 2023-2028 (%)
- Exhibits67: Chart on Marine - Market size and forecast 2023-2028 ($ billion)
- Exhibits68: Data Table on Marine - Market size and forecast 2023-2028 ($ billion)
- Exhibits69: Chart on Marine - Year-over-year growth 2023-2028 (%)
- Exhibits70: Data Table on Marine - Year-over-year growth 2023-2028 (%)
- Exhibits71: Chart on Electrical and others - Market size and forecast 2023-2028 ($ billion)
- Exhibits72: Data Table on Electrical and others - Market size and forecast 2023-2028 ($ billion)
- Exhibits73: Chart on Electrical and others - Year-over-year growth 2023-2028 (%)
- Exhibits74: Data Table on Electrical and others - Year-over-year growth 2023-2028 (%)
- Exhibits75: Market opportunity by End-user ($ billion)
- Exhibits76: Data Table on Market opportunity by End-user ($ billion)
- Exhibits77: Analysis of price sensitivity, lifecycle, customer purchase basket, adoption rates, and purchase criteria
- Exhibits78: Chart on Market share By Geographical Landscape 2023-2028 (%)
- Exhibits79: Data Table on Market share By Geographical Landscape 2023-2028 (%)
- Exhibits80: Chart on Geographic comparison
- Exhibits81: Data Table on Geographic comparison
- Exhibits82: Chart on APAC - Market size and forecast 2023-2028 ($ billion)
- Exhibits83: Data Table on APAC - Market size and forecast 2023-2028 ($ billion)
- Exhibits84: Chart on APAC - Year-over-year growth 2023-2028 (%)
- Exhibits85: Data Table on APAC - Year-over-year growth 2023-2028 (%)
- Exhibits86: Chart on North America - Market size and forecast 2023-2028 ($ billion)
- Exhibits87: Data Table on North America - Market size and forecast 2023-2028 ($ billion)
- Exhibits88: Chart on North America - Year-over-year growth 2023-2028 (%)
- Exhibits89: Data Table on North America - Year-over-year growth 2023-2028 (%)
- Exhibits90: Chart on Europe - Market size and forecast 2023-2028 ($ billion)
- Exhibits91: Data Table on Europe - Market size and forecast 2023-2028 ($ billion)
- Exhibits92: Chart on Europe - Year-over-year growth 2023-2028 (%)
- Exhibits93: Data Table on Europe - Year-over-year growth 2023-2028 (%)
- Exhibits94: Chart on Middle East and Africa - Market size and forecast 2023-2028 ($ billion)
- Exhibits95: Data Table on Middle East and Africa - Market size and forecast 2023-2028 ($ billion)
- Exhibits96: Chart on Middle East and Africa - Year-over-year growth 2023-2028 (%)
- Exhibits97: Data Table on Middle East and Africa - Year-over-year growth 2023-2028 (%)
- Exhibits98: Chart on South America - Market size and forecast 2023-2028 ($ billion)
- Exhibits99: Data Table on South America - Market size and forecast 2023-2028 ($ billion)
- Exhibits100: Chart on South America - Year-over-year growth 2023-2028 (%)
- Exhibits101: Data Table on South America - Year-over-year growth 2023-2028 (%)
- Exhibits102: Chart on US - Market size and forecast 2023-2028 ($ billion)
- Exhibits103: Data Table on US - Market size and forecast 2023-2028 ($ billion)
- Exhibits104: Chart on US - Year-over-year growth 2023-2028 (%)
- Exhibits105: Data Table on US - Year-over-year growth 2023-2028 (%)
- Exhibits106: Chart on China - Market size and forecast 2023-2028 ($ billion)
- Exhibits107: Data Table on China - Market size and forecast 2023-2028 ($ billion)
- Exhibits108: Chart on China - Year-over-year growth 2023-2028 (%)
- Exhibits109: Data Table on China - Year-over-year growth 2023-2028 (%)
- Exhibits110: Chart on Japan - Market size and forecast 2023-2028 ($ billion)
- Exhibits111: Data Table on Japan - Market size and forecast 2023-2028 ($ billion)
- Exhibits112: Chart on Japan - Year-over-year growth 2023-2028 (%)
- Exhibits113: Data Table on Japan - Year-over-year growth 2023-2028 (%)
- Exhibits114: Chart on Germany - Market size and forecast 2023-2028 ($ billion)
- Exhibits115: Data Table on Germany - Market size and forecast 2023-2028 ($ billion)
- Exhibits116: Chart on Germany - Year-over-year growth 2023-2028 (%)
- Exhibits117: Data Table on Germany - Year-over-year growth 2023-2028 (%)
- Exhibits118: Chart on India - Market size and forecast 2023-2028 ($ billion)
- Exhibits119: Data Table on India - Market size and forecast 2023-2028 ($ billion)
- Exhibits120: Chart on India - Year-over-year growth 2023-2028 (%)
- Exhibits121: Data Table on India - Year-over-year growth 2023-2028 (%)
- Exhibits122: Market opportunity By Geographical Landscape ($ billion)
- Exhibits123: Data Tables on Market opportunity By Geographical Landscape ($ billion)
- Exhibits124: Impact of drivers and challenges in 2023 and 2028
- Exhibits125: Overview on Criticality of inputs and Factors of differentiation
- Exhibits126: Overview on factors of disruption
- Exhibits127: Impact of key risks on business
- Exhibits128: Vendors covered
- Exhibits129: Matrix on vendor position and classification
- Exhibits130: Allnex GMBH - Overview
- Exhibits131: Allnex GMBH - Product / Service
- Exhibits132: Allnex GMBH - Key news
- Exhibits133: Allnex GMBH - Key offerings
- Exhibits134: Ashland Inc. - Overview
- Exhibits135: Ashland Inc. - Business segments
- Exhibits136: Ashland Inc. - Key news
- Exhibits137: Ashland Inc. - Key offerings
- Exhibits138: Ashland Inc. - Segment focus
- Exhibits139: BASF SE - Overview
- Exhibits140: BASF SE - Business segments
- Exhibits141: BASF SE - Key news
- Exhibits142: BASF SE - Key offerings
- Exhibits143: BASF SE - Segment focus
- Exhibits144: Covestro AG - Overview
- Exhibits145: Covestro AG - Business segments
- Exhibits146: Covestro AG - Key news
- Exhibits147: Covestro AG - Key offerings
- Exhibits148: Covestro AG - Segment focus
- Exhibits149: Dow Chemical Co. - Overview
- Exhibits150: Dow Chemical Co. - Business segments
- Exhibits151: Dow Chemical Co. - Key news
- Exhibits152: Dow Chemical Co. - Key offerings
- Exhibits153: Dow Chemical Co. - Segment focus
- Exhibits154: Eternal Materials Co. Ltd. - Overview
- Exhibits155: Eternal Materials Co. Ltd. - Business segments
- Exhibits156: Eternal Materials Co. Ltd. - Key offerings
- Exhibits157: Eternal Materials Co. Ltd. - Segment focus
- Exhibits158: Evergreen Chemicals Co. Ltd. - Overview
- Exhibits159: Evergreen Chemicals Co. Ltd. - Product / Service
- Exhibits160: Evergreen Chemicals Co. Ltd. - Key offerings
- Exhibits161: Huizhou GoodUPR Compites Ltd. - Overview
- Exhibits162: Huizhou GoodUPR Compites Ltd. - Product / Service
- Exhibits163: Huizhou GoodUPR Compites Ltd. - Key offerings
- Exhibits164: INEOS AG - Overview
- Exhibits165: INEOS AG - Product / Service
- Exhibits166: INEOS AG - Key offerings
- Exhibits167: Mitsubishi Gas Chemical Co. Inc. - Overview
- Exhibits168: Mitsubishi Gas Chemical Co. Inc. - Business segments
- Exhibits169: Mitsubishi Gas Chemical Co. Inc. - Key offerings
- Exhibits170: Mitsubishi Gas Chemical Co. Inc. - Segment focus
- Exhibits171: Polynt Spa - Overview
- Exhibits172: Polynt Spa - Product / Service
- Exhibits173: Polynt Spa - Key offerings
- Exhibits174: Revex Plasticisers Pvt. Ltd. - Overview
- Exhibits175: Revex Plasticisers Pvt. Ltd. - Product / Service
- Exhibits176: Revex Plasticisers Pvt. Ltd. - Key offerings
- Exhibits177: Swancor Holding Co. Ltd. - Overview
- Exhibits178: Swancor Holding Co. Ltd. - Product / Service
- Exhibits179: Swancor Holding Co. Ltd. - Key offerings
- Exhibits180: UPC Technology Corp. - Overview
- Exhibits181: UPC Technology Corp. - Business segments
- Exhibits182: UPC Technology Corp. - Key offerings
- Exhibits183: UPC Technology Corp. - Segment focus
- Exhibits184: Inclusions checklist
- Exhibits185: Exclusions checklist
- Exhibits186: Currency conversion rates for US$
- Exhibits187: Research methodology
- Exhibits188: Validation techniques employed for market sizing
- Exhibits189: Information sources
- Exhibits190: List of abbreviations
The unsaturated polyester resins market is forecasted to grow by USD 3.99 bn during 2023-2028, accelerating at a CAGR of 6.32% during the forecast period. The report on the unsaturated polyester resins market provides a holistic analysis, market size and forecast, trends, growth drivers, and challenges, as well as vendor analysis covering around 25 vendors.
The report offers an up-to-date analysis regarding the current market scenario, the latest trends and drivers, and the overall market environment. The market is driven by increasing growth in end-use industries, improved properties of unsaturated polyester resins over other resins, and growing shift toward eco-friendly products demanding use of unsaturated polyester resins.
Technavio's unsaturated polyester resins market is segmented as below:
| Market Scope | |
|---|---|
| Base Year | 2024 |
| End Year | 2028 |
| Series Year | 2024-2028 |
| Growth Momentum | Accelerate |
| YOY 2024 | 5.85% |
| CAGR | 6.32% |
| Incremental Value | $3.99bn |
By Type
- Orthophthalic
- DCPD
- Isophthalic
- Others
By End-user
- Building and construction
- Pipes and tanks
- Automotive
- Marine
- Electrical and others
By Geographical Landscape
- APAC
- North America
- Europe
- Middle East and Africa
- South America
This study identifies the infrastructural developments in emerging economies as one of the prime reasons driving the unsaturated polyester resins market growth during the next few years. Also, adoption of advanced manufacturing processes such as 3D printing and rise in demand for unsaturated polyester resins with increasing wind power installations will lead to sizable demand in the market.
The report on the unsaturated polyester resins market covers the following areas:
- Unsaturated polyester resins market sizing
- Unsaturated polyester resins market forecast
- Unsaturated polyester resins market industry analysis
The robust vendor analysis is designed to help clients improve their market position, and in line with this, this report provides a detailed analysis of several leading unsaturated polyester resins market vendors that include Allnex GMBH, Ashland Inc., BASF SE, Covestro AG, Dow Chemical Co., Eternal Materials Co. Ltd., Evergreen Chemicals Co. Ltd., Huizhou GoodUPR Compites Ltd., INEOS AG, Mitsubishi Gas Chemical Co. Inc., Polynt Spa, Revex Plasticisers Pvt. Ltd., Swancor Holding Co. Ltd., and UPC Technology Corp.. Also, the unsaturated polyester resins market analysis report includes information on upcoming trends and challenges that will influence market growth. This is to help companies strategize and leverage all forthcoming growth opportunities.
The study was conducted using an objective combination of primary and secondary information including inputs from key participants in the industry. The report contains a comprehensive market and vendor landscape in addition to an analysis of the key vendors.
The publisher presents a detailed picture of the market by the way of study, synthesis, and summation of data from multiple sources by an analysis of key parameters such as profit, pricing, competition, and promotions. It presents various market facets by identifying the key industry influencers. The data presented is comprehensive, reliable, and a result of extensive research - both primary and secondary. The market research reports provide a complete competitive landscape and an in-depth vendor selection methodology and analysis using qualitative and quantitative research to forecast the accurate market growth.
Table of Contents
1 Executive Summary
- 1.1 Market overview
2 Market Landscape
- 2.1 Market ecosystem
3 Market Sizing
- 3.1 Market definition
- 3.2 Market segment analysis
- 3.3 Market size 2023
- 3.4 Market outlook: Forecast for 2023-2028
4 Historic Market Size
- 4.1 Global unsaturated polyester resins market 2018 - 2022
- 4.2 Type Segment Analysis 2018 - 2022
- 4.3 End-user Segment Analysis 2018 - 2022
- 4.4 Country Segment Analysis 2018 - 2022
5 Five Forces Analysis
- 5.1 Five forces summary
- 5.2 Bargaining power of buyers
- 5.3 Bargaining power of suppliers
- 5.4 Threat of new entrants
- 5.5 Threat of substitutes
- 5.6 Threat of rivalry
- 5.7 Market condition
6 Market Segmentation by Type
- 6.1 Market segments
- 6.2 Comparison by Type
- 6.3 Orthophthalic - Market size and forecast 2023-2028
- 6.4 DCPD - Market size and forecast 2023-2028
- 6.5 Isophthalic - Market size and forecast 2023-2028
- 6.6 Others - Market size and forecast 2023-2028
- 6.7 Market opportunity by Type
7 Market Segmentation by End-user
- 7.1 Market segments
- 7.2 Comparison by End-user
- 7.3 Building and construction - Market size and forecast 2023-2028
- 7.4 Pipes and tanks - Market size and forecast 2023-2028
- 7.5 Automotive - Market size and forecast 2023-2028
- 7.6 Marine - Market size and forecast 2023-2028
- 7.7 Electrical and others - Market size and forecast 2023-2028
- 7.8 Market opportunity by End-user
8 Customer Landscape
- 8.1 Customer landscape overview
9 Geographic Landscape
- 9.1 Geographic segmentation
- 9.2 Geographic comparison
- 9.3 APAC - Market size and forecast 2023-2028
- 9.4 North America - Market size and forecast 2023-2028
- 9.5 Europe - Market size and forecast 2023-2028
- 9.6 Middle East and Africa - Market size and forecast 2023-2028
- 9.7 South America - Market size and forecast 2023-2028
- 9.8 US - Market size and forecast 2023-2028
- 9.9 China - Market size and forecast 2023-2028
- 9.10 Japan - Market size and forecast 2023-2028
- 9.11 Germany - Market size and forecast 2023-2028
- 9.12 India - Market size and forecast 2023-2028
- 9.13 Market opportunity By Geographical Landscape
10 Drivers, Challenges, and Trends
- 10.1 Market drivers
- 10.2 Market challenges
- 10.3 Impact of drivers and challenges
- 10.4 Market trends
11 Vendor Landscape
- 11.1 Overview
- 11.2 Vendor landscape
- 11.3 Landscape disruption
- 11.4 Industry risks
12 Vendor Analysis
- 12.1 Vendors covered
- 12.2 Market positioning of vendors
- 12.3 Allnex GMBH
- 12.4 Ashland Inc.
- 12.5 BASF SE
- 12.6 Covestro AG
- 12.7 Dow Chemical Co.
- 12.8 Eternal Materials Co. Ltd.
- 12.9 Evergreen Chemicals Co. Ltd.
- 12.10 Huizhou GoodUPR Compites Ltd.
- 12.11 INEOS AG
- 12.12 Mitsubishi Gas Chemical Co. Inc.
- 12.13 Polynt Spa
- 12.14 Revex Plasticisers Pvt. Ltd.
- 12.15 Swancor Holding Co. Ltd.
- 12.16 UPC Technology Corp.
13 Appendix
- 13.1 Scope of the report
- 13.2 Inclusions and exclusions checklist
- 13.3 Currency conversion rates for US$
- 13.4 Research methodology
- 13.5 List of abbreviations

