|
|
市場調査レポート
商品コード
1453843
輸液療法機器の世界市場 2024-2028Global Infusion Therapy Devices Market 2024-2028 |
||||||

|
|||||||
カスタマイズ可能
|
|||||||


| 輸液療法機器の世界市場 2024-2028 |
|
出版日: 2024年03月08日
発行: TechNavio
ページ情報: 英文 159 Pages
納期: 即納可能
|

全表示
- 概要
- 図表
- 目次
輸液療法機器市場2024-2028
輸液療法機器市場は2023-2028年に211億8,000万米ドル、予測期間中のCAGRは8.37%で成長すると予測されます。当レポートでは、輸液療法機器市場の全体的な分析、市場規模・予測、動向、成長促進要因、課題、約25のベンダーを網羅したベンダー分析などを掲載しています。
現在の市場シナリオ、最新動向と促進要因、市場環境全体に関する最新分析を提供しています。市場は、慢性疾患の有病率の増加、在宅ケア環境における輸液療法機器の使用急増、非経口栄養に対する需要の高まりによって牽引されています。
| 市場範囲 | |
|---|---|
| 基準年 | 2024 |
| 終了年 | 2028 |
| 予測期間 | 2024-2028 |
| 成長モメンタム | 加速 |
| 前年比2024年 | 7.45% |
| CAGR | 8.37% |
| 増分額 | 211億8,000万米ドル |
本調査では、今後数年間の輸液療法機器市場成長を牽引する主な要因の1つとして、スマート輸液療法機器の出現を挙げています。また、ヘルスケア産業の堅調な成長とベンダーによる研究開発投資の増加が、市場の大きな需要につながります。
目次
第1章 エグゼクティブサマリー
- 市場概要
第2章 市場情勢
- 市場エコシステム
第3章 市場規模
- 市場の定義
- 市場セグメント分析
- 市場規模 2023
- 市場の見通し 2023-2028
第4章 市場規模実績
- 輸液療法機器の世界市場 2018-2022
- エンドユーザーセグメント分析 2018-2022
- 製品セグメント分析 2018-2022
- 地域別セグメント分析 2018-2022
- 国別セグメント分析 2018-2022
第5章 ファイブフォース分析
- ファイブフォースの要約
- 買い手の交渉力
- 供給企業の交渉力
- 新規参入業者の脅威
- 代替品の脅威
- 競争の脅威
- 市況
第6章 市場セグメンテーション:エンドユーザー別
- 市場セグメント
- 比較:エンドユーザー別
- 病院:市場規模と予測 2023-2028
- 在宅ケア:市場規模と予測 2023-2028
- クリニックと外来手術センター:市場規模と予測 2023-2028
- 市場機会:エンドユーザー別
第7章 市場セグメンテーション:製品別
- 市場セグメント
- 比較:製品別
- 輸液ポンプ:市場規模と予測 2023-2028
- 消耗品と付属品:市場規模と予測 2023-2028
- 市場機会:製品別
第8章 顧客情勢
- 顧客情勢の概要
第9章 地域別情勢
- 地域別セグメンテーション
- 地域別比較
- 北米:市場規模と予測 2023-2028
- 欧州:市場規模と予測 2023-2028
- アジア:市場規模と予測 2023-2028
- 世界のその他の地域:市場規模と予測 2023-2028
- 米国:市場規模と予測 2023-2028
- ドイツ:市場規模と予測 2023-2028
- 日本:市場規模と予測 2023-2028
- 中国:市場規模と予測 2023-2028
- 英国:市場規模と予測 2023-2028
- 市場機会:地域情勢別
第10章 促進要因、課題、および動向
- 市場促進要因
- 市場の課題
- 促進要因と課題の影響
- 市場動向
第11章 ベンダー情勢
- 概要
- ベンダー情勢
- 混乱の状況
- 業界のリスク
第12章 ベンダー分析
- 対象ベンダー
- ベンダーの市場ポジショニング
- AngioDynamics Inc.
- B.Braun SE
- Baxter International Inc.
- Becton Dickinson and Company
- Cardinal Health Inc.
- Fresenius SE and Co. KGaA
- ICU Medical Inc.
- IRadimed Corp.
- Medtronic
- Poly Medicure Ltd.
- Smith and Nephew plc
- Tekni Plex Inc.
- Teleflex Inc.
- Terumo Corp.
- Vygon SAS
第13章 付録
Exhibits:
- Exhibits1: Executive Summary - Chart on Market Overview
- Exhibits2: Executive Summary - Data Table on Market Overview
- Exhibits3: Executive Summary - Chart on Global Market Characteristics
- Exhibits4: Executive Summary - Chart on Market By Geographical Landscape
- Exhibits5: Executive Summary - Chart on Market Segmentation by End-user
- Exhibits6: Executive Summary - Chart on Market Segmentation by Product
- Exhibits7: Executive Summary - Chart on Incremental Growth
- Exhibits8: Executive Summary - Data Table on Incremental Growth
- Exhibits9: Executive Summary - Chart on Vendor Market Positioning
- Exhibits10: Parent market
- Exhibits11: Market Characteristics
- Exhibits12: Offerings of vendors included in the market definition
- Exhibits13: Market segments
- Exhibits14: Chart on Global - Market size and forecast 2023-2028 ($ billion)
- Exhibits15: Data Table on Global - Market size and forecast 2023-2028 ($ billion)
- Exhibits16: Chart on Global Market: Year-over-year growth 2023-2028 (%)
- Exhibits17: Data Table on Global Market: Year-over-year growth 2023-2028 (%)
- Exhibits18: Historic Market Size - Data Table on global infusion therapy devices market 2018 - 2022 ($ billion)
- Exhibits19: Historic Market Size - End-user Segment 2018 - 2022 ($ billion)
- Exhibits20: Historic Market Size - Product Segment 2018 - 2022 ($ billion)
- Exhibits21: Historic Market Size - Geography Segment 2018 - 2022 ($ billion)
- Exhibits22: Historic Market Size - Country Segment 2018 - 2022 ($ billion)
- Exhibits23: Five forces analysis - Comparison between 2023 and 2028
- Exhibits24: Chart on Bargaining power of buyers - Impact of key factors 2023 and 2028
- Exhibits25: Bargaining power of suppliers - Impact of key factors in 2023 and 2028
- Exhibits26: Threat of new entrants - Impact of key factors in 2023 and 2028
- Exhibits27: Threat of substitutes - Impact of key factors in 2023 and 2028
- Exhibits28: Threat of rivalry - Impact of key factors in 2023 and 2028
- Exhibits29: Chart on Market condition - Five forces 2023 and 2028
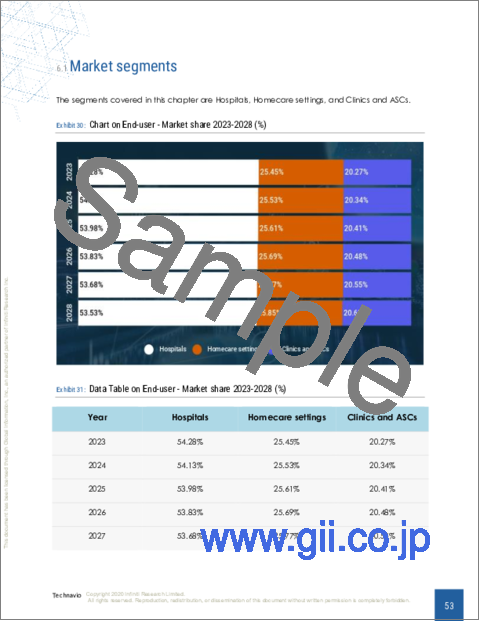
- Exhibits30: Chart on End-user - Market share 2023-2028 (%)
- Exhibits31: Data Table on End-user - Market share 2023-2028 (%)
- Exhibits32: Chart on Comparison by End-user
- Exhibits33: Data Table on Comparison by End-user
- Exhibits34: Chart on Hospitals - Market size and forecast 2023-2028 ($ billion)
- Exhibits35: Data Table on Hospitals - Market size and forecast 2023-2028 ($ billion)
- Exhibits36: Chart on Hospitals - Year-over-year growth 2023-2028 (%)
- Exhibits37: Data Table on Hospitals - Year-over-year growth 2023-2028 (%)
- Exhibits38: Chart on Homecare settings - Market size and forecast 2023-2028 ($ billion)
- Exhibits39: Data Table on Homecare settings - Market size and forecast 2023-2028 ($ billion)
- Exhibits40: Chart on Homecare settings - Year-over-year growth 2023-2028 (%)
- Exhibits41: Data Table on Homecare settings - Year-over-year growth 2023-2028 (%)
- Exhibits42: Chart on Clinics and ASCs - Market size and forecast 2023-2028 ($ billion)
- Exhibits43: Data Table on Clinics and ASCs - Market size and forecast 2023-2028 ($ billion)
- Exhibits44: Chart on Clinics and ASCs - Year-over-year growth 2023-2028 (%)
- Exhibits45: Data Table on Clinics and ASCs - Year-over-year growth 2023-2028 (%)
- Exhibits46: Market opportunity by End-user ($ billion)
- Exhibits47: Data Table on Market opportunity by End-user ($ billion)
- Exhibits48: Chart on Product - Market share 2023-2028 (%)
- Exhibits49: Data Table on Product - Market share 2023-2028 (%)
- Exhibits50: Chart on Comparison by Product
- Exhibits51: Data Table on Comparison by Product
- Exhibits52: Chart on Infusion pumps - Market size and forecast 2023-2028 ($ billion)
- Exhibits53: Data Table on Infusion pumps - Market size and forecast 2023-2028 ($ billion)
- Exhibits54: Chart on Infusion pumps - Year-over-year growth 2023-2028 (%)
- Exhibits55: Data Table on Infusion pumps - Year-over-year growth 2023-2028 (%)
- Exhibits56: Chart on Consumables and accessories - Market size and forecast 2023-2028 ($ billion)
- Exhibits57: Data Table on Consumables and accessories - Market size and forecast 2023-2028 ($ billion)
- Exhibits58: Chart on Consumables and accessories - Year-over-year growth 2023-2028 (%)
- Exhibits59: Data Table on Consumables and accessories - Year-over-year growth 2023-2028 (%)
- Exhibits60: Market opportunity by Product ($ billion)
- Exhibits61: Data Table on Market opportunity by Product ($ billion)
- Exhibits62: Analysis of price sensitivity, lifecycle, customer purchase basket, adoption rates, and purchase criteria
- Exhibits63: Chart on Market share By Geographical Landscape 2023-2028 (%)
- Exhibits64: Data Table on Market share By Geographical Landscape 2023-2028 (%)
- Exhibits65: Chart on Geographic comparison
- Exhibits66: Data Table on Geographic comparison
- Exhibits67: Chart on North America - Market size and forecast 2023-2028 ($ billion)
- Exhibits68: Data Table on North America - Market size and forecast 2023-2028 ($ billion)
- Exhibits69: Chart on North America - Year-over-year growth 2023-2028 (%)
- Exhibits70: Data Table on North America - Year-over-year growth 2023-2028 (%)
- Exhibits71: Chart on Europe - Market size and forecast 2023-2028 ($ billion)
- Exhibits72: Data Table on Europe - Market size and forecast 2023-2028 ($ billion)
- Exhibits73: Chart on Europe - Year-over-year growth 2023-2028 (%)
- Exhibits74: Data Table on Europe - Year-over-year growth 2023-2028 (%)
- Exhibits75: Chart on Asia - Market size and forecast 2023-2028 ($ billion)
- Exhibits76: Data Table on Asia - Market size and forecast 2023-2028 ($ billion)
- Exhibits77: Chart on Asia - Year-over-year growth 2023-2028 (%)
- Exhibits78: Data Table on Asia - Year-over-year growth 2023-2028 (%)
- Exhibits79: Chart on Rest of World (ROW) - Market size and forecast 2023-2028 ($ billion)
- Exhibits80: Data Table on Rest of World (ROW) - Market size and forecast 2023-2028 ($ billion)
- Exhibits81: Chart on Rest of World (ROW) - Year-over-year growth 2023-2028 (%)
- Exhibits82: Data Table on Rest of World (ROW) - Year-over-year growth 2023-2028 (%)
- Exhibits83: Chart on US - Market size and forecast 2023-2028 ($ billion)
- Exhibits84: Data Table on US - Market size and forecast 2023-2028 ($ billion)
- Exhibits85: Chart on US - Year-over-year growth 2023-2028 (%)
- Exhibits86: Data Table on US - Year-over-year growth 2023-2028 (%)
- Exhibits87: Chart on Germany - Market size and forecast 2023-2028 ($ billion)
- Exhibits88: Data Table on Germany - Market size and forecast 2023-2028 ($ billion)
- Exhibits89: Chart on Germany - Year-over-year growth 2023-2028 (%)
- Exhibits90: Data Table on Germany - Year-over-year growth 2023-2028 (%)
- Exhibits91: Chart on Japan - Market size and forecast 2023-2028 ($ billion)
- Exhibits92: Data Table on Japan - Market size and forecast 2023-2028 ($ billion)
- Exhibits93: Chart on Japan - Year-over-year growth 2023-2028 (%)
- Exhibits94: Data Table on Japan - Year-over-year growth 2023-2028 (%)
- Exhibits95: Chart on China - Market size and forecast 2023-2028 ($ billion)
- Exhibits96: Data Table on China - Market size and forecast 2023-2028 ($ billion)
- Exhibits97: Chart on China - Year-over-year growth 2023-2028 (%)
- Exhibits98: Data Table on China - Year-over-year growth 2023-2028 (%)
- Exhibits99: Chart on UK - Market size and forecast 2023-2028 ($ billion)
- Exhibits100: Data Table on UK - Market size and forecast 2023-2028 ($ billion)
- Exhibits101: Chart on UK - Year-over-year growth 2023-2028 (%)
- Exhibits102: Data Table on UK - Year-over-year growth 2023-2028 (%)
- Exhibits103: Market opportunity By Geographical Landscape ($ billion)
- Exhibits104: Data Tables on Market opportunity By Geographical Landscape ($ billion)
- Exhibits105: Impact of drivers and challenges in 2023 and 2028
- Exhibits106: Overview on Criticality of inputs and Factors of differentiation
- Exhibits107: Overview on factors of disruption
- Exhibits108: Impact of key risks on business
- Exhibits109: Vendors covered
- Exhibits110: Matrix on vendor position and classification
- Exhibits111: AngioDynamics Inc. - Overview
- Exhibits112: AngioDynamics Inc. - Business segments
- Exhibits113: AngioDynamics Inc. - Key news
- Exhibits114: AngioDynamics Inc. - Key offerings
- Exhibits115: AngioDynamics Inc. - Segment focus
- Exhibits116: B.Braun SE - Overview
- Exhibits117: B.Braun SE - Business segments
- Exhibits118: B.Braun SE - Key offerings
- Exhibits119: B.Braun SE - Segment focus
- Exhibits120: Baxter International Inc. - Overview
- Exhibits121: Baxter International Inc. - Business segments
- Exhibits122: Baxter International Inc. - Key news
- Exhibits123: Baxter International Inc. - Key offerings
- Exhibits124: Baxter International Inc. - Segment focus
- Exhibits125: Becton Dickinson and Company - Overview
- Exhibits126: Becton Dickinson and Company - Business segments
- Exhibits127: Becton Dickinson and Company - Key news
- Exhibits128: Becton Dickinson and Company - Key offerings
- Exhibits129: Becton Dickinson and Company - Segment focus
- Exhibits130: Cardinal Health Inc. - Overview
- Exhibits131: Cardinal Health Inc. - Business segments
- Exhibits132: Cardinal Health Inc. - Key offerings
- Exhibits133: Cardinal Health Inc. - Segment focus
- Exhibits134: Fresenius SE and Co. KGaA - Overview
- Exhibits135: Fresenius SE and Co. KGaA - Business segments
- Exhibits136: Fresenius SE and Co. KGaA - Key news
- Exhibits137: Fresenius SE and Co. KGaA - Key offerings
- Exhibits138: Fresenius SE and Co. KGaA - Segment focus
- Exhibits139: ICU Medical Inc. - Overview
- Exhibits140: ICU Medical Inc. - Product / Service
- Exhibits141: ICU Medical Inc. - Key offerings
- Exhibits142: IRadimed Corp. - Overview
- Exhibits143: IRadimed Corp. - Product / Service
- Exhibits144: IRadimed Corp. - Key offerings
- Exhibits145: Medtronic - Overview
- Exhibits146: Medtronic - Business segments
- Exhibits147: Medtronic - Key news
- Exhibits148: Medtronic - Key offerings
- Exhibits149: Medtronic - Segment focus
- Exhibits150: Poly Medicure Ltd. - Overview
- Exhibits151: Poly Medicure Ltd. - Product / Service
- Exhibits152: Poly Medicure Ltd. - Key offerings
- Exhibits153: Smith and Nephew plc - Overview
- Exhibits154: Smith and Nephew plc - Business segments
- Exhibits155: Smith and Nephew plc - Key news
- Exhibits156: Smith and Nephew plc - Key offerings
- Exhibits157: Smith and Nephew plc - Segment focus
- Exhibits158: Tekni Plex Inc. - Overview
- Exhibits159: Tekni Plex Inc. - Product / Service
- Exhibits160: Tekni Plex Inc. - Key offerings
- Exhibits161: Teleflex Inc. - Overview
- Exhibits162: Teleflex Inc. - Business segments
- Exhibits163: Teleflex Inc. - Key news
- Exhibits164: Teleflex Inc. - Key offerings
- Exhibits165: Teleflex Inc. - Segment focus
- Exhibits166: Terumo Corp. - Overview
- Exhibits167: Terumo Corp. - Business segments
- Exhibits168: Terumo Corp. - Key news
- Exhibits169: Terumo Corp. - Key offerings
- Exhibits170: Terumo Corp. - Segment focus
- Exhibits171: Vygon SAS - Overview
- Exhibits172: Vygon SAS - Product / Service
- Exhibits173: Vygon SAS - Key offerings
- Exhibits174: Inclusions checklist
- Exhibits175: Exclusions checklist
- Exhibits176: Currency conversion rates for US$
- Exhibits177: Research methodology
- Exhibits178: Validation techniques employed for market sizing
- Exhibits179: Information sources
- Exhibits180: List of abbreviations
Infusion Therapy Devices Market 2024-2028
The infusion therapy devices market is forecasted to grow by USD 21.18 bn during 2023-2028, accelerating at a CAGR of 8.37% during the forecast period. The report on the infusion therapy devices market provides a holistic analysis, market size and forecast, trends, growth drivers, and challenges, as well as vendor analysis covering around 25 vendors.
The report offers an up-to-date analysis regarding the current market scenario, the latest trends and drivers, and the overall market environment. The market is driven by increasing prevalence of chronic diseases, surging use of infusion therapy devices in home care settings, and growing demand for parenteral nutrition.
| Market Scope | |
|---|---|
| Base Year | 2024 |
| End Year | 2028 |
| Series Year | 2024-2028 |
| Growth Momentum | Accelerate |
| YOY 2024 | 7.45% |
| CAGR | 8.37% |
| Incremental Value | $21.18bn |
Technavio's infusion therapy devices market is segmented as below:
By End-user
- Hospitals
- Homecare settings
- Clinics and ASCs
By Product
- Infusion pumps
- Consumables
- accessories
By Geographical Landscape
- North America
- Europe
- Asia
- Rest of World (ROW)
This study identifies the emergence of smart infusion therapy devices as one of the prime reasons driving the infusion therapy devices market growth during the next few years. Also, robust growth of healthcare industry and increasing investment by vendors in R and D will lead to sizable demand in the market.
The report on the infusion therapy devices market covers the following areas:
- Infusion therapy devices market sizing
- Infusion therapy devices market forecast
- Infusion therapy devices market industry analysis
The robust vendor analysis is designed to help clients improve their market position, and in line with this, this report provides a detailed analysis of several leading infusion therapy devices market vendors that include Ace medical, AngioDynamics Inc., Avanos Medical Inc., B.Braun SE, Baxter International Inc., Becton Dickinson and Company, Canafusion Technologies Inc., Cardinal Health Inc., Chemyx Inc., ERENLER MEDIKAL SAN. TIC. LTD. STI., Fresenius SE and Co. KGaA, ICU Medical Inc., IRadimed Corp., Medtronic, Poly Medicure Ltd., Smith and Nephew plc, Tekni Plex Inc., Teleflex Inc., Terumo Corp., and Vygon SAS. Also, the infusion therapy devices market analysis report includes information on upcoming trends and challenges that will influence market growth. This is to help companies strategize and leverage all forthcoming growth opportunities.
The study was conducted using an objective combination of primary and secondary information including inputs from key participants in the industry. The report contains a comprehensive market and vendor landscape in addition to an analysis of the key vendors.
The publisher presents a detailed picture of the market by the way of study, synthesis, and summation of data from multiple sources by an analysis of key parameters such as profit, pricing, competition, and promotions. It presents various market facets by identifying the key industry influencers. The data presented is comprehensive, reliable, and a result of extensive research - both primary and secondary. The market research reports provide a complete competitive landscape and an in-depth vendor selection methodology and analysis using qualitative and quantitative research to forecast the accurate market growth.
Table of Contents
1 Executive Summary
- 1.1 Market overview
2 Market Landscape
- 2.1 Market ecosystem
3 Market Sizing
- 3.1 Market definition
- 3.2 Market segment analysis
- 3.3 Market size 2023
- 3.4 Market outlook: Forecast for 2023-2028
4 Historic Market Size
- 4.1 Global infusion therapy devices market 2018 - 2022
- 4.2 End-user Segment Analysis 2018 - 2022
- 4.3 Product Segment Analysis 2018 - 2022
- 4.4 Geography Segment Analysis 2018 - 2022
- 4.5 Country Segment Analysis 2018 - 2022
5 Five Forces Analysis
- 5.1 Five forces summary
- 5.2 Bargaining power of buyers
- 5.3 Bargaining power of suppliers
- 5.4 Threat of new entrants
- 5.5 Threat of substitutes
- 5.6 Threat of rivalry
- 5.7 Market condition
6 Market Segmentation by End-user
- 6.1 Market segments
- 6.2 Comparison by End-user
- 6.3 Hospitals - Market size and forecast 2023-2028
- 6.4 Homecare settings - Market size and forecast 2023-2028
- 6.5 Clinics and ASCs - Market size and forecast 2023-2028
- 6.6 Market opportunity by End-user
7 Market Segmentation by Product
- 7.1 Market segments
- 7.2 Comparison by Product
- 7.3 Infusion pumps - Market size and forecast 2023-2028
- 7.4 Consumables and accessories - Market size and forecast 2023-2028
- 7.5 Market opportunity by Product
8 Customer Landscape
- 8.1 Customer landscape overview
9 Geographic Landscape
- 9.1 Geographic segmentation
- 9.2 Geographic comparison
- 9.3 North America - Market size and forecast 2023-2028
- 9.4 Europe - Market size and forecast 2023-2028
- 9.5 Asia - Market size and forecast 2023-2028
- 9.6 Rest of World (ROW) - Market size and forecast 2023-2028
- 9.7 US - Market size and forecast 2023-2028
- 9.8 Germany - Market size and forecast 2023-2028
- 9.9 Japan - Market size and forecast 2023-2028
- 9.10 China - Market size and forecast 2023-2028
- 9.11 UK - Market size and forecast 2023-2028
- 9.12 Market opportunity By Geographical Landscape
10 Drivers, Challenges, and Trends
- 10.1 Market drivers
- 10.2 Market challenges
- 10.3 Impact of drivers and challenges
- 10.4 Market trends
11 Vendor Landscape
- 11.1 Overview
- 11.2 Vendor landscape
- 11.3 Landscape disruption
- 11.4 Industry risks
12 Vendor Analysis
- 12.1 Vendors covered
- 12.2 Market positioning of vendors
- 12.3 AngioDynamics Inc.
- 12.4 B.Braun SE
- 12.5 Baxter International Inc.
- 12.6 Becton Dickinson and Company
- 12.7 Cardinal Health Inc.
- 12.8 Fresenius SE and Co. KGaA
- 12.9 ICU Medical Inc.
- 12.10 IRadimed Corp.
- 12.11 Medtronic
- 12.12 Poly Medicure Ltd.
- 12.13 Smith and Nephew plc
- 12.14 Tekni Plex Inc.
- 12.15 Teleflex Inc.
- 12.16 Terumo Corp.
- 12.17 Vygon SAS
13 Appendix
- 13.1 Scope of the report
- 13.2 Inclusions and exclusions checklist
- 13.3 Currency conversion rates for US$
- 13.4 Research methodology
- 13.5 List of abbreviations

