|
|
市場調査レポート
商品コード
1450103
アプリケーション・パフォーマンス管理の世界市場 2024-2028Global Application Performance Management Market 2024-2028 |
||||||
|
|
|||||||
カスタマイズ可能
|
|||||||


| アプリケーション・パフォーマンス管理の世界市場 2024-2028 |
|
出版日: 2024年01月24日
発行: TechNavio
ページ情報: 英文 165 Pages
納期: 即納可能
|

- 全表示
- 概要
- 図表
- 目次
アプリケーション・パフォーマンス管理市場は、2023年から2028年にかけて260億米ドル、予測期間中のCAGRは30.07%で成長すると予測されています。
当レポートでは、アプリケーション・パフォーマンス管理市場の全体的な分析、市場規模・予測、動向、成長促進要因、課題、約25のベンダーを網羅したベンダー分析などを掲載しています。
現在の市場シナリオ、最新動向と促進要因、市場環境全体に関する最新分析を提供しています。モバイルアプリケーションやマイクロサービスアーキテクチャのようなデジタル技術の採用の増加、クラウド環境へのビジネスの急速な移行、シームレスで応答性が高く、パーソナライズされたデジタル体験に対するユーザーの期待の進化が市場を牽引しています。
| 市場範囲 | |
|---|---|
| 基準年 | 2024 |
| 終了年 | 2028 |
| 予測期間 | 2024-2028 |
| 成長モメンタム | 加速 |
| 前年比2024年 | 29.6% |
| CAGR | 30.07% |
| 増分額 | 260億米ドル |
本調査では、今後数年間のアプリケーション・パフォーマンス管理市場の成長を促進する主な要因の1つとして、異常検知と根本原因分析の自動化を挙げています。また、リアルタイムのパフォーマンスモニタリングへの注目の高まりや、DevOpsやアジャイル環境におけるアプリケーション・パフォーマンス管理の需要は、市場の大きな需要につながります。
目次
第1章 エグゼクティブサマリー
- 市場概要
第2章 市場情勢
- 市場エコシステム
第3章 市場規模
- 市場の定義
- 市場セグメント分析
- 市場規模 2023
- 市場の見通し 2023-2028
第4章 市場規模実績
- アプリケーション・パフォーマンス管理の世界市場 2018-2022
- エンドユーザーセグメント分析 2018-2022
- タイプセグメント分析 2018-2022
- 地域別セグメント分析 2018-2022
- 国別セグメント分析 2018-2022
第5章 ファイブフォース分析
- ファイブフォースの要約
- 買い手の交渉力
- 供給企業の交渉力
- 新規参入業者の脅威
- 代替品の脅威
- 競争の脅威
- 市況
第6章 市場セグメンテーション:エンドユーザー別
- 市場セグメント
- 比較:エンドユーザー別
- 大企業:市場規模と予測 2023-2028
- 中小企業:市場規模と予測 2023-2028
- 市場機会:エンドユーザー別
第7章 市場セグメンテーション:タイプ別
- 市場セグメント
- 比較:タイプ別
- ソフトウェア:市場規模と予測 2023-2028
- サービス:市場規模と予測 2023-2028
- 市場機会:タイプ別
第8章 顧客情勢
- 顧客情勢の概要
第9章 地域別情勢
- 地域別セグメンテーション
- 地域別比較
- 北米:市場規模と予測 2023-2028
- 欧州:市場規模と予測 2023-2028
- アジア太平洋:市場規模と予測 2023-2028
- 南米:市場規模と予測 2023-2028
- 中東・アフリカ:市場規模と予測 2023-2028
- 米国:市場規模と予測 2023-2028
- 中国:市場規模と予測 2023-2028
- 英国:市場規模と予測 2023-2028
- ドイツ:市場規模と予測 2023-2028
- 日本:市場規模と予測 2023-2028
- 市場機会:地域情勢別
第10章 促進要因、課題、および動向
- 市場促進要因
- 市場の課題
- 促進要因と課題の影響
- 市場動向
第11章 ベンダー情勢
- 概要
- ベンダー情勢
- 混乱の状況
- 業界のリスク
第12章 ベンダー分析
- 対象ベンダー
- ベンダーの市場ポジショニング
- Akamai Technologies Inc.
- Alphabet Inc.
- Broadcom Inc.
- Cisco Systems Inc.
- Datadog Inc.
- Dynatrace Inc.
- Fujitsu Ltd.
- International Business Machines Corp.
- LogicMonitor Inc.
- Microsoft Corp.
- New Relic Inc.
- Open Text Corp.
- Splunk Inc.
- Sumo Logic Inc.
- Zoho Corp. Pvt. Ltd.
第13章 付録
Exhibits:
- Exhibits1: Executive Summary - Chart on Market Overview
- Exhibits2: Executive Summary - Data Table on Market Overview
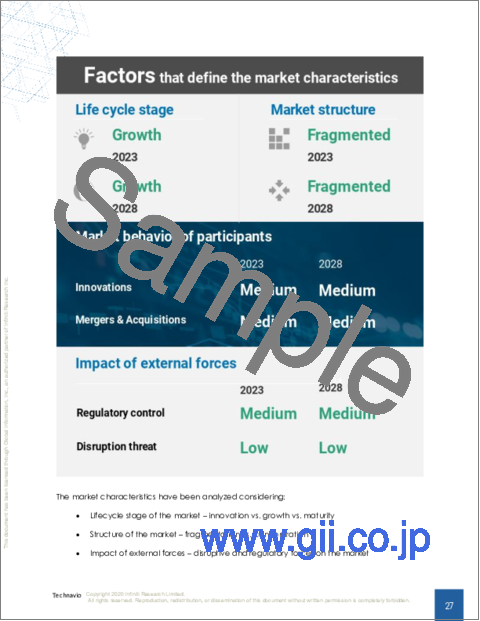
- Exhibits3: Executive Summary - Chart on Global Market Characteristics
- Exhibits4: Executive Summary - Chart on Market By Geographical Landscape
- Exhibits5: Executive Summary - Chart on Market Segmentation by End-user
- Exhibits6: Executive Summary - Chart on Market Segmentation by Type
- Exhibits7: Executive Summary - Chart on Incremental Growth
- Exhibits8: Executive Summary - Data Table on Incremental Growth
- Exhibits9: Executive Summary - Chart on Vendor Market Positioning
- Exhibits10: Parent market
- Exhibits11: Market Characteristics
- Exhibits12: Offerings of vendors included in the market definition
- Exhibits13: Market segments
- Exhibits14: Chart on Global - Market size and forecast 2023-2028 ($ billion)
- Exhibits15: Data Table on Global - Market size and forecast 2023-2028 ($ billion)
- Exhibits16: Chart on Global Market: Year-over-year growth 2023-2028 (%)
- Exhibits17: Data Table on Global Market: Year-over-year growth 2023-2028 (%)
- Exhibits18: Historic Market Size - Data Table on global application performance management market 2018 - 2022 ($ billion)
- Exhibits19: Historic Market Size - End-user Segment 2018 - 2022 ($ billion)
- Exhibits20: Historic Market Size - Type Segment 2018 - 2022 ($ billion)
- Exhibits21: Historic Market Size - Geography Segment 2018 - 2022 ($ billion)
- Exhibits22: Historic Market Size - Country Segment 2018 - 2022 ($ billion)
- Exhibits23: Five forces analysis - Comparison between 2023 and 2028
- Exhibits24: Chart on Bargaining power of buyers - Impact of key factors 2023 and 2028
- Exhibits25: Bargaining power of suppliers - Impact of key factors in 2023 and 2028
- Exhibits26: Threat of new entrants - Impact of key factors in 2023 and 2028
- Exhibits27: Threat of substitutes - Impact of key factors in 2023 and 2028
- Exhibits28: Threat of rivalry - Impact of key factors in 2023 and 2028
- Exhibits29: Chart on Market condition - Five forces 2023 and 2028
- Exhibits30: Chart on End-user - Market share 2023-2028 (%)
- Exhibits31: Data Table on End-user - Market share 2023-2028 (%)
- Exhibits32: Chart on Comparison by End-user
- Exhibits33: Data Table on Comparison by End-user
- Exhibits34: Chart on Large enterprises - Market size and forecast 2023-2028 ($ billion)
- Exhibits35: Data Table on Large enterprises - Market size and forecast 2023-2028 ($ billion)
- Exhibits36: Chart on Large enterprises - Year-over-year growth 2023-2028 (%)
- Exhibits37: Data Table on Large enterprises - Year-over-year growth 2023-2028 (%)
- Exhibits38: Chart on SMEs - Market size and forecast 2023-2028 ($ billion)
- Exhibits39: Data Table on SMEs - Market size and forecast 2023-2028 ($ billion)
- Exhibits40: Chart on SMEs - Year-over-year growth 2023-2028 (%)
- Exhibits41: Data Table on SMEs - Year-over-year growth 2023-2028 (%)
- Exhibits42: Market opportunity by End-user ($ billion)
- Exhibits43: Data Table on Market opportunity by End-user ($ billion)
- Exhibits44: Chart on Type - Market share 2023-2028 (%)
- Exhibits45: Data Table on Type - Market share 2023-2028 (%)
- Exhibits46: Chart on Comparison by Type
- Exhibits47: Data Table on Comparison by Type
- Exhibits48: Chart on Software - Market size and forecast 2023-2028 ($ billion)
- Exhibits49: Data Table on Software - Market size and forecast 2023-2028 ($ billion)
- Exhibits50: Chart on Software - Year-over-year growth 2023-2028 (%)
- Exhibits51: Data Table on Software - Year-over-year growth 2023-2028 (%)
- Exhibits52: Chart on Services - Market size and forecast 2023-2028 ($ billion)
- Exhibits53: Data Table on Services - Market size and forecast 2023-2028 ($ billion)
- Exhibits54: Chart on Services - Year-over-year growth 2023-2028 (%)
- Exhibits55: Data Table on Services - Year-over-year growth 2023-2028 (%)
- Exhibits56: Market opportunity by Type ($ billion)
- Exhibits57: Data Table on Market opportunity by Type ($ billion)
- Exhibits58: Analysis of price sensitivity, lifecycle, customer purchase basket, adoption rates, and purchase criteria
- Exhibits59: Chart on Market share By Geographical Landscape 2023-2028 (%)
- Exhibits60: Data Table on Market share By Geographical Landscape 2023-2028 (%)
- Exhibits61: Chart on Geographic comparison
- Exhibits62: Data Table on Geographic comparison
- Exhibits63: Chart on North America - Market size and forecast 2023-2028 ($ billion)
- Exhibits64: Data Table on North America - Market size and forecast 2023-2028 ($ billion)
- Exhibits65: Chart on North America - Year-over-year growth 2023-2028 (%)
- Exhibits66: Data Table on North America - Year-over-year growth 2023-2028 (%)
- Exhibits67: Chart on Europe - Market size and forecast 2023-2028 ($ billion)
- Exhibits68: Data Table on Europe - Market size and forecast 2023-2028 ($ billion)
- Exhibits69: Chart on Europe - Year-over-year growth 2023-2028 (%)
- Exhibits70: Data Table on Europe - Year-over-year growth 2023-2028 (%)
- Exhibits71: Chart on APAC - Market size and forecast 2023-2028 ($ billion)
- Exhibits72: Data Table on APAC - Market size and forecast 2023-2028 ($ billion)
- Exhibits73: Chart on APAC - Year-over-year growth 2023-2028 (%)
- Exhibits74: Data Table on APAC - Year-over-year growth 2023-2028 (%)
- Exhibits75: Chart on South America - Market size and forecast 2023-2028 ($ billion)
- Exhibits76: Data Table on South America - Market size and forecast 2023-2028 ($ billion)
- Exhibits77: Chart on South America - Year-over-year growth 2023-2028 (%)
- Exhibits78: Data Table on South America - Year-over-year growth 2023-2028 (%)
- Exhibits79: Chart on Middle East and Africa - Market size and forecast 2023-2028 ($ billion)
- Exhibits80: Data Table on Middle East and Africa - Market size and forecast 2023-2028 ($ billion)
- Exhibits81: Chart on Middle East and Africa - Year-over-year growth 2023-2028 (%)
- Exhibits82: Data Table on Middle East and Africa - Year-over-year growth 2023-2028 (%)
- Exhibits83: Chart on US - Market size and forecast 2023-2028 ($ billion)
- Exhibits84: Data Table on US - Market size and forecast 2023-2028 ($ billion)
- Exhibits85: Chart on US - Year-over-year growth 2023-2028 (%)
- Exhibits86: Data Table on US - Year-over-year growth 2023-2028 (%)
- Exhibits87: Chart on China - Market size and forecast 2023-2028 ($ billion)
- Exhibits88: Data Table on China - Market size and forecast 2023-2028 ($ billion)
- Exhibits89: Chart on China - Year-over-year growth 2023-2028 (%)
- Exhibits90: Data Table on China - Year-over-year growth 2023-2028 (%)
- Exhibits91: Chart on UK - Market size and forecast 2023-2028 ($ billion)
- Exhibits92: Data Table on UK - Market size and forecast 2023-2028 ($ billion)
- Exhibits93: Chart on UK - Year-over-year growth 2023-2028 (%)
- Exhibits94: Data Table on UK - Year-over-year growth 2023-2028 (%)
- Exhibits95: Chart on Germany - Market size and forecast 2023-2028 ($ billion)
- Exhibits96: Data Table on Germany - Market size and forecast 2023-2028 ($ billion)
- Exhibits97: Chart on Germany - Year-over-year growth 2023-2028 (%)
- Exhibits98: Data Table on Germany - Year-over-year growth 2023-2028 (%)
- Exhibits99: Chart on Japan - Market size and forecast 2023-2028 ($ billion)
- Exhibits100: Data Table on Japan - Market size and forecast 2023-2028 ($ billion)
- Exhibits101: Chart on Japan - Year-over-year growth 2023-2028 (%)
- Exhibits102: Data Table on Japan - Year-over-year growth 2023-2028 (%)
- Exhibits103: Market opportunity By Geographical Landscape ($ billion)
- Exhibits104: Data Tables on Market opportunity By Geographical Landscape ($ billion)
- Exhibits105: Impact of drivers and challenges in 2023 and 2028
- Exhibits106: Overview on Criticality of inputs and Factors of differentiation
- Exhibits107: Overview on factors of disruption
- Exhibits108: Impact of key risks on business
- Exhibits109: Vendors covered
- Exhibits110: Matrix on vendor position and classification
- Exhibits111: Akamai Technologies Inc. - Overview
- Exhibits112: Akamai Technologies Inc. - Business segments
- Exhibits113: Akamai Technologies Inc. - Key offerings
- Exhibits114: Akamai Technologies Inc. - Segment focus
- Exhibits115: Alphabet Inc. - Overview
- Exhibits116: Alphabet Inc. - Business segments
- Exhibits117: Alphabet Inc. - Key news
- Exhibits118: Alphabet Inc. - Key offerings
- Exhibits119: Alphabet Inc. - Segment focus
- Exhibits120: Broadcom Inc. - Overview
- Exhibits121: Broadcom Inc. - Business segments
- Exhibits122: Broadcom Inc. - Key news
- Exhibits123: Broadcom Inc. - Key offerings
- Exhibits124: Broadcom Inc. - Segment focus
- Exhibits125: Cisco Systems Inc. - Overview
- Exhibits126: Cisco Systems Inc. - Business segments
- Exhibits127: Cisco Systems Inc. - Key news
- Exhibits128: Cisco Systems Inc. - Key offerings
- Exhibits129: Cisco Systems Inc. - Segment focus
- Exhibits130: Datadog Inc. - Overview
- Exhibits131: Datadog Inc. - Product / Service
- Exhibits132: Datadog Inc. - Key offerings
- Exhibits133: Dynatrace Inc. - Overview
- Exhibits134: Dynatrace Inc. - Product / Service
- Exhibits135: Dynatrace Inc. - Key offerings
- Exhibits136: Fujitsu Ltd. - Overview
- Exhibits137: Fujitsu Ltd. - Business segments
- Exhibits138: Fujitsu Ltd. - Key news
- Exhibits139: Fujitsu Ltd. - Key offerings
- Exhibits140: Fujitsu Ltd. - Segment focus
- Exhibits141: International Business Machines Corp. - Overview
- Exhibits142: International Business Machines Corp. - Business segments
- Exhibits143: International Business Machines Corp. - Key news
- Exhibits144: International Business Machines Corp. - Key offerings
- Exhibits145: International Business Machines Corp. - Segment focus
- Exhibits146: LogicMonitor Inc. - Overview
- Exhibits147: LogicMonitor Inc. - Product / Service
- Exhibits148: LogicMonitor Inc. - Key offerings
- Exhibits149: Microsoft Corp. - Overview
- Exhibits150: Microsoft Corp. - Business segments
- Exhibits151: Microsoft Corp. - Key news
- Exhibits152: Microsoft Corp. - Key offerings
- Exhibits153: Microsoft Corp. - Segment focus
- Exhibits154: New Relic Inc. - Overview
- Exhibits155: New Relic Inc. - Product / Service
- Exhibits156: New Relic Inc. - Key news
- Exhibits157: New Relic Inc. - Key offerings
- Exhibits158: Open Text Corp. - Overview
- Exhibits159: Open Text Corp. - Product / Service
- Exhibits160: Open Text Corp. - Key news
- Exhibits161: Open Text Corp. - Key offerings
- Exhibits162: Splunk Inc. - Overview
- Exhibits163: Splunk Inc. - Product / Service
- Exhibits164: Splunk Inc. - Key offerings
- Exhibits165: Sumo Logic Inc. - Overview
- Exhibits166: Sumo Logic Inc. - Product / Service
- Exhibits167: Sumo Logic Inc. - Key offerings
- Exhibits168: Zoho Corp. Pvt. Ltd. - Overview
- Exhibits169: Zoho Corp. Pvt. Ltd. - Product / Service
- Exhibits170: Zoho Corp. Pvt. Ltd. - Key offerings
- Exhibits171: Inclusions checklist
- Exhibits172: Exclusions checklist
- Exhibits173: Currency conversion rates for US$
- Exhibits174: Research methodology
- Exhibits175: Validation techniques employed for market sizing
- Exhibits176: Information sources
- Exhibits177: List of abbreviations
The application performance management market is forecasted to grow by USD 26.00 bn during 2023-2028, accelerating at a CAGR of 30.07% during the forecast period. The report on the application performance management market provides a holistic analysis, market size and forecast, trends, growth drivers, and challenges, as well as vendor analysis covering around 25 vendors.
The report offers an up-to-date analysis regarding the current market scenario, the latest trends and drivers, and the overall market environment. The market is driven by rising adoption of digital technologies like mobile applications and microservices architecture, rapid migration of businesses to cloud environments, and evolving user expectations for seamless, responsive, and personalized digital experiences.
Technavio's application performance management market is segmented as below:
| Market Scope | |
|---|---|
| Base Year | 2024 |
| End Year | 2028 |
| Series Year | 2024-2028 |
| Growth Momentum | Accelerate |
| YOY 2024 | 29.6% |
| CAGR | 30.07% |
| Incremental Value | $26.00bn |
By End-user
- Large enterprises
- SMEs
By Type
- Software
- Services
By Geographical Landscape
- North America
- Europe
- APAC
- South America
- Middle East and Africa
This study identifies the automated anomaly detection and root cause analysis as one of the prime reasons driving the application performance management market growth during the next few years. Also, growing focus on real-time performance monitoring and demand for application performance management in DevOps and agile environments will lead to sizable demand in the market.
The report on the application performance management market covers the following areas:
- Application performance management market sizing
- Application performance management market forecast
- Application performance management market industry analysis
The robust vendor analysis is designed to help clients improve their market position, and in line with this, this report provides a detailed analysis of several leading application performance management market vendors that include Akamai Technologies Inc., Alphabet Inc., BMC Software Inc., Broadcom Inc., Cisco Systems Inc., Datadog Inc., Dynatrace Inc., Fujitsu Ltd., Hexaware Technologies Ltd., International Business Machines Corp., LogicMonitor Inc., Microsoft Corp., Netreo Inc., New Relic Inc., Open Text Corp., Quest Software Inc., Riverbed Technology Inc., Splunk Inc., Sumo Logic Inc., and Zoho Corp. Pvt. Ltd.. Also, the application performance management market analysis report includes information on upcoming trends and challenges that will influence market growth. This is to help companies strategize and leverage all forthcoming growth opportunities.
The study was conducted using an objective combination of primary and secondary information including inputs from key participants in the industry. The report contains a comprehensive market and vendor landscape in addition to an analysis of the key vendors.
The publisher presents a detailed picture of the market by the way of study, synthesis, and summation of data from multiple sources by an analysis of key parameters such as profit, pricing, competition, and promotions. It presents various market facets by identifying the key industry influencers. The data presented is comprehensive, reliable, and a result of extensive research - both primary and secondary. The market research reports provide a complete competitive landscape and an in-depth vendor selection methodology and analysis using qualitative and quantitative research to forecast the accurate market growth.
Table of Contents
1 Executive Summary
- 1.1 Market overview
2 Market Landscape
- 2.1 Market ecosystem
3 Market Sizing
- 3.1 Market definition
- 3.2 Market segment analysis
- 3.3 Market size 2023
- 3.4 Market outlook: Forecast for 2023-2028
4 Historic Market Size
- 4.1 Global application performance management market 2018 - 2022
- 4.2 End-user Segment Analysis 2018 - 2022
- 4.3 Type Segment Analysis 2018 - 2022
- 4.4 Geography Segment Analysis 2018 - 2022
- 4.5 Country Segment Analysis 2018 - 2022
5 Five Forces Analysis
- 5.1 Five forces summary
- 5.2 Bargaining power of buyers
- 5.3 Bargaining power of suppliers
- 5.4 Threat of new entrants
- 5.5 Threat of substitutes
- 5.6 Threat of rivalry
- 5.7 Market condition
6 Market Segmentation by End-user
- 6.1 Market segments
- 6.2 Comparison by End-user
- 6.3 Large enterprises - Market size and forecast 2023-2028
- 6.4 SMEs - Market size and forecast 2023-2028
- 6.5 Market opportunity by End-user
7 Market Segmentation by Type
- 7.1 Market segments
- 7.2 Comparison by Type
- 7.3 Software - Market size and forecast 2023-2028
- 7.4 Services - Market size and forecast 2023-2028
- 7.5 Market opportunity by Type
8 Customer Landscape
- 8.1 Customer landscape overview
9 Geographic Landscape
- 9.1 Geographic segmentation
- 9.2 Geographic comparison
- 9.3 North America - Market size and forecast 2023-2028
- 9.4 Europe - Market size and forecast 2023-2028
- 9.5 APAC - Market size and forecast 2023-2028
- 9.6 South America - Market size and forecast 2023-2028
- 9.7 Middle East and Africa - Market size and forecast 2023-2028
- 9.8 US - Market size and forecast 2023-2028
- 9.9 China - Market size and forecast 2023-2028
- 9.10 UK - Market size and forecast 2023-2028
- 9.11 Germany - Market size and forecast 2023-2028
- 9.12 Japan - Market size and forecast 2023-2028
- 9.13 Market opportunity By Geographical Landscape
10 Drivers, Challenges, and Trends
- 10.1 Market drivers
- 10.2 Market challenges
- 10.3 Impact of drivers and challenges
- 10.4 Market trends
11 Vendor Landscape
- 11.1 Overview
- 11.2 Vendor landscape
- 11.3 Landscape disruption
- 11.4 Industry risks
12 Vendor Analysis
- 12.1 Vendors covered
- 12.2 Market positioning of vendors
- 12.3 Akamai Technologies Inc.
- 12.4 Alphabet Inc.
- 12.5 Broadcom Inc.
- 12.6 Cisco Systems Inc.
- 12.7 Datadog Inc.
- 12.8 Dynatrace Inc.
- 12.9 Fujitsu Ltd.
- 12.10 International Business Machines Corp.
- 12.11 LogicMonitor Inc.
- 12.12 Microsoft Corp.
- 12.13 New Relic Inc.
- 12.14 Open Text Corp.
- 12.15 Splunk Inc.
- 12.16 Sumo Logic Inc.
- 12.17 Zoho Corp. Pvt. Ltd.
13 Appendix
- 13.1 Scope of the report
- 13.2 Inclusions and exclusions checklist
- 13.3 Currency conversion rates for US$
- 13.4 Research methodology
- 13.5 List of abbreviations
