|
|
市場調査レポート
商品コード
1693120
積層造形の世界市場 2025~2029年Global Additive Manufacturing Market 2025-2029 |
||||||

|
|||||||
カスタマイズ可能
|
|||||||

| 積層造形の世界市場 2025~2029年 |
|
出版日: 2025年03月20日
発行: TechNavio
ページ情報: 英文 242 Pages
納期: 即納可能
|

全表示
- 概要
- 図表
- 目次
積層造形市場は2024-2029年に467億5,920万米ドル、予測期間中のCAGRは23.9%で成長すると予測されます。
当レポートでは、積層造形市場の全体的な分析、市場規模・予測、動向、成長促進要因、課題、約25のベンダーを網羅したベンダー分析などを掲載しています。
現在の市場シナリオ、最新動向と促進要因、市場環境全体に関する最新分析を提供しています。市場は、医療機器分野での高い需要、CAD/CAM(コンピュータ支援設計/コンピュータ支援製造)技術やデスクトッププリンターの導入の増加、ベンダー間の提携やパートナーシップなどが牽引しています。
| 市場範囲 | |
|---|---|
| 基準年 | 2025 |
| 終了年 | 2029 |
| 予測期間 | 2025-2029 |
| 成長モメンタム | 加速 |
| 前年比2025年 | 21.4% |
| CAGR | 23.9% |
| 増分額 | 467億5,920万米ドル |
本調査は、業界の主要参加者からのインプットを含め、一次情報と二次情報を客観的に組み合わせて実施しました。レポートには、主要企業の分析に加え、包括的な市場規模データ、地域分析によるセグメント、ベンダー情勢が含まれています。レポートには過去データと予測データがあります。
本調査では、今後数年間の積層造形市場の成長を促進する主な要因の1つとして、3Dカスタマイズ製品に対する消費者の関心の高まりを挙げています。また、アディティブプリンティングにおけるカートリッジの無駄が少なく、3Dプリンティングに必要な時間が限られていることも、市場の大きな需要につながります。
目次
第1章 エグゼクティブサマリー
- 市場概要
第2章 Technavio分析
- 価格・ライフサイクル・顧客購入バスケット・採用率・購入基準の分析
- インプットの重要性と差別化の要因
- 混乱の要因
- 促進要因と課題の影響
第3章 市場情勢
- 市場エコシステム
- 市場の特徴
- バリューチェーン分析
第4章 市場規模
- 市場の定義
- 市場セグメント分析
- 市場規模 2024
- 市場の見通し 2024-2029
第5章 市場規模実績
- 積層造形の世界市場 2019-2023
- コンポーネント別セグメント分析 2019-2023
- エンドユーザー別セグメント分析 2019-2023
- 素材別セグメント分析 2019-2023
- 技術別セグメント分析 2019-2023
- 地域別セグメント分析 2019-2023
- 国別セグメント分析 2019-2023
第6章 定性分析
- AIの影響:積層造形の世界市場
第7章 ファイブフォース分析
- ファイブフォースの要約
- 買い手の交渉力
- 供給企業の交渉力
- 新規参入業者の脅威
- 代替品の脅威
- 競争の脅威
- 市況
第8章 市場セグメンテーション:コンポーネント別
- 市場セグメント
- 比較:コンポーネント別
- ハードウェア:市場規模と予測 2024-2029
- ソフトウェア:市場規模と予測 2024-2029
- サービス:市場規模と予測 2024-2029
- 市場機会:コンポーネント別
第9章 市場セグメンテーション:エンドユーザー別
- 市場セグメント
- 比較:エンドユーザー別
- 自動車:市場規模と予測 2024-2029
- 航空宇宙:市場規模と予測 2024-2029
- 産業:市場規模と予測 2024-2029
- ヘルスケア:市場規模と予測 2024-2029
- その他:市場規模と予測 2024-2029
- 市場機会:エンドユーザー別
第10章 市場セグメンテーション:素材別
- 市場セグメント
- 比較:素材別
- プラスチック:市場規模と予測 2024-2029
- 金属:市場規模と予測 2024-2029
- 陶芸:市場規模と予測 2024-2029
- その他:市場規模と予測 2024-2029
- 市場機会:素材別
第11章 市場セグメンテーション:技術別
- 市場セグメント
- 比較:技術別
- ステレオリソグラフィー:市場規模と予測 2024-2029
- ポリジェット印刷:市場規模と予測 2024-2029
- バインダージェッティング印刷:市場規模と予測 2024-2029
- レーザー焼結:市場規模と予測 2024-2029
- その他:市場規模と予測 2024-2029
- 市場機会:技術別
第12章 顧客情勢
- 顧客情勢の概要
第13章 地域別情勢
- 地域別セグメンテーション
- 地域別比較
- 北米:市場規模と予測 2024-2029
- 欧州:市場規模と予測 2024-2029
- アジア太平洋:市場規模と予測 2024-2029
- 南米:市場規模と予測 2024-2029
- 中東・アフリカ:市場規模と予測 2024-2029
- 米国:市場規模と予測 2024-2029
- ドイツ:市場規模と予測 2024-2029
- カナダ:市場規模と予測 2024-2029
- 中国:市場規模と予測 2024-2029
- 日本:市場規模と予測 2024-2029
- 英国:市場規模と予測 2024-2029
- フランス:市場規模と予測 2024-2029
- インド:市場規模と予測 2024-2029
- スペイン:市場規模と予測 2024-2029
- 韓国:市場規模と予測 2024-2029
- 市場機会:地域情勢別
第14章 促進要因・課題・機会・抑制要因
- 市場促進要因
- 市場の課題
- 促進要因と課題の影響
- 市場の機会・抑制要因
第15章 競合情勢
- 概要
- 競合情勢
- 混乱の状況
- 業界のリスク
第16章 競合分析
- 企業プロファイル
- 企業ランキング指数
- 企業の市場ポジショニング
- Additive Industries BV
- Autodesk Inc.
- Canon Inc.
- ColVisTec AG
- DMG MORI Co. Ltd.
- ENVISIONTEC US LLC
- EOS GmbH
- Formlabs Inc.
- General Electric Co.
- HP Inc.
- MATERIALISE NV
- Stratasys Ltd.
- voxeljet AG
第17章 付録
Exhibits:
- Exhibits1: Executive Summary - Chart on Market Overview
- Exhibits2: Executive Summary - Data Table on Market Overview
- Exhibits3: Executive Summary - Chart on Global Market Characteristics
- Exhibits4: Executive Summary - Chart on Market By Geographical Landscape
- Exhibits5: Executive Summary - Chart on Market Segmentation by Component
- Exhibits6: Executive Summary - Chart on Market Segmentation by End-user
- Exhibits7: Executive Summary - Chart on Market Segmentation by Material
- Exhibits8: Executive Summary - Chart on Market Segmentation by Technology
- Exhibits9: Executive Summary - Chart on Incremental Growth
- Exhibits10: Executive Summary - Data Table on Incremental Growth
- Exhibits11: Executive Summary - Chart on Company Market Positioning
- Exhibits12: Analysis of price sensitivity, lifecycle, customer purchase basket, adoption rates, and purchase criteria
- Exhibits13: Overview on criticality of inputs and factors of differentiation
- Exhibits14: Overview on factors of disruption
- Exhibits15: Impact of drivers and challenges in 2024 and 2029
- Exhibits16: Parent Market
- Exhibits17: Data Table on - Parent Market
- Exhibits18: Market characteristics analysis
- Exhibits19: Value chain analysis
- Exhibits20: Offerings of companies included in the market definition
- Exhibits21: Market segments
- Exhibits22: Chart on Global - Market size and forecast 2024-2029 ($ million)
- Exhibits23: Data Table on Global - Market size and forecast 2024-2029 ($ million)
- Exhibits24: Chart on Global Market: Year-over-year growth 2024-2029 (%)
- Exhibits25: Data Table on Global Market: Year-over-year growth 2024-2029 (%)
- Exhibits26: Historic Market Size - Data Table on Global Additive Manufacturing Market 2019 - 2023 ($ million)
- Exhibits27: Historic Market Size - Component Segment 2019 - 2023 ($ million)
- Exhibits28: Historic Market Size - End-user Segment 2019 - 2023 ($ million)
- Exhibits29: Historic Market Size - Material Segment 2019 - 2023 ($ million)
- Exhibits30: Historic Market Size - Technology Segment 2019 - 2023 ($ million)
- Exhibits31: Historic Market Size - Geography Segment 2019 - 2023 ($ million)
- Exhibits32: Historic Market Size - Country Segment 2019 - 2023 ($ million)
- Exhibits33: Five forces analysis - Comparison between 2024 and 2029
- Exhibits34: Bargaining power of buyers - Impact of key factors 2024 and 2029
- Exhibits35: Bargaining power of suppliers - Impact of key factors in 2024 and 2029
- Exhibits36: Threat of new entrants - Impact of key factors in 2024 and 2029
- Exhibits37: Threat of substitutes - Impact of key factors in 2024 and 2029
- Exhibits38: Threat of rivalry - Impact of key factors in 2024 and 2029
- Exhibits39: Chart on Market condition - Five forces 2024 and 2029
- Exhibits40: Chart on Component - Market share 2024-2029 (%)
- Exhibits41: Data Table on Component - Market share 2024-2029 (%)
- Exhibits42: Chart on Comparison by Component
- Exhibits43: Data Table on Comparison by Component
- Exhibits44: Chart on Hardware - Market size and forecast 2024-2029 ($ million)
- Exhibits45: Data Table on Hardware - Market size and forecast 2024-2029 ($ million)
- Exhibits46: Chart on Hardware - Year-over-year growth 2024-2029 (%)
- Exhibits47: Data Table on Hardware - Year-over-year growth 2024-2029 (%)
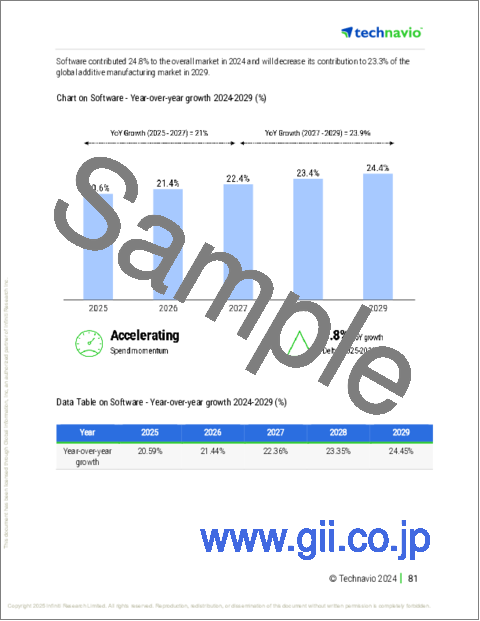
- Exhibits48: Chart on Software - Market size and forecast 2024-2029 ($ million)
- Exhibits49: Data Table on Software - Market size and forecast 2024-2029 ($ million)
- Exhibits50: Chart on Software - Year-over-year growth 2024-2029 (%)
- Exhibits51: Data Table on Software - Year-over-year growth 2024-2029 (%)
- Exhibits52: Chart on Services - Market size and forecast 2024-2029 ($ million)
- Exhibits53: Data Table on Services - Market size and forecast 2024-2029 ($ million)
- Exhibits54: Chart on Services - Year-over-year growth 2024-2029 (%)
- Exhibits55: Data Table on Services - Year-over-year growth 2024-2029 (%)
- Exhibits56: Market opportunity by Component ($ million)
- Exhibits57: Data Table on Market opportunity by Component ($ million)
- Exhibits58: Chart on End-user - Market share 2024-2029 (%)
- Exhibits59: Data Table on End-user - Market share 2024-2029 (%)
- Exhibits60: Chart on Comparison by End-user
- Exhibits61: Data Table on Comparison by End-user
- Exhibits62: Chart on Automotive - Market size and forecast 2024-2029 ($ million)
- Exhibits63: Data Table on Automotive - Market size and forecast 2024-2029 ($ million)
- Exhibits64: Chart on Automotive - Year-over-year growth 2024-2029 (%)
- Exhibits65: Data Table on Automotive - Year-over-year growth 2024-2029 (%)
- Exhibits66: Chart on Aerospace - Market size and forecast 2024-2029 ($ million)
- Exhibits67: Data Table on Aerospace - Market size and forecast 2024-2029 ($ million)
- Exhibits68: Chart on Aerospace - Year-over-year growth 2024-2029 (%)
- Exhibits69: Data Table on Aerospace - Year-over-year growth 2024-2029 (%)
- Exhibits70: Chart on Industrial - Market size and forecast 2024-2029 ($ million)
- Exhibits71: Data Table on Industrial - Market size and forecast 2024-2029 ($ million)
- Exhibits72: Chart on Industrial - Year-over-year growth 2024-2029 (%)
- Exhibits73: Data Table on Industrial - Year-over-year growth 2024-2029 (%)
- Exhibits74: Chart on Healthcare - Market size and forecast 2024-2029 ($ million)
- Exhibits75: Data Table on Healthcare - Market size and forecast 2024-2029 ($ million)
- Exhibits76: Chart on Healthcare - Year-over-year growth 2024-2029 (%)
- Exhibits77: Data Table on Healthcare - Year-over-year growth 2024-2029 (%)
- Exhibits78: Chart on Others - Market size and forecast 2024-2029 ($ million)
- Exhibits79: Data Table on Others - Market size and forecast 2024-2029 ($ million)
- Exhibits80: Chart on Others - Year-over-year growth 2024-2029 (%)
- Exhibits81: Data Table on Others - Year-over-year growth 2024-2029 (%)
- Exhibits82: Market opportunity by End-user ($ million)
- Exhibits83: Data Table on Market opportunity by End-user ($ million)
- Exhibits84: Chart on Material - Market share 2024-2029 (%)
- Exhibits85: Data Table on Material - Market share 2024-2029 (%)
- Exhibits86: Chart on Comparison by Material
- Exhibits87: Data Table on Comparison by Material
- Exhibits88: Chart on Plastics - Market size and forecast 2024-2029 ($ million)
- Exhibits89: Data Table on Plastics - Market size and forecast 2024-2029 ($ million)
- Exhibits90: Chart on Plastics - Year-over-year growth 2024-2029 (%)
- Exhibits91: Data Table on Plastics - Year-over-year growth 2024-2029 (%)
- Exhibits92: Chart on Metals - Market size and forecast 2024-2029 ($ million)
- Exhibits93: Data Table on Metals - Market size and forecast 2024-2029 ($ million)
- Exhibits94: Chart on Metals - Year-over-year growth 2024-2029 (%)
- Exhibits95: Data Table on Metals - Year-over-year growth 2024-2029 (%)
- Exhibits96: Chart on Ceramics - Market size and forecast 2024-2029 ($ million)
- Exhibits97: Data Table on Ceramics - Market size and forecast 2024-2029 ($ million)
- Exhibits98: Chart on Ceramics - Year-over-year growth 2024-2029 (%)
- Exhibits99: Data Table on Ceramics - Year-over-year growth 2024-2029 (%)
- Exhibits100: Chart on Others - Market size and forecast 2024-2029 ($ million)
- Exhibits101: Data Table on Others - Market size and forecast 2024-2029 ($ million)
- Exhibits102: Chart on Others - Year-over-year growth 2024-2029 (%)
- Exhibits103: Data Table on Others - Year-over-year growth 2024-2029 (%)
- Exhibits104: Market opportunity by Material ($ million)
- Exhibits105: Data Table on Market opportunity by Material ($ million)
- Exhibits106: Chart on Technology - Market share 2024-2029 (%)
- Exhibits107: Data Table on Technology - Market share 2024-2029 (%)
- Exhibits108: Chart on Comparison by Technology
- Exhibits109: Data Table on Comparison by Technology
- Exhibits110: Chart on Stereolithography - Market size and forecast 2024-2029 ($ million)
- Exhibits111: Data Table on Stereolithography - Market size and forecast 2024-2029 ($ million)
- Exhibits112: Chart on Stereolithography - Year-over-year growth 2024-2029 (%)
- Exhibits113: Data Table on Stereolithography - Year-over-year growth 2024-2029 (%)
- Exhibits114: Chart on Polyjet printing - Market size and forecast 2024-2029 ($ million)
- Exhibits115: Data Table on Polyjet printing - Market size and forecast 2024-2029 ($ million)
- Exhibits116: Chart on Polyjet printing - Year-over-year growth 2024-2029 (%)
- Exhibits117: Data Table on Polyjet printing - Year-over-year growth 2024-2029 (%)
- Exhibits118: Chart on Binder jetting printing - Market size and forecast 2024-2029 ($ million)
- Exhibits119: Data Table on Binder jetting printing - Market size and forecast 2024-2029 ($ million)
- Exhibits120: Chart on Binder jetting printing - Year-over-year growth 2024-2029 (%)
- Exhibits121: Data Table on Binder jetting printing - Year-over-year growth 2024-2029 (%)
- Exhibits122: Chart on Laser sintering - Market size and forecast 2024-2029 ($ million)
- Exhibits123: Data Table on Laser sintering - Market size and forecast 2024-2029 ($ million)
- Exhibits124: Chart on Laser sintering - Year-over-year growth 2024-2029 (%)
- Exhibits125: Data Table on Laser sintering - Year-over-year growth 2024-2029 (%)
- Exhibits126: Chart on Others - Market size and forecast 2024-2029 ($ million)
- Exhibits127: Data Table on Others - Market size and forecast 2024-2029 ($ million)
- Exhibits128: Chart on Others - Year-over-year growth 2024-2029 (%)
- Exhibits129: Data Table on Others - Year-over-year growth 2024-2029 (%)
- Exhibits130: Market opportunity by Technology ($ million)
- Exhibits131: Data Table on Market opportunity by Technology ($ million)
- Exhibits132: Analysis of price sensitivity, lifecycle, customer purchase basket, adoption rates, and purchase criteria
- Exhibits133: Chart on Market share By Geographical Landscape 2024-2029 (%)
- Exhibits134: Data Table on Market share By Geographical Landscape 2024-2029 (%)
- Exhibits135: Chart on Geographic comparison
- Exhibits136: Data Table on Geographic comparison
- Exhibits137: Chart on North America - Market size and forecast 2024-2029 ($ million)
- Exhibits138: Data Table on North America - Market size and forecast 2024-2029 ($ million)
- Exhibits139: Chart on North America - Year-over-year growth 2024-2029 (%)
- Exhibits140: Data Table on North America - Year-over-year growth 2024-2029 (%)
- Exhibits141: Chart on Europe - Market size and forecast 2024-2029 ($ million)
- Exhibits142: Data Table on Europe - Market size and forecast 2024-2029 ($ million)
- Exhibits143: Chart on Europe - Year-over-year growth 2024-2029 (%)
- Exhibits144: Data Table on Europe - Year-over-year growth 2024-2029 (%)
- Exhibits145: Chart on APAC - Market size and forecast 2024-2029 ($ million)
- Exhibits146: Data Table on APAC - Market size and forecast 2024-2029 ($ million)
- Exhibits147: Chart on APAC - Year-over-year growth 2024-2029 (%)
- Exhibits148: Data Table on APAC - Year-over-year growth 2024-2029 (%)
- Exhibits149: Chart on South America - Market size and forecast 2024-2029 ($ million)
- Exhibits150: Data Table on South America - Market size and forecast 2024-2029 ($ million)
- Exhibits151: Chart on South America - Year-over-year growth 2024-2029 (%)
- Exhibits152: Data Table on South America - Year-over-year growth 2024-2029 (%)
- Exhibits153: Chart on Middle East and Africa - Market size and forecast 2024-2029 ($ million)
- Exhibits154: Data Table on Middle East and Africa - Market size and forecast 2024-2029 ($ million)
- Exhibits155: Chart on Middle East and Africa - Year-over-year growth 2024-2029 (%)
- Exhibits156: Data Table on Middle East and Africa - Year-over-year growth 2024-2029 (%)
- Exhibits157: Chart on US - Market size and forecast 2024-2029 ($ million)
- Exhibits158: Data Table on US - Market size and forecast 2024-2029 ($ million)
- Exhibits159: Chart on US - Year-over-year growth 2024-2029 (%)
- Exhibits160: Data Table on US - Year-over-year growth 2024-2029 (%)
- Exhibits161: Chart on Germany - Market size and forecast 2024-2029 ($ million)
- Exhibits162: Data Table on Germany - Market size and forecast 2024-2029 ($ million)
- Exhibits163: Chart on Germany - Year-over-year growth 2024-2029 (%)
- Exhibits164: Data Table on Germany - Year-over-year growth 2024-2029 (%)
- Exhibits165: Chart on Canada - Market size and forecast 2024-2029 ($ million)
- Exhibits166: Data Table on Canada - Market size and forecast 2024-2029 ($ million)
- Exhibits167: Chart on Canada - Year-over-year growth 2024-2029 (%)
- Exhibits168: Data Table on Canada - Year-over-year growth 2024-2029 (%)
- Exhibits169: Chart on China - Market size and forecast 2024-2029 ($ million)
- Exhibits170: Data Table on China - Market size and forecast 2024-2029 ($ million)
- Exhibits171: Chart on China - Year-over-year growth 2024-2029 (%)
- Exhibits172: Data Table on China - Year-over-year growth 2024-2029 (%)
- Exhibits173: Chart on Japan - Market size and forecast 2024-2029 ($ million)
- Exhibits174: Data Table on Japan - Market size and forecast 2024-2029 ($ million)
- Exhibits175: Chart on Japan - Year-over-year growth 2024-2029 (%)
- Exhibits176: Data Table on Japan - Year-over-year growth 2024-2029 (%)
- Exhibits177: Chart on UK - Market size and forecast 2024-2029 ($ million)
- Exhibits178: Data Table on UK - Market size and forecast 2024-2029 ($ million)
- Exhibits179: Chart on UK - Year-over-year growth 2024-2029 (%)
- Exhibits180: Data Table on UK - Year-over-year growth 2024-2029 (%)
- Exhibits181: Chart on France - Market size and forecast 2024-2029 ($ million)
- Exhibits182: Data Table on France - Market size and forecast 2024-2029 ($ million)
- Exhibits183: Chart on France - Year-over-year growth 2024-2029 (%)
- Exhibits184: Data Table on France - Year-over-year growth 2024-2029 (%)
- Exhibits185: Chart on India - Market size and forecast 2024-2029 ($ million)
- Exhibits186: Data Table on India - Market size and forecast 2024-2029 ($ million)
- Exhibits187: Chart on India - Year-over-year growth 2024-2029 (%)
- Exhibits188: Data Table on India - Year-over-year growth 2024-2029 (%)
- Exhibits189: Chart on Spain - Market size and forecast 2024-2029 ($ million)
- Exhibits190: Data Table on Spain - Market size and forecast 2024-2029 ($ million)
- Exhibits191: Chart on Spain - Year-over-year growth 2024-2029 (%)
- Exhibits192: Data Table on Spain - Year-over-year growth 2024-2029 (%)
- Exhibits193: Chart on South Korea - Market size and forecast 2024-2029 ($ million)
- Exhibits194: Data Table on South Korea - Market size and forecast 2024-2029 ($ million)
- Exhibits195: Chart on South Korea - Year-over-year growth 2024-2029 (%)
- Exhibits196: Data Table on South Korea - Year-over-year growth 2024-2029 (%)
- Exhibits197: Market opportunity By Geographical Landscape ($ million)
- Exhibits198: Data Tables on Market opportunity By Geographical Landscape ($ million)
- Exhibits199: Impact of drivers and challenges in 2024 and 2029
- Exhibits200: Overview on criticality of inputs and factors of differentiation
- Exhibits201: Overview on factors of disruption
- Exhibits202: Impact of key risks on business
- Exhibits203: Companies covered
- Exhibits204: Company ranking index
- Exhibits205: Matrix on companies position and classification
- Exhibits206: 3D Systems Corp. - Overview
- Exhibits207: 3D Systems Corp. - Business segments
- Exhibits208: 3D Systems Corp. - Key news
- Exhibits209: 3D Systems Corp. - Key offerings
- Exhibits210: 3D Systems Corp. - Segment focus
- Exhibits211: SWOT
- Exhibits212: 3DEO Inc. - Overview
- Exhibits213: 3DEO Inc. - Product / Service
- Exhibits214: 3DEO Inc. - Key offerings
- Exhibits215: SWOT
- Exhibits216: Additive Industries BV - Overview
- Exhibits217: Additive Industries BV - Product / Service
- Exhibits218: Additive Industries BV - Key offerings
- Exhibits219: SWOT
- Exhibits220: Autodesk Inc. - Overview
- Exhibits221: Autodesk Inc. - Business segments
- Exhibits222: Autodesk Inc. - Key news
- Exhibits223: Autodesk Inc. - Key offerings
- Exhibits224: Autodesk Inc. - Segment focus
- Exhibits225: SWOT
- Exhibits226: Canon Inc. - Overview
- Exhibits227: Canon Inc. - Business segments
- Exhibits228: Canon Inc. - Key news
- Exhibits229: Canon Inc. - Key offerings
- Exhibits230: Canon Inc. - Segment focus
- Exhibits231: SWOT
- Exhibits232: ColVisTec AG - Overview
- Exhibits233: ColVisTec AG - Product / Service
- Exhibits234: ColVisTec AG - Key offerings
- Exhibits235: SWOT
- Exhibits236: DMG MORI Co. Ltd. - Overview
- Exhibits237: DMG MORI Co. Ltd. - Business segments
- Exhibits238: DMG MORI Co. Ltd. - Key offerings
- Exhibits239: DMG MORI Co. Ltd. - Segment focus
- Exhibits240: SWOT
- Exhibits241: ENVISIONTEC US LLC - Overview
- Exhibits242: ENVISIONTEC US LLC - Product / Service
- Exhibits243: ENVISIONTEC US LLC - Key offerings
- Exhibits244: SWOT
- Exhibits245: EOS GmbH - Overview
- Exhibits246: EOS GmbH - Product / Service
- Exhibits247: EOS GmbH - Key news
- Exhibits248: EOS GmbH - Key offerings
- Exhibits249: SWOT
- Exhibits250: Formlabs Inc. - Overview
- Exhibits251: Formlabs Inc. - Product / Service
- Exhibits252: Formlabs Inc. - Key offerings
- Exhibits253: SWOT
- Exhibits254: General Electric Co. - Overview
- Exhibits255: General Electric Co. - Business segments
- Exhibits256: General Electric Co. - Key news
- Exhibits257: General Electric Co. - Key offerings
- Exhibits258: General Electric Co. - Segment focus
- Exhibits259: SWOT
- Exhibits260: HP Inc. - Overview
- Exhibits261: HP Inc. - Business segments
- Exhibits262: HP Inc. - Key news
- Exhibits263: HP Inc. - Key offerings
- Exhibits264: HP Inc. - Segment focus
- Exhibits265: SWOT
- Exhibits266: MATERIALISE NV - Overview
- Exhibits267: MATERIALISE NV - Business segments
- Exhibits268: MATERIALISE NV - Key news
- Exhibits269: MATERIALISE NV - Key offerings
- Exhibits270: MATERIALISE NV - Segment focus
- Exhibits271: SWOT
- Exhibits272: Stratasys Ltd. - Overview
- Exhibits273: Stratasys Ltd. - Product / Service
- Exhibits274: Stratasys Ltd. - Key news
- Exhibits275: Stratasys Ltd. - Key offerings
- Exhibits276: SWOT
- Exhibits277: voxeljet AG - Overview
- Exhibits278: voxeljet AG - Business segments
- Exhibits279: voxeljet AG - Key news
- Exhibits280: voxeljet AG - Key offerings
- Exhibits281: voxeljet AG - Segment focus
- Exhibits282: SWOT
- Exhibits283: Inclusions checklist
- Exhibits284: Exclusions checklist
- Exhibits285: Currency conversion rates for US$
- Exhibits286: Research methodology
- Exhibits287: Information sources
- Exhibits288: Data validation
- Exhibits289: Validation techniques employed for market sizing
- Exhibits290: Data synthesis
- Exhibits291: 360 degree market analysis
- Exhibits292: List of abbreviations
The additive manufacturing market is forecasted to grow by USD 46759.2 million during 2024-2029, accelerating at a CAGR of 23.9% during the forecast period. The report on the additive manufacturing market provides a holistic analysis, market size and forecast, trends, growth drivers, and challenges, as well as vendor analysis covering around 25 vendors.
The report offers an up-to-date analysis regarding the current market scenario, the latest trends and drivers, and the overall market environment. The market is driven by high demand in medical device sector, rise in adoption of computer-aided design/computer-aided manufacturing (CAD/CAM) technology and desktop printers, and collaborations and partnerships among vendors.
| Market Scope | |
|---|---|
| Base Year | 2025 |
| End Year | 2029 |
| Series Year | 2025-2029 |
| Growth Momentum | Accelerate |
| YOY 2025 | 21.4% |
| CAGR | 23.9% |
| Incremental Value | $46759.2 mn |
The study was conducted using an objective combination of primary and secondary information including inputs from key participants in the industry. The report contains a comprehensive market size data, segment with regional analysis and vendor landscape in addition to an analysis of the key companies. Reports have historic and forecast data.
Technavio's additive manufacturing market is segmented as below:
By Component
- Hardware
- Software
- Services
By End-user
- Automotive
- Aerospace
- Industrial
- Healthcare
- Others
By Material
- Plastics
- Metals
- Ceramics
- Others
By Technology
- Stereolithography
- Polyjet printing
- Binder jetting printing
- Laser sintering
- Others
By Geographical Landscape
- North America
- Europe
- APAC
- South America
- Middle East and Africa
This study identifies the increase in consumer interest in 3D customized products as one of the prime reasons driving the additive manufacturing market growth during the next few years. Also, low wastage of cartridges in additive printing and limited time required for 3D printing will lead to sizable demand in the market.
The report on the additive manufacturing market covers the following areas:
- Additive Manufacturing Market sizing
- Additive Manufacturing Market forecast
- Additive Manufacturing Market industry analysis
The robust vendor analysis is designed to help clients improve their market position, and in line with this, this report provides a detailed analysis of several leading additive manufacturing market vendors that include 3D Systems Corp., 3DEO Inc., Additive Industries BV, Autodesk Inc., BICO Group AB, Canon Inc., Carbon Inc., CINCINNATI Inc., ColVisTec AG, DMG MORI Co. Ltd., dsm-firmenich, ENVISIONTEC US LLC, EOS GmbH, Formlabs Inc., General Electric Co., HP Inc., Markforged Holding Corp., MATERIALISE NV, Stratasys Ltd., and voxeljet AG. Also, the additive manufacturing market analysis report includes information on upcoming trends and challenges that will influence market growth. This is to help companies strategize and leverage all forthcoming growth opportunities.
The publisher presents a detailed picture of the market by the way of study, synthesis, and summation of data from multiple sources by an analysis of key parameters such as profit, pricing, competition, and promotions. It presents various market facets by identifying the key industry influencers. The data presented is comprehensive, reliable, and a result of extensive primary and secondary research. The market research reports provide a complete competitive landscape and an in-depth vendor selection methodology and analysis using qualitative and quantitative research to forecast accurate market growth.
Table of Contents
1 Executive Summary
- 1.1 Market overview
- Executive Summary - Chart on Market Overview
- Executive Summary - Data Table on Market Overview
- Executive Summary - Chart on Global Market Characteristics
- Executive Summary - Chart on Market By Geographical Landscape
- Executive Summary - Chart on Market Segmentation by Component
- Executive Summary - Chart on Market Segmentation by End-user
- Executive Summary - Chart on Market Segmentation by Material
- Executive Summary - Chart on Market Segmentation by Technology
- Executive Summary - Chart on Incremental Growth
- Executive Summary - Data Table on Incremental Growth
- Executive Summary - Chart on Company Market Positioning
2 Technavio Analysis
- 2.1 Analysis of price sensitivity, lifecycle, customer purchase basket, adoption rates, and purchase criteria
- Analysis of price sensitivity, lifecycle, customer purchase basket, adoption rates, and purchase criteria
- 2.2 Criticality of inputs and Factors of differentiation
- Overview on criticality of inputs and factors of differentiation
- 2.3 Factors of disruption
- Overview on factors of disruption
- 2.4 Impact of drivers and challenges
- Impact of drivers and challenges in 2024 and 2029
3 Market Landscape
- 3.1 Market ecosystem
- Parent Market
- Data Table on - Parent Market
- 3.2 Market characteristics
- Market characteristics analysis
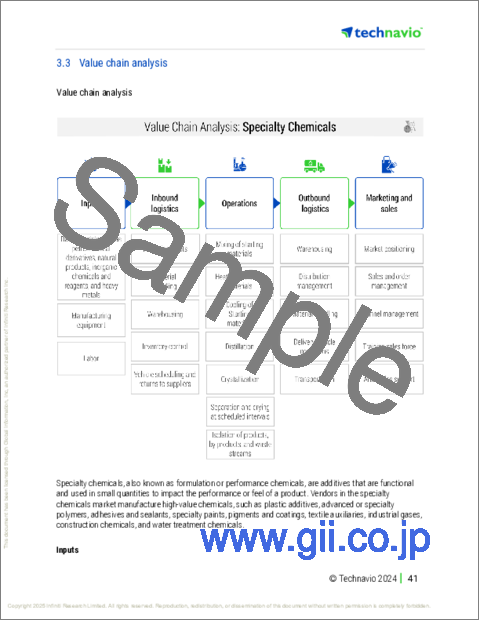
- 3.3 Value chain analysis
- Value chain analysis
4 Market Sizing
- 4.1 Market definition
- Offerings of companies included in the market definition
- 4.2 Market segment analysis
- Market segments
- 4.3 Market size 2024
- 4.4 Market outlook: Forecast for 2024-2029
- Chart on Global - Market size and forecast 2024-2029 ($ million)
- Data Table on Global - Market size and forecast 2024-2029 ($ million)
- Chart on Global Market: Year-over-year growth 2024-2029 (%)
- Data Table on Global Market: Year-over-year growth 2024-2029 (%)
5 Historic Market Size
- 5.1 Global Additive Manufacturing Market 2019 - 2023
- Historic Market Size - Data Table on Global Additive Manufacturing Market 2019 - 2023 ($ million)
- 5.2 Component segment analysis 2019 - 2023
- Historic Market Size - Component Segment 2019 - 2023 ($ million)
- 5.3 End-user segment analysis 2019 - 2023
- Historic Market Size - End-user Segment 2019 - 2023 ($ million)
- 5.4 Material segment analysis 2019 - 2023
- Historic Market Size - Material Segment 2019 - 2023 ($ million)
- 5.5 Technology segment analysis 2019 - 2023
- Historic Market Size - Technology Segment 2019 - 2023 ($ million)
- 5.6 Geography segment analysis 2019 - 2023
- Historic Market Size - Geography Segment 2019 - 2023 ($ million)
- 5.7 Country segment analysis 2019 - 2023
- Historic Market Size - Country Segment 2019 - 2023 ($ million)
6 Qualitative Analysis
- 6.1 Impact of AI on Global Additive Manufacturing Market
7 Five Forces Analysis
- 7.1 Five forces summary
- Five forces analysis - Comparison between 2024 and 2029
- 7.2 Bargaining power of buyers
- Bargaining power of buyers - Impact of key factors 2024 and 2029
- 7.3 Bargaining power of suppliers
- Bargaining power of suppliers - Impact of key factors in 2024 and 2029
- 7.4 Threat of new entrants
- Threat of new entrants - Impact of key factors in 2024 and 2029
- 7.5 Threat of substitutes
- Threat of substitutes - Impact of key factors in 2024 and 2029
- 7.6 Threat of rivalry
- Threat of rivalry - Impact of key factors in 2024 and 2029
- 7.7 Market condition
- Chart on Market condition - Five forces 2024 and 2029
8 Market Segmentation by Component
- 8.1 Market segments
- Chart on Component - Market share 2024-2029 (%)
- Data Table on Component - Market share 2024-2029 (%)
- 8.2 Comparison by Component
- Chart on Comparison by Component
- Data Table on Comparison by Component
- 8.3 Hardware - Market size and forecast 2024-2029
- Chart on Hardware - Market size and forecast 2024-2029 ($ million)
- Data Table on Hardware - Market size and forecast 2024-2029 ($ million)
- Chart on Hardware - Year-over-year growth 2024-2029 (%)
- Data Table on Hardware - Year-over-year growth 2024-2029 (%)
- 8.4 Software - Market size and forecast 2024-2029
- Chart on Software - Market size and forecast 2024-2029 ($ million)
- Data Table on Software - Market size and forecast 2024-2029 ($ million)
- Chart on Software - Year-over-year growth 2024-2029 (%)
- Data Table on Software - Year-over-year growth 2024-2029 (%)
- 8.5 Services - Market size and forecast 2024-2029
- Chart on Services - Market size and forecast 2024-2029 ($ million)
- Data Table on Services - Market size and forecast 2024-2029 ($ million)
- Chart on Services - Year-over-year growth 2024-2029 (%)
- Data Table on Services - Year-over-year growth 2024-2029 (%)
- 8.6 Market opportunity by Component
- Market opportunity by Component ($ million)
- Data Table on Market opportunity by Component ($ million)
9 Market Segmentation by End-user
- 9.1 Market segments
- Chart on End-user - Market share 2024-2029 (%)
- Data Table on End-user - Market share 2024-2029 (%)
- 9.2 Comparison by End-user
- Chart on Comparison by End-user
- Data Table on Comparison by End-user
- 9.3 Automotive - Market size and forecast 2024-2029
- Chart on Automotive - Market size and forecast 2024-2029 ($ million)
- Data Table on Automotive - Market size and forecast 2024-2029 ($ million)
- Chart on Automotive - Year-over-year growth 2024-2029 (%)
- Data Table on Automotive - Year-over-year growth 2024-2029 (%)
- 9.4 Aerospace - Market size and forecast 2024-2029
- Chart on Aerospace - Market size and forecast 2024-2029 ($ million)
- Data Table on Aerospace - Market size and forecast 2024-2029 ($ million)
- Chart on Aerospace - Year-over-year growth 2024-2029 (%)
- Data Table on Aerospace - Year-over-year growth 2024-2029 (%)
- 9.5 Industrial - Market size and forecast 2024-2029
- Chart on Industrial - Market size and forecast 2024-2029 ($ million)
- Data Table on Industrial - Market size and forecast 2024-2029 ($ million)
- Chart on Industrial - Year-over-year growth 2024-2029 (%)
- Data Table on Industrial - Year-over-year growth 2024-2029 (%)
- 9.6 Healthcare - Market size and forecast 2024-2029
- Chart on Healthcare - Market size and forecast 2024-2029 ($ million)
- Data Table on Healthcare - Market size and forecast 2024-2029 ($ million)
- Chart on Healthcare - Year-over-year growth 2024-2029 (%)
- Data Table on Healthcare - Year-over-year growth 2024-2029 (%)
- 9.7 Others - Market size and forecast 2024-2029
- Chart on Others - Market size and forecast 2024-2029 ($ million)
- Data Table on Others - Market size and forecast 2024-2029 ($ million)
- Chart on Others - Year-over-year growth 2024-2029 (%)
- Data Table on Others - Year-over-year growth 2024-2029 (%)
- 9.8 Market opportunity by End-user
- Market opportunity by End-user ($ million)
- Data Table on Market opportunity by End-user ($ million)
10 Market Segmentation by Material
- 10.1 Market segments
- Chart on Material - Market share 2024-2029 (%)
- Data Table on Material - Market share 2024-2029 (%)
- 10.2 Comparison by Material
- Chart on Comparison by Material
- Data Table on Comparison by Material
- 10.3 Plastics - Market size and forecast 2024-2029
- Chart on Plastics - Market size and forecast 2024-2029 ($ million)
- Data Table on Plastics - Market size and forecast 2024-2029 ($ million)
- Chart on Plastics - Year-over-year growth 2024-2029 (%)
- Data Table on Plastics - Year-over-year growth 2024-2029 (%)
- 10.4 Metals - Market size and forecast 2024-2029
- Chart on Metals - Market size and forecast 2024-2029 ($ million)
- Data Table on Metals - Market size and forecast 2024-2029 ($ million)
- Chart on Metals - Year-over-year growth 2024-2029 (%)
- Data Table on Metals - Year-over-year growth 2024-2029 (%)
- 10.5 Ceramics - Market size and forecast 2024-2029
- Chart on Ceramics - Market size and forecast 2024-2029 ($ million)
- Data Table on Ceramics - Market size and forecast 2024-2029 ($ million)
- Chart on Ceramics - Year-over-year growth 2024-2029 (%)
- Data Table on Ceramics - Year-over-year growth 2024-2029 (%)
- 10.6 Others - Market size and forecast 2024-2029
- Chart on Others - Market size and forecast 2024-2029 ($ million)
- Data Table on Others - Market size and forecast 2024-2029 ($ million)
- Chart on Others - Year-over-year growth 2024-2029 (%)
- Data Table on Others - Year-over-year growth 2024-2029 (%)
- 10.7 Market opportunity by Material
- Market opportunity by Material ($ million)
- Data Table on Market opportunity by Material ($ million)
11 Market Segmentation by Technology
- 11.1 Market segments
- Chart on Technology - Market share 2024-2029 (%)
- Data Table on Technology - Market share 2024-2029 (%)
- 11.2 Comparison by Technology
- Chart on Comparison by Technology
- Data Table on Comparison by Technology
- 11.3 Stereolithography - Market size and forecast 2024-2029
- Chart on Stereolithography - Market size and forecast 2024-2029 ($ million)
- Data Table on Stereolithography - Market size and forecast 2024-2029 ($ million)
- Chart on Stereolithography - Year-over-year growth 2024-2029 (%)
- Data Table on Stereolithography - Year-over-year growth 2024-2029 (%)
- 11.4 Polyjet printing - Market size and forecast 2024-2029
- Chart on Polyjet printing - Market size and forecast 2024-2029 ($ million)
- Data Table on Polyjet printing - Market size and forecast 2024-2029 ($ million)
- Chart on Polyjet printing - Year-over-year growth 2024-2029 (%)
- Data Table on Polyjet printing - Year-over-year growth 2024-2029 (%)
- 11.5 Binder jetting printing - Market size and forecast 2024-2029
- Chart on Binder jetting printing - Market size and forecast 2024-2029 ($ million)
- Data Table on Binder jetting printing - Market size and forecast 2024-2029 ($ million)
- Chart on Binder jetting printing - Year-over-year growth 2024-2029 (%)
- Data Table on Binder jetting printing - Year-over-year growth 2024-2029 (%)
- 11.6 Laser sintering - Market size and forecast 2024-2029
- Chart on Laser sintering - Market size and forecast 2024-2029 ($ million)
- Data Table on Laser sintering - Market size and forecast 2024-2029 ($ million)
- Chart on Laser sintering - Year-over-year growth 2024-2029 (%)
- Data Table on Laser sintering - Year-over-year growth 2024-2029 (%)
- 11.7 Others - Market size and forecast 2024-2029
- Chart on Others - Market size and forecast 2024-2029 ($ million)
- Data Table on Others - Market size and forecast 2024-2029 ($ million)
- Chart on Others - Year-over-year growth 2024-2029 (%)
- Data Table on Others - Year-over-year growth 2024-2029 (%)
- 11.8 Market opportunity by Technology
- Market opportunity by Technology ($ million)
- Data Table on Market opportunity by Technology ($ million)
12 Customer Landscape
- 12.1 Customer landscape overview
- Analysis of price sensitivity, lifecycle, customer purchase basket, adoption rates, and purchase criteria
13 Geographic Landscape
- 13.1 Geographic segmentation
- Chart on Market share By Geographical Landscape 2024-2029 (%)
- Data Table on Market share By Geographical Landscape 2024-2029 (%)
- 13.2 Geographic comparison
- Chart on Geographic comparison
- Data Table on Geographic comparison
- 13.3 North America - Market size and forecast 2024-2029
- Chart on North America - Market size and forecast 2024-2029 ($ million)
- Data Table on North America - Market size and forecast 2024-2029 ($ million)
- Chart on North America - Year-over-year growth 2024-2029 (%)
- Data Table on North America - Year-over-year growth 2024-2029 (%)
- 13.4 Europe - Market size and forecast 2024-2029
- Chart on Europe - Market size and forecast 2024-2029 ($ million)
- Data Table on Europe - Market size and forecast 2024-2029 ($ million)
- Chart on Europe - Year-over-year growth 2024-2029 (%)
- Data Table on Europe - Year-over-year growth 2024-2029 (%)
- 13.5 APAC - Market size and forecast 2024-2029
- Chart on APAC - Market size and forecast 2024-2029 ($ million)
- Data Table on APAC - Market size and forecast 2024-2029 ($ million)
- Chart on APAC - Year-over-year growth 2024-2029 (%)
- Data Table on APAC - Year-over-year growth 2024-2029 (%)
- 13.6 South America - Market size and forecast 2024-2029
- Chart on South America - Market size and forecast 2024-2029 ($ million)
- Data Table on South America - Market size and forecast 2024-2029 ($ million)
- Chart on South America - Year-over-year growth 2024-2029 (%)
- Data Table on South America - Year-over-year growth 2024-2029 (%)
- 13.7 Middle East and Africa - Market size and forecast 2024-2029
- Chart on Middle East and Africa - Market size and forecast 2024-2029 ($ million)
- Data Table on Middle East and Africa - Market size and forecast 2024-2029 ($ million)
- Chart on Middle East and Africa - Year-over-year growth 2024-2029 (%)
- Data Table on Middle East and Africa - Year-over-year growth 2024-2029 (%)
- 13.8 US - Market size and forecast 2024-2029
- Chart on US - Market size and forecast 2024-2029 ($ million)
- Data Table on US - Market size and forecast 2024-2029 ($ million)
- Chart on US - Year-over-year growth 2024-2029 (%)
- Data Table on US - Year-over-year growth 2024-2029 (%)
- 13.9 Germany - Market size and forecast 2024-2029
- Chart on Germany - Market size and forecast 2024-2029 ($ million)
- Data Table on Germany - Market size and forecast 2024-2029 ($ million)
- Chart on Germany - Year-over-year growth 2024-2029 (%)
- Data Table on Germany - Year-over-year growth 2024-2029 (%)
- 13.10 Canada - Market size and forecast 2024-2029
- Chart on Canada - Market size and forecast 2024-2029 ($ million)
- Data Table on Canada - Market size and forecast 2024-2029 ($ million)
- Chart on Canada - Year-over-year growth 2024-2029 (%)
- Data Table on Canada - Year-over-year growth 2024-2029 (%)
- 13.11 China - Market size and forecast 2024-2029
- Chart on China - Market size and forecast 2024-2029 ($ million)
- Data Table on China - Market size and forecast 2024-2029 ($ million)
- Chart on China - Year-over-year growth 2024-2029 (%)
- Data Table on China - Year-over-year growth 2024-2029 (%)
- 13.12 Japan - Market size and forecast 2024-2029
- Chart on Japan - Market size and forecast 2024-2029 ($ million)
- Data Table on Japan - Market size and forecast 2024-2029 ($ million)
- Chart on Japan - Year-over-year growth 2024-2029 (%)
- Data Table on Japan - Year-over-year growth 2024-2029 (%)
- 13.13 UK - Market size and forecast 2024-2029
- Chart on UK - Market size and forecast 2024-2029 ($ million)
- Data Table on UK - Market size and forecast 2024-2029 ($ million)
- Chart on UK - Year-over-year growth 2024-2029 (%)
- Data Table on UK - Year-over-year growth 2024-2029 (%)
- 13.14 France - Market size and forecast 2024-2029
- Chart on France - Market size and forecast 2024-2029 ($ million)
- Data Table on France - Market size and forecast 2024-2029 ($ million)
- Chart on France - Year-over-year growth 2024-2029 (%)
- Data Table on France - Year-over-year growth 2024-2029 (%)
- 13.15 India - Market size and forecast 2024-2029
- Chart on India - Market size and forecast 2024-2029 ($ million)
- Data Table on India - Market size and forecast 2024-2029 ($ million)
- Chart on India - Year-over-year growth 2024-2029 (%)
- Data Table on India - Year-over-year growth 2024-2029 (%)
- 13.16 Spain - Market size and forecast 2024-2029
- Chart on Spain - Market size and forecast 2024-2029 ($ million)
- Data Table on Spain - Market size and forecast 2024-2029 ($ million)
- Chart on Spain - Year-over-year growth 2024-2029 (%)
- Data Table on Spain - Year-over-year growth 2024-2029 (%)
- 13.17 South Korea - Market size and forecast 2024-2029
- Chart on South Korea - Market size and forecast 2024-2029 ($ million)
- Data Table on South Korea - Market size and forecast 2024-2029 ($ million)
- Chart on South Korea - Year-over-year growth 2024-2029 (%)
- Data Table on South Korea - Year-over-year growth 2024-2029 (%)
- 13.18 Market opportunity By Geographical Landscape
- Market opportunity By Geographical Landscape ($ million)
- Data Tables on Market opportunity By Geographical Landscape ($ million)
14 Drivers, Challenges, and Opportunity/Restraints
- 14.1 Market drivers
- 14.2 Market challenges
- 14.3 Impact of drivers and challenges
- Impact of drivers and challenges in 2024 and 2029
- 14.4 Market opportunities/restraints
15 Competitive Landscape
- 15.1 Overview
- 15.2 Competitive Landscape
- Overview on criticality of inputs and factors of differentiation
- 15.3 Landscape disruption
- Overview on factors of disruption
- 15.4 Industry risks
- Impact of key risks on business
16 Competitive Analysis
- 16.1 Companies profiled
- Companies covered
- 16.2 Company ranking index
- Company ranking index
- 16.3 Market positioning of companies
- Matrix on companies position and classification
- 3D Systems Corp.
- 3D Systems Corp. - Overview
- 3D Systems Corp. - Business segments
- 3D Systems Corp. - Key news
- 3D Systems Corp. - Key offerings
- 3D Systems Corp. - Segment focus
- SWOT
- 3DEO Inc.
- 3DEO Inc. - Overview
- 3DEO Inc. - Product / Service
- 3DEO Inc. - Key offerings
- SWOT
- 16.6 Additive Industries BV
- Additive Industries BV - Overview
- Additive Industries BV - Product / Service
- Additive Industries BV - Key offerings
- SWOT
- 16.7 Autodesk Inc.
- Autodesk Inc. - Overview
- Autodesk Inc. - Business segments
- Autodesk Inc. - Key news
- Autodesk Inc. - Key offerings
- Autodesk Inc. - Segment focus
- SWOT
- 16.8 Canon Inc.
- Canon Inc. - Overview
- Canon Inc. - Business segments
- Canon Inc. - Key news
- Canon Inc. - Key offerings
- Canon Inc. - Segment focus
- SWOT
- 16.9 ColVisTec AG
- ColVisTec AG - Overview
- ColVisTec AG - Product / Service
- ColVisTec AG - Key offerings
- SWOT
- 16.10 DMG MORI Co. Ltd.
- DMG MORI Co. Ltd. - Overview
- DMG MORI Co. Ltd. - Business segments
- DMG MORI Co. Ltd. - Key offerings
- DMG MORI Co. Ltd. - Segment focus
- SWOT
- 16.11 ENVISIONTEC US LLC
- ENVISIONTEC US LLC - Overview
- ENVISIONTEC US LLC - Product / Service
- ENVISIONTEC US LLC - Key offerings
- SWOT
- 16.12 EOS GmbH
- EOS GmbH - Overview
- EOS GmbH - Product / Service
- EOS GmbH - Key news
- EOS GmbH - Key offerings
- SWOT
- 16.13 Formlabs Inc.
- Formlabs Inc. - Overview
- Formlabs Inc. - Product / Service
- Formlabs Inc. - Key offerings
- SWOT
- 16.14 General Electric Co.
- General Electric Co. - Overview
- General Electric Co. - Business segments
- General Electric Co. - Key news
- General Electric Co. - Key offerings
- General Electric Co. - Segment focus
- SWOT
- 16.15 HP Inc.
- HP Inc. - Overview
- HP Inc. - Business segments
- HP Inc. - Key news
- HP Inc. - Key offerings
- HP Inc. - Segment focus
- SWOT
- 16.16 MATERIALISE NV
- MATERIALISE NV - Overview
- MATERIALISE NV - Business segments
- MATERIALISE NV - Key news
- MATERIALISE NV - Key offerings
- MATERIALISE NV - Segment focus
- SWOT
- 16.17 Stratasys Ltd.
- Stratasys Ltd. - Overview
- Stratasys Ltd. - Product / Service
- Stratasys Ltd. - Key news
- Stratasys Ltd. - Key offerings
- SWOT
- 16.18 voxeljet AG
- voxeljet AG - Overview
- voxeljet AG - Business segments
- voxeljet AG - Key news
- voxeljet AG - Key offerings
- voxeljet AG - Segment focus
- SWOT
17 Appendix
- 17.1 Scope of the report
- 17.2 Inclusions and exclusions checklist
- Inclusions checklist
- Exclusions checklist
- 17.3 Currency conversion rates for US$
- Currency conversion rates for US$
- 17.4 Research methodology
- Research methodology
- 17.5 Data procurement
- Information sources
- 17.6 Data validation
- Data validation
- 17.7 Validation techniques employed for market sizing
- Validation techniques employed for market sizing
- 17.8 Data synthesis
- Data synthesis
- 17.9 360 degree market analysis
- 360 degree market analysis
- 17.10 List of abbreviations
- List of abbreviations

