|
|
市場調査レポート
商品コード
1446170
スマートガラスの世界市場 2024-2028Global Smart Glass Market 2024-2028 |
||||||
|
|||||||
カスタマイズ可能
|
|||||||

| スマートガラスの世界市場 2024-2028 |
|
出版日: 2024年02月28日
発行: TechNavio
ページ情報: 英文 102 Pages
納期: 即納可能
|

全表示
- 概要
- 図表
- 目次
スマートガラス市場は2023-2028年に87億米ドル、予測期間中のCAGRは16.1%で成長すると予測されます。
当レポートでは、スマートガラス市場の全体的な分析、市場規模・予測、動向、成長促進要因、課題、約25のベンダーを網羅したベンダー分析などを掲載しています。
現在の市場シナリオ、最新動向と促進要因、市場環境全体に関する最新分析を提供しています。市場は、スマートガラス技術の進歩、ヘルスケアアプリケーションにおけるスマートガラス使用の増加、航空機におけるスマートガラス使用の増加によって牽引されています。
| 市場範囲 | |
|---|---|
| 基準年 | 2024 |
| 終了年 | 2028 |
| 予測期間 | 2024-2028 |
| 成長モメンタム | 加速 |
| 前年比2024年 | 15.28% |
| CAGR | 16.1% |
| 増分額 | 87億米ドル |
本調査では、スマートガラスとIoTの統合が、今後数年間のスマートガラス市場成長を牽引する主要因の1つであるとしています。また、エネルギー効率の高いソリューションの採用拡大やスマートシティ構想の世界の高まりは、市場の大きな需要につながります。
目次
第1章 エグゼクティブサマリー
- 市場概要
第2章 市場情勢
- 市場エコシステム
第3章 市場規模
- 市場の定義
- 市場セグメント分析
- 市場規模 2023
- 市場の見通し 2023-2028
第4章 市場規模実績
- スマートガラスの世界市場 2018-2022
- 用途別セグメント分析 2018-2022
- 技術セグメント分析 2018-2022
- 地域別セグメント分析 2018-2022
- 国別セグメント分析 2018-2022
第5章 ファイブフォース分析
- ファイブフォースの要約
- 買い手の交渉力
- 供給企業の交渉力
- 新規参入業者の脅威
- 代替品の脅威
- 競争の脅威
- 市況
第6章 市場セグメンテーション:用途別
- 市場セグメント
- 比較:用途別
- インフラ整備:市場規模と予測 2023-2028
- 交通機関:市場規模と予測 2023-2028
- その他:市場規模と予測 2023-2028
- 市場機会:用途別
第7章 市場セグメンテーション:技術別
- 市場セグメント
- 比較:技術別
- エレクトロクロミック:市場規模と予測 2023-2028
- 浮遊粒子装置:市場規模と予測 2023-2028
- 高分子分散型液晶:市場規模と予測 2023-2028
- フォトクロミック:市場規模と予測 2023-2028
- サーモクロミックとマイクロブラインド:市場規模と予測 2023-2028
- 市場機会:技術別
第8章 顧客情勢
- 顧客情勢の概要
第9章 地域別情勢
- 地域別セグメンテーション
- 地域別比較
- 北米:市場規模と予測 2023-2028
- 欧州:市場規模と予測 2023-2028
- アジア太平洋:市場規模と予測 2023-2028
- 南米:市場規模と予測 2023-2028
- 中東・アフリカ:市場規模と予測 2023-2028
- 米国:市場規模と予測 2023-2028
- 中国:市場規模と予測 2023-2028
- ドイツ:市場規模と予測 2023-2028
- フランス:市場規模と予測 2023-2028
- 日本:市場規模と予測 2023-2028
- 市場機会:地域情勢別
第10章 促進要因、課題、および動向
- 市場促進要因
- 市場の課題
- 促進要因と課題の影響
- 市場動向
第11章 ベンダー情勢
- 概要
- ベンダー情勢
- 混乱の状況
- 業界のリスク
第12章 ベンダー分析
- 対象ベンダー
- ベンダーの市場ポジショニング
- 3M Co.
- AGC Inc.
- BASF SE
- Cardinal Glass Industries Inc.
- Corning Inc.
- Gauzy Ltd.
- Halio Inc.
- Nippon Sheet Glass Co. Ltd.
- Polytronix Inc.
- PPG Industries Inc.
- Research frontiers Inc
- Smart Glass Technologies, LLC
- SmartGlass International
- The Saint Gobain Group
- Xinology Co. Ltd.
第13章 付録
Exhibits:
- Exhibits1: Executive Summary - Chart on Market Overview
- Exhibits2: Executive Summary - Data Table on Market Overview
- Exhibits3: Executive Summary - Chart on Global Market Characteristics
- Exhibits4: Executive Summary - Chart on Market By Geographical Landscape
- Exhibits5: Executive Summary - Chart on Market Segmentation by Application
- Exhibits6: Executive Summary - Chart on Market Segmentation by Technology
- Exhibits7: Executive Summary - Chart on Incremental Growth
- Exhibits8: Executive Summary - Data Table on Incremental Growth
- Exhibits9: Executive Summary - Chart on Vendor Market Positioning
- Exhibits10: Parent market
- Exhibits11: Market Characteristics
- Exhibits12: Offerings of vendors included in the market definition
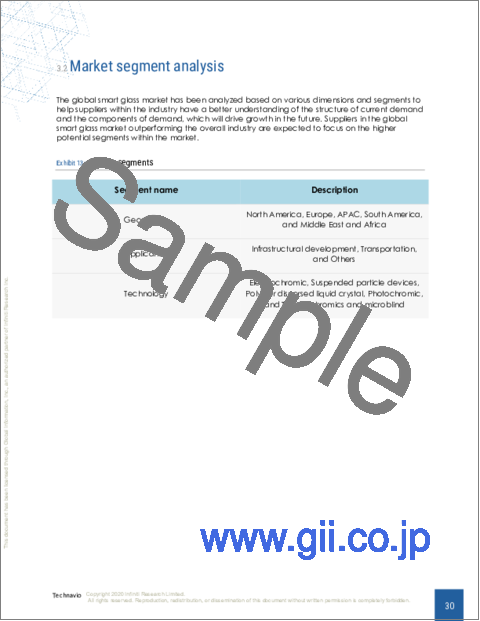
- Exhibits13: Market segments
- Exhibits14: Chart on Global - Market size and forecast 2023-2028 ($ billion)
- Exhibits15: Data Table on Global - Market size and forecast 2023-2028 ($ billion)
- Exhibits16: Chart on Global Market: Year-over-year growth 2023-2028 (%)
- Exhibits17: Data Table on Global Market: Year-over-year growth 2023-2028 (%)
- Exhibits18: Historic Market Size - Data Table on global smart glass market 2018 - 2022 ($ billion)
- Exhibits19: Historic Market Size - Application Segment 2018 - 2022 ($ billion)
- Exhibits20: Historic Market Size - Technology Segment 2018 - 2022 ($ billion)
- Exhibits21: Historic Market Size - Geography Segment 2018 - 2022 ($ billion)
- Exhibits22: Historic Market Size - Country Segment 2018 - 2022 ($ billion)
- Exhibits23: Five forces analysis - Comparison between 2023 and 2028
- Exhibits24: Chart on Bargaining power of buyers - Impact of key factors 2023 and 2028
- Exhibits25: Bargaining power of suppliers - Impact of key factors in 2023 and 2028
- Exhibits26: Threat of new entrants - Impact of key factors in 2023 and 2028
- Exhibits27: Threat of substitutes - Impact of key factors in 2023 and 2028
- Exhibits28: Threat of rivalry - Impact of key factors in 2023 and 2028
- Exhibits29: Chart on Market condition - Five forces 2023 and 2028
- Exhibits30: Chart on Application - Market share 2023-2028 (%)
- Exhibits31: Data Table on Application - Market share 2023-2028 (%)
- Exhibits32: Chart on Comparison by Application
- Exhibits33: Data Table on Comparison by Application
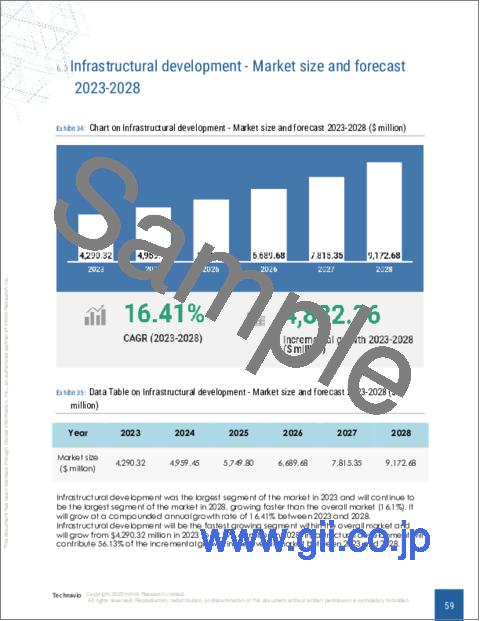
- Exhibits34: Chart on Infrastructural development - Market size and forecast 2023-2028 ($ billion)
- Exhibits35: Data Table on Infrastructural development - Market size and forecast 2023-2028 ($ billion)
- Exhibits36: Chart on Infrastructural development - Year-over-year growth 2023-2028 (%)
- Exhibits37: Data Table on Infrastructural development - Year-over-year growth 2023-2028 (%)
- Exhibits38: Chart on Transportation - Market size and forecast 2023-2028 ($ billion)
- Exhibits39: Data Table on Transportation - Market size and forecast 2023-2028 ($ billion)
- Exhibits40: Chart on Transportation - Year-over-year growth 2023-2028 (%)
- Exhibits41: Data Table on Transportation - Year-over-year growth 2023-2028 (%)
- Exhibits42: Chart on Others - Market size and forecast 2023-2028 ($ billion)
- Exhibits43: Data Table on Others - Market size and forecast 2023-2028 ($ billion)
- Exhibits44: Chart on Others - Year-over-year growth 2023-2028 (%)
- Exhibits45: Data Table on Others - Year-over-year growth 2023-2028 (%)
- Exhibits46: Market opportunity by Application ($ billion)
- Exhibits47: Data Table on Market opportunity by Application ($ billion)
- Exhibits48: Chart on Technology - Market share 2023-2028 (%)
- Exhibits49: Data Table on Technology - Market share 2023-2028 (%)
- Exhibits50: Chart on Comparison by Technology
- Exhibits51: Data Table on Comparison by Technology
- Exhibits52: Chart on Electrochromic - Market size and forecast 2023-2028 ($ billion)
- Exhibits53: Data Table on Electrochromic - Market size and forecast 2023-2028 ($ billion)
- Exhibits54: Chart on Electrochromic - Year-over-year growth 2023-2028 (%)
- Exhibits55: Data Table on Electrochromic - Year-over-year growth 2023-2028 (%)
- Exhibits56: Chart on Suspended particle devices - Market size and forecast 2023-2028 ($ billion)
- Exhibits57: Data Table on Suspended particle devices - Market size and forecast 2023-2028 ($ billion)
- Exhibits58: Chart on Suspended particle devices - Year-over-year growth 2023-2028 (%)
- Exhibits59: Data Table on Suspended particle devices - Year-over-year growth 2023-2028 (%)
- Exhibits60: Chart on Polymer dispersed liquid crystal - Market size and forecast 2023-2028 ($ billion)
- Exhibits61: Data Table on Polymer dispersed liquid crystal - Market size and forecast 2023-2028 ($ billion)
- Exhibits62: Chart on Polymer dispersed liquid crystal - Year-over-year growth 2023-2028 (%)
- Exhibits63: Data Table on Polymer dispersed liquid crystal - Year-over-year growth 2023-2028 (%)
- Exhibits64: Chart on Photochromic - Market size and forecast 2023-2028 ($ billion)
- Exhibits65: Data Table on Photochromic - Market size and forecast 2023-2028 ($ billion)
- Exhibits66: Chart on Photochromic - Year-over-year growth 2023-2028 (%)
- Exhibits67: Data Table on Photochromic - Year-over-year growth 2023-2028 (%)
- Exhibits68: Chart on Thermochromics and microblind - Market size and forecast 2023-2028 ($ billion)
- Exhibits69: Data Table on Thermochromics and microblind - Market size and forecast 2023-2028 ($ billion)
- Exhibits70: Chart on Thermochromics and microblind - Year-over-year growth 2023-2028 (%)
- Exhibits71: Data Table on Thermochromics and microblind - Year-over-year growth 2023-2028 (%)
- Exhibits72: Market opportunity by Technology ($ billion)
- Exhibits73: Data Table on Market opportunity by Technology ($ billion)
- Exhibits74: Analysis of price sensitivity, lifecycle, customer purchase basket, adoption rates, and purchase criteria
- Exhibits75: Chart on Market share By Geographical Landscape 2023-2028 (%)
- Exhibits76: Data Table on Market share By Geographical Landscape 2023-2028 (%)
- Exhibits77: Chart on Geographic comparison
- Exhibits78: Data Table on Geographic comparison
- Exhibits79: Chart on North America - Market size and forecast 2023-2028 ($ billion)
- Exhibits80: Data Table on North America - Market size and forecast 2023-2028 ($ billion)
- Exhibits81: Chart on North America - Year-over-year growth 2023-2028 (%)
- Exhibits82: Data Table on North America - Year-over-year growth 2023-2028 (%)
- Exhibits83: Chart on Europe - Market size and forecast 2023-2028 ($ billion)
- Exhibits84: Data Table on Europe - Market size and forecast 2023-2028 ($ billion)
- Exhibits85: Chart on Europe - Year-over-year growth 2023-2028 (%)
- Exhibits86: Data Table on Europe - Year-over-year growth 2023-2028 (%)
- Exhibits87: Chart on APAC - Market size and forecast 2023-2028 ($ billion)
- Exhibits88: Data Table on APAC - Market size and forecast 2023-2028 ($ billion)
- Exhibits89: Chart on APAC - Year-over-year growth 2023-2028 (%)
- Exhibits90: Data Table on APAC - Year-over-year growth 2023-2028 (%)
- Exhibits91: Chart on South America - Market size and forecast 2023-2028 ($ billion)
- Exhibits92: Data Table on South America - Market size and forecast 2023-2028 ($ billion)
- Exhibits93: Chart on South America - Year-over-year growth 2023-2028 (%)
- Exhibits94: Data Table on South America - Year-over-year growth 2023-2028 (%)
- Exhibits95: Chart on Middle East and Africa - Market size and forecast 2023-2028 ($ billion)
- Exhibits96: Data Table on Middle East and Africa - Market size and forecast 2023-2028 ($ billion)
- Exhibits97: Chart on Middle East and Africa - Year-over-year growth 2023-2028 (%)
- Exhibits98: Data Table on Middle East and Africa - Year-over-year growth 2023-2028 (%)
- Exhibits99: Chart on US - Market size and forecast 2023-2028 ($ billion)
- Exhibits100: Data Table on US - Market size and forecast 2023-2028 ($ billion)
- Exhibits101: Chart on US - Year-over-year growth 2023-2028 (%)
- Exhibits102: Data Table on US - Year-over-year growth 2023-2028 (%)
- Exhibits103: Chart on China - Market size and forecast 2023-2028 ($ billion)
- Exhibits104: Data Table on China - Market size and forecast 2023-2028 ($ billion)
- Exhibits105: Chart on China - Year-over-year growth 2023-2028 (%)
- Exhibits106: Data Table on China - Year-over-year growth 2023-2028 (%)
- Exhibits107: Chart on Germany - Market size and forecast 2023-2028 ($ billion)
- Exhibits108: Data Table on Germany - Market size and forecast 2023-2028 ($ billion)
- Exhibits109: Chart on Germany - Year-over-year growth 2023-2028 (%)
- Exhibits110: Data Table on Germany - Year-over-year growth 2023-2028 (%)
- Exhibits111: Chart on France - Market size and forecast 2023-2028 ($ billion)
- Exhibits112: Data Table on France - Market size and forecast 2023-2028 ($ billion)
- Exhibits113: Chart on France - Year-over-year growth 2023-2028 (%)
- Exhibits114: Data Table on France - Year-over-year growth 2023-2028 (%)
- Exhibits115: Chart on Japan - Market size and forecast 2023-2028 ($ billion)
- Exhibits116: Data Table on Japan - Market size and forecast 2023-2028 ($ billion)
- Exhibits117: Chart on Japan - Year-over-year growth 2023-2028 (%)
- Exhibits118: Data Table on Japan - Year-over-year growth 2023-2028 (%)
- Exhibits119: Market opportunity By Geographical Landscape ($ billion)
- Exhibits120: Data Tables on Market opportunity By Geographical Landscape ($ billion)
- Exhibits121: Impact of drivers and challenges in 2023 and 2028
- Exhibits122: Overview on Criticality of inputs and Factors of differentiation
- Exhibits123: Overview on factors of disruption
- Exhibits124: Impact of key risks on business
- Exhibits125: Vendors covered
- Exhibits126: Matrix on vendor position and classification
- Exhibits127: 3M Co. - Overview
- Exhibits128: 3M Co. - Business segments
- Exhibits129: 3M Co. - Key news
- Exhibits130: 3M Co. - Key offerings
- Exhibits131: 3M Co. - Segment focus
- Exhibits132: AGC Inc. - Overview
- Exhibits133: AGC Inc. - Business segments
- Exhibits134: AGC Inc. - Key news
- Exhibits135: AGC Inc. - Key offerings
- Exhibits136: AGC Inc. - Segment focus
- Exhibits137: BASF SE - Overview
- Exhibits138: BASF SE - Business segments
- Exhibits139: BASF SE - Key news
- Exhibits140: BASF SE - Key offerings
- Exhibits141: BASF SE - Segment focus
- Exhibits142: Cardinal Glass Industries Inc. - Overview
- Exhibits143: Cardinal Glass Industries Inc. - Product / Service
- Exhibits144: Cardinal Glass Industries Inc. - Key offerings
- Exhibits145: Corning Inc. - Overview
- Exhibits146: Corning Inc. - Business segments
- Exhibits147: Corning Inc. - Key news
- Exhibits148: Corning Inc. - Key offerings
- Exhibits149: Corning Inc. - Segment focus
- Exhibits150: Gauzy Ltd. - Overview
- Exhibits151: Gauzy Ltd. - Product / Service
- Exhibits152: Gauzy Ltd. - Key offerings
- Exhibits153: Halio Inc. - Overview
- Exhibits154: Halio Inc. - Product / Service
- Exhibits155: Halio Inc. - Key offerings
- Exhibits156: Nippon Sheet Glass Co. Ltd. - Overview
- Exhibits157: Nippon Sheet Glass Co. Ltd. - Business segments
- Exhibits158: Nippon Sheet Glass Co. Ltd. - Key news
- Exhibits159: Nippon Sheet Glass Co. Ltd. - Key offerings
- Exhibits160: Nippon Sheet Glass Co. Ltd. - Segment focus
- Exhibits161: Polytronix Inc. - Overview
- Exhibits162: Polytronix Inc. - Product / Service
- Exhibits163: Polytronix Inc. - Key offerings
- Exhibits164: PPG Industries Inc. - Overview
- Exhibits165: PPG Industries Inc. - Business segments
- Exhibits166: PPG Industries Inc. - Key offerings
- Exhibits167: PPG Industries Inc. - Segment focus
- Exhibits168: Research frontiers Inc - Overview
- Exhibits169: Research frontiers Inc - Product / Service
- Exhibits170: Research frontiers Inc - Key offerings
- Exhibits171: Smart Glass Technologies, LLC - Overview
- Exhibits172: Smart Glass Technologies, LLC - Product / Service
- Exhibits173: Smart Glass Technologies, LLC - Key offerings
- Exhibits174: SmartGlass International - Overview
- Exhibits175: SmartGlass International - Product / Service
- Exhibits176: SmartGlass International - Key offerings
- Exhibits177: The Saint Gobain Group - Overview
- Exhibits178: The Saint Gobain Group - Product / Service
- Exhibits179: The Saint Gobain Group - Key offerings
- Exhibits180: Xinology Co. Ltd. - Overview
- Exhibits181: Xinology Co. Ltd. - Product / Service
- Exhibits182: Xinology Co. Ltd. - Key offerings
- Exhibits183: Inclusions checklist
- Exhibits184: Exclusions checklist
- Exhibits185: Currency conversion rates for US$
- Exhibits186: Research methodology
- Exhibits187: Validation techniques employed for market sizing
- Exhibits188: Information sources
- Exhibits189: List of abbreviations
The smart glass market is forecasted to grow by USD 8.70 bn during 2023-2028, accelerating at a CAGR of 16.1% during the forecast period. The report on the smart glass market provides a holistic analysis, market size and forecast, trends, growth drivers, and challenges, as well as vendor analysis covering around 25 vendors.
The report offers an up-to-date analysis regarding the current market scenario, the latest trends and drivers, and the overall market environment. The market is driven by advancements in smart glass technologies, rising use of smart glass in healthcare applications, and growing use of smart glass in aircraft.
Technavio's smart glass market is segmented as below:
| Market Scope | |
|---|---|
| Base Year | 2024 |
| End Year | 2028 |
| Series Year | 2024-2028 |
| Growth Momentum | Accelerate |
| YOY 2024 | 15.28% |
| CAGR | 16.1% |
| Incremental Value | $8.70bn |
By Application
- Infrastructural development
- Transportation
- Others
By Technology
- Electrochromic
- Suspended particle devices
- Polymer dispersed liquid crystal
- Photochromic
- Thermochromics and microblind
By Geographical Landscape
- North America
- Europe
- APAC
- South America
- Middle East and Africa
This study identifies the integration of smart glass with IoT as one of the prime reasons driving the smart glass market growth during the next few years. Also, growing adoption of energy-efficient solutions and rise in smart city initiatives globally will lead to sizable demand in the market.
The report on the smart glass market covers the following areas:
- Smart glass market sizing
- Smart glass market forecast
- Smart glass market industry analysis
The robust vendor analysis is designed to help clients improve their market position, and in line with this, this report provides a detailed analysis of several leading smart glass market vendors that include 3M Co., AGC Inc., BASF SE, Cardinal Glass Industries Inc., Carlex Glass America LLC, ChromoGenics AB, Corning Inc., Gauzy Ltd., Gentex Corp., Halio Inc., Nippon Sheet Glass Co. Ltd., Polytronix Inc., PPG Industries Inc., RavenWindow, Research frontiers Inc, Smart Glass Technologies, LLC, SmartGlass International, The Saint Gobain Group, View Inc, and Xinology Co. Ltd.. Also, the smart glass market analysis report includes information on upcoming trends and challenges that will influence market growth. This is to help companies strategize and leverage all forthcoming growth opportunities.
The study was conducted using an objective combination of primary and secondary information including inputs from key participants in the industry. The report contains a comprehensive market and vendor landscape in addition to an analysis of the key vendors.
The publisher presents a detailed picture of the market by the way of study, synthesis, and summation of data from multiple sources by an analysis of key parameters such as profit, pricing, competition, and promotions. It presents various market facets by identifying the key industry influencers. The data presented is comprehensive, reliable, and a result of extensive research - both primary and secondary. The market research reports provide a complete competitive landscape and an in-depth vendor selection methodology and analysis using qualitative and quantitative research to forecast the accurate market growth.
Table of Contents
1 Executive Summary
- 1.1 Market overview
2 Market Landscape
- 2.1 Market ecosystem
3 Market Sizing
- 3.1 Market definition
- 3.2 Market segment analysis
- 3.3 Market size 2023
- 3.4 Market outlook: Forecast for 2023-2028
4 Historic Market Size
- 4.1 Global smart glass market 2018 - 2022
- 4.2 Application Segment Analysis 2018 - 2022
- 4.3 Technology Segment Analysis 2018 - 2022
- 4.4 Geography Segment Analysis 2018 - 2022
- 4.5 Country Segment Analysis 2018 - 2022
5 Five Forces Analysis
- 5.1 Five forces summary
- 5.2 Bargaining power of buyers
- 5.3 Bargaining power of suppliers
- 5.4 Threat of new entrants
- 5.5 Threat of substitutes
- 5.6 Threat of rivalry
- 5.7 Market condition
6 Market Segmentation by Application
- 6.1 Market segments
- 6.2 Comparison by Application
- 6.3 Infrastructural development - Market size and forecast 2023-2028
- 6.4 Transportation - Market size and forecast 2023-2028
- 6.5 Others - Market size and forecast 2023-2028
- 6.6 Market opportunity by Application
7 Market Segmentation by Technology
- 7.1 Market segments
- 7.2 Comparison by Technology
- 7.3 Electrochromic - Market size and forecast 2023-2028
- 7.4 Suspended particle devices - Market size and forecast 2023-2028
- 7.5 Polymer dispersed liquid crystal - Market size and forecast 2023-2028
- 7.6 Photochromic - Market size and forecast 2023-2028
- 7.7 Thermochromics and microblind - Market size and forecast 2023-2028
- 7.8 Market opportunity by Technology
8 Customer Landscape
- 8.1 Customer landscape overview
9 Geographic Landscape
- 9.1 Geographic segmentation
- 9.2 Geographic comparison
- 9.3 North America - Market size and forecast 2023-2028
- 9.4 Europe - Market size and forecast 2023-2028
- 9.5 APAC - Market size and forecast 2023-2028
- 9.6 South America - Market size and forecast 2023-2028
- 9.7 Middle East and Africa - Market size and forecast 2023-2028
- 9.8 US - Market size and forecast 2023-2028
- 9.9 China - Market size and forecast 2023-2028
- 9.10 Germany - Market size and forecast 2023-2028
- 9.11 France - Market size and forecast 2023-2028
- 9.12 Japan - Market size and forecast 2023-2028
- 9.13 Market opportunity By Geographical Landscape
10 Drivers, Challenges, and Trends
- 10.1 Market drivers
- 10.2 Market challenges
- 10.3 Impact of drivers and challenges
- 10.4 Market trends
11 Vendor Landscape
- 11.1 Overview
- 11.2 Vendor landscape
- 11.3 Landscape disruption
- 11.4 Industry risks
12 Vendor Analysis
- 12.1 Vendors covered
- 12.2 Market positioning of vendors
- 12.3 3M Co.
- 12.4 AGC Inc.
- 12.5 BASF SE
- 12.6 Cardinal Glass Industries Inc.
- 12.7 Corning Inc.
- 12.8 Gauzy Ltd.
- 12.9 Halio Inc.
- 12.10 Nippon Sheet Glass Co. Ltd.
- 12.11 Polytronix Inc.
- 12.12 PPG Industries Inc.
- 12.13 Research frontiers Inc
- 12.14 Smart Glass Technologies, LLC
- 12.15 SmartGlass International
- 12.16 The Saint Gobain Group
- 12.17 Xinology Co. Ltd.
13 Appendix
- 13.1 Scope of the report
- 13.2 Inclusions and exclusions checklist
- 13.3 Currency conversion rates for US$
- 13.4 Research methodology
- 13.5 List of abbreviations

