|
|
市場調査レポート
商品コード
1709691
昆虫忌避剤の世界市場 2025-2029年Global Insect Repellent Market 2025-2029 |
||||||

|
|||||||
カスタマイズ可能
|
|||||||


| 昆虫忌避剤の世界市場 2025-2029年 |
|
出版日: 2025年04月03日
発行: TechNavio
ページ情報: 英文 234 Pages
納期: 即納可能
|

全表示
- 概要
- 図表
- 目次
昆虫忌避剤市場は2024-2029年に32億6,270万米ドル、予測期間中のCAGRは7.2%で成長すると予測されます。
当レポートでは、昆虫忌避剤市場の全体的な分析、市場規模・予測、動向、成長促進要因、課題、約25のベンダーを網羅したベンダー分析などを掲載しています。
現在の市場シナリオ、最新動向と促進要因、市場環境全体に関する最新分析を提供しています。市場は、オーガニック昆虫忌避剤製品に対する需要、アウトドア活動の増加による昆虫忌避剤製品に対する需要の増加、媒介性疾患の増加が牽引しています。
| 市場範囲 | |
|---|---|
| 基準年 | 2025 |
| 終了年 | 2029 |
| 予測期間 | 2025-2029 |
| 成長モメンタム | 加速 |
| 前年比2025年 | 6.5% |
| CAGR | 7.2% |
| 増分額 | 32億6,270万米ドル |
本調査は、業界の主要参加者からのインプットを含め、一次情報と二次情報を客観的に組み合わせて実施しました。レポートには、主要企業の分析に加え、包括的な市場規模データ、地域分析によるセグメント、ベンダー情勢が含まれています。レポートには過去データと予測データがあります。
本調査では、今後数年間の昆虫忌避剤市場の成長を促進する主な理由の一つとして、従来のディート含有製品に対する昆虫忌避剤生地の優位性を挙げています。また、抗ウイルス・殺菌効果のある防虫剤や蚊を寄せ付けない低粘度シリコーンオイルを開発するための研究開発への投資も、市場の大きな需要につながると思われます。
目次
第1章 エグゼクティブサマリー
- 市場概要
第2章 Technavio分析
- 価格・ライフサイクル・顧客購入バスケット・採用率・購入基準の分析
- インプットの重要性と差別化の要因
- 混乱の要因
- 促進要因と課題の影響
第3章 市場情勢
- 市場エコシステム
- 市場の特徴
- バリューチェーン分析
第4章 市場規模
- 市場の定義
- 市場セグメント分析
- 市場規模 2024
- 市場の見通し 2024-2029
第5章 市場規模実績
- 昆虫忌避剤の世界市場 2019-2023
- 流通チャネルセグメント分析 2019-2023
- 製品セグメント分析 2019-2023
- タイプセグメント分析 2019-2023
- 製品タイプセグメント分析 2019-2023
- 地域別セグメント分析 2019-2023
- 国別セグメント分析 2019-2023
第6章 定性分析
- AIの影響:昆虫忌避剤の世界市場
第7章 ファイブフォース分析
- ファイブフォースの要約
- 買い手の交渉力
- 供給企業の交渉力
- 新規参入業者の脅威
- 代替品の脅威
- 競争の脅威
- 市況
第8章 市場セグメンテーション:流通チャネル別
- 市場セグメント
- 比較:流通チャネル別
- オフライン:市場規模と予測 2024-2029
- オンライン:市場規模と予測 2024-2029
- 市場機会:流通チャネル別
第9章 市場セグメンテーション:製品別
- 市場セグメント
- 比較:製品別
- 気化器:市場規模と予測 2024-2029
- スプレー:市場規模と予測 2024-2029
- クリームとオイル:市場規模と予測 2024-2029
- コイル:市場規模と予測 2024-2029
- その他:市場規模と予測 2024-2029
- 市場機会:製品別
第10章 市場セグメンテーション:タイプ別
- 市場セグメント
- 比較:タイプ別
- 蚊よけ:市場規模と予測 2024-2029
- 虫除け:市場規模と予測 2024-2029
- 市場機会:タイプ別
第11章 市場セグメンテーション:製品タイプ別
- 市場セグメント
- 比較:製品タイプ別
- 合成:市場規模と予測 2024-2029
- 天然:市場規模と予測 2024-2029
- 市場機会:製品タイプ別
第12章 顧客情勢
- 顧客情勢の概要
第13章 地域別情勢
- 地域別セグメンテーション
- 地域別比較
- アジア太平洋:市場規模と予測 2024-2029
- 欧州:市場規模と予測 2024-2029
- 北米:市場規模と予測 2024-2029
- 南米:市場規模と予測 2024-2029
- 中東・アフリカ:市場規模と予測 2024-2029
- 米国:市場規模と予測 2024-2029
- 中国:市場規模と予測 2024-2029
- インド:市場規模と予測 2024-2029
- 日本:市場規模と予測 2024-2029
- ドイツ:市場規模と予測 2024-2029
- 英国:市場規模と予測 2024-2029
- フランス:市場規模と予測 2024-2029
- ブラジル:市場規模と予測 2024-2029
- インドネシア:市場規模と予測 2024-2029
- オーストラリア:市場規模と予測 2024-2029
- 市場機会:地域情勢別
第14章 促進要因・課題・機会・抑制要因
- 市場促進要因
- 市場の課題
- 促進要因と課題の影響
- 市場の機会・抑制要因
第15章 競合情勢
- 概要
- 競合情勢
- 混乱の状況
- 業界のリスク
第16章 競合分析
- 企業プロファイル
- 企業ランキング指数
- 企業の市場ポジショニング
- Aspectek
- Eco Lips Inc.
- Flowtron
- Foshan GreenYellow Electric Technology Co. Ltd.
- FUTURA DIRECT LTD.
- JT Eaton and Co. Inc.
- Koolatron
- Livin Well
- NSI Industries LLC
- Pure Energy Apothecary
- Rentokil Initial Plc
- SereneLife Home LLC
- Thermacell Repellents Inc.
- Trademark Global LLC
- Woodstream Corp.
第17章 付録
Exhibits:
- Exhibits1: Executive Summary - Chart on Market Overview
- Exhibits2: Executive Summary - Data Table on Market Overview
- Exhibits3: Executive Summary - Chart on Global Market Characteristics
- Exhibits4: Executive Summary - Chart on Market By Geographical Landscape
- Exhibits5: Executive Summary - Chart on Market Segmentation by Distribution Channel
- Exhibits6: Executive Summary - Chart on Market Segmentation by Product
- Exhibits7: Executive Summary - Chart on Market Segmentation by Type
- Exhibits8: Executive Summary - Chart on Market Segmentation by Product Type
- Exhibits9: Executive Summary - Chart on Incremental Growth
- Exhibits10: Executive Summary - Data Table on Incremental Growth
- Exhibits11: Executive Summary - Chart on Company Market Positioning
- Exhibits12: Analysis of price sensitivity, lifecycle, customer purchase basket, adoption rates, and purchase criteria
- Exhibits13: Overview on criticality of inputs and factors of differentiation
- Exhibits14: Overview on factors of disruption
- Exhibits15: Impact of drivers and challenges in 2024 and 2029
- Exhibits16: Parent Market
- Exhibits17: Data Table on - Parent Market
- Exhibits18: Market characteristics analysis
- Exhibits19: Value chain analysis
- Exhibits20: Offerings of companies included in the market definition
- Exhibits21: Market segments
- Exhibits22: Chart on Global - Market size and forecast 2024-2029 ($ million)
- Exhibits23: Data Table on Global - Market size and forecast 2024-2029 ($ million)
- Exhibits24: Chart on Global Market: Year-over-year growth 2024-2029 (%)
- Exhibits25: Data Table on Global Market: Year-over-year growth 2024-2029 (%)
- Exhibits26: Historic Market Size - Data Table on Global Insect Repellent Market 2019 - 2023 ($ million)
- Exhibits27: Historic Market Size - Distribution Channel Segment 2019 - 2023 ($ million)
- Exhibits28: Historic Market Size - Product Segment 2019 - 2023 ($ million)
- Exhibits29: Historic Market Size - Type Segment 2019 - 2023 ($ million)
- Exhibits30: Historic Market Size - Product Type Segment 2019 - 2023 ($ million)
- Exhibits31: Historic Market Size - Geography Segment 2019 - 2023 ($ million)
- Exhibits32: Historic Market Size - Country Segment 2019 - 2023 ($ million)
- Exhibits33: Five forces analysis - Comparison between 2024 and 2029
- Exhibits34: Bargaining power of buyers - Impact of key factors 2024 and 2029
- Exhibits35: Bargaining power of suppliers - Impact of key factors in 2024 and 2029
- Exhibits36: Threat of new entrants - Impact of key factors in 2024 and 2029
- Exhibits37: Threat of substitutes - Impact of key factors in 2024 and 2029
- Exhibits38: Threat of rivalry - Impact of key factors in 2024 and 2029
- Exhibits39: Chart on Market condition - Five forces 2024 and 2029
- Exhibits40: Chart on Distribution Channel - Market share 2024-2029 (%)
- Exhibits41: Data Table on Distribution Channel - Market share 2024-2029 (%)
- Exhibits42: Chart on Comparison by Distribution Channel
- Exhibits43: Data Table on Comparison by Distribution Channel
- Exhibits44: Chart on Offline - Market size and forecast 2024-2029 ($ million)
- Exhibits45: Data Table on Offline - Market size and forecast 2024-2029 ($ million)
- Exhibits46: Chart on Offline - Year-over-year growth 2024-2029 (%)
- Exhibits47: Data Table on Offline - Year-over-year growth 2024-2029 (%)
- Exhibits48: Chart on Online - Market size and forecast 2024-2029 ($ million)
- Exhibits49: Data Table on Online - Market size and forecast 2024-2029 ($ million)
- Exhibits50: Chart on Online - Year-over-year growth 2024-2029 (%)
- Exhibits51: Data Table on Online - Year-over-year growth 2024-2029 (%)
- Exhibits52: Market opportunity by Distribution Channel ($ million)
- Exhibits53: Data Table on Market opportunity by Distribution Channel ($ million)
- Exhibits54: Chart on Product - Market share 2024-2029 (%)
- Exhibits55: Data Table on Product - Market share 2024-2029 (%)
- Exhibits56: Chart on Comparison by Product
- Exhibits57: Data Table on Comparison by Product
- Exhibits58: Chart on Vaporizers - Market size and forecast 2024-2029 ($ million)
- Exhibits59: Data Table on Vaporizers - Market size and forecast 2024-2029 ($ million)
- Exhibits60: Chart on Vaporizers - Year-over-year growth 2024-2029 (%)
- Exhibits61: Data Table on Vaporizers - Year-over-year growth 2024-2029 (%)
- Exhibits62: Chart on Sprays - Market size and forecast 2024-2029 ($ million)
- Exhibits63: Data Table on Sprays - Market size and forecast 2024-2029 ($ million)
- Exhibits64: Chart on Sprays - Year-over-year growth 2024-2029 (%)
- Exhibits65: Data Table on Sprays - Year-over-year growth 2024-2029 (%)
- Exhibits66: Chart on Cream and oils - Market size and forecast 2024-2029 ($ million)
- Exhibits67: Data Table on Cream and oils - Market size and forecast 2024-2029 ($ million)
- Exhibits68: Chart on Cream and oils - Year-over-year growth 2024-2029 (%)
- Exhibits69: Data Table on Cream and oils - Year-over-year growth 2024-2029 (%)
- Exhibits70: Chart on Coils - Market size and forecast 2024-2029 ($ million)
- Exhibits71: Data Table on Coils - Market size and forecast 2024-2029 ($ million)
- Exhibits72: Chart on Coils - Year-over-year growth 2024-2029 (%)
- Exhibits73: Data Table on Coils - Year-over-year growth 2024-2029 (%)
- Exhibits74: Chart on Others - Market size and forecast 2024-2029 ($ million)
- Exhibits75: Data Table on Others - Market size and forecast 2024-2029 ($ million)
- Exhibits76: Chart on Others - Year-over-year growth 2024-2029 (%)
- Exhibits77: Data Table on Others - Year-over-year growth 2024-2029 (%)
- Exhibits78: Market opportunity by Product ($ million)
- Exhibits79: Data Table on Market opportunity by Product ($ million)
- Exhibits80: Chart on Type - Market share 2024-2029 (%)
- Exhibits81: Data Table on Type - Market share 2024-2029 (%)
- Exhibits82: Chart on Comparison by Type
- Exhibits83: Data Table on Comparison by Type
- Exhibits84: Chart on Mosquito repellent - Market size and forecast 2024-2029 ($ million)
- Exhibits85: Data Table on Mosquito repellent - Market size and forecast 2024-2029 ($ million)
- Exhibits86: Chart on Mosquito repellent - Year-over-year growth 2024-2029 (%)
- Exhibits87: Data Table on Mosquito repellent - Year-over-year growth 2024-2029 (%)
- Exhibits88: Chart on Bug repellent - Market size and forecast 2024-2029 ($ million)
- Exhibits89: Data Table on Bug repellent - Market size and forecast 2024-2029 ($ million)
- Exhibits90: Chart on Bug repellent - Year-over-year growth 2024-2029 (%)
- Exhibits91: Data Table on Bug repellent - Year-over-year growth 2024-2029 (%)
- Exhibits92: Market opportunity by Type ($ million)
- Exhibits93: Data Table on Market opportunity by Type ($ million)
- Exhibits94: Chart on Product Type - Market share 2024-2029 (%)
- Exhibits95: Data Table on Product Type - Market share 2024-2029 (%)
- Exhibits96: Chart on Comparison by Product Type
- Exhibits97: Data Table on Comparison by Product Type
- Exhibits98: Chart on Synthetic - Market size and forecast 2024-2029 ($ million)
- Exhibits99: Data Table on Synthetic - Market size and forecast 2024-2029 ($ million)
- Exhibits100: Chart on Synthetic - Year-over-year growth 2024-2029 (%)
- Exhibits101: Data Table on Synthetic - Year-over-year growth 2024-2029 (%)
- Exhibits102: Chart on Natural - Market size and forecast 2024-2029 ($ million)
- Exhibits103: Data Table on Natural - Market size and forecast 2024-2029 ($ million)
- Exhibits104: Chart on Natural - Year-over-year growth 2024-2029 (%)
- Exhibits105: Data Table on Natural - Year-over-year growth 2024-2029 (%)
- Exhibits106: Market opportunity by Product Type ($ million)
- Exhibits107: Data Table on Market opportunity by Product Type ($ million)
- Exhibits108: Analysis of price sensitivity, lifecycle, customer purchase basket, adoption rates, and purchase criteria
- Exhibits109: Chart on Market share By Geographical Landscape 2024-2029 (%)
- Exhibits110: Data Table on Market share By Geographical Landscape 2024-2029 (%)
- Exhibits111: Chart on Geographic comparison
- Exhibits112: Data Table on Geographic comparison
- Exhibits113: Chart on APAC - Market size and forecast 2024-2029 ($ million)
- Exhibits114: Data Table on APAC - Market size and forecast 2024-2029 ($ million)
- Exhibits115: Chart on APAC - Year-over-year growth 2024-2029 (%)
- Exhibits116: Data Table on APAC - Year-over-year growth 2024-2029 (%)
- Exhibits117: Chart on Europe - Market size and forecast 2024-2029 ($ million)
- Exhibits118: Data Table on Europe - Market size and forecast 2024-2029 ($ million)
- Exhibits119: Chart on Europe - Year-over-year growth 2024-2029 (%)
- Exhibits120: Data Table on Europe - Year-over-year growth 2024-2029 (%)
- Exhibits121: Chart on North America - Market size and forecast 2024-2029 ($ million)
- Exhibits122: Data Table on North America - Market size and forecast 2024-2029 ($ million)
- Exhibits123: Chart on North America - Year-over-year growth 2024-2029 (%)
- Exhibits124: Data Table on North America - Year-over-year growth 2024-2029 (%)
- Exhibits125: Chart on South America - Market size and forecast 2024-2029 ($ million)
- Exhibits126: Data Table on South America - Market size and forecast 2024-2029 ($ million)
- Exhibits127: Chart on South America - Year-over-year growth 2024-2029 (%)
- Exhibits128: Data Table on South America - Year-over-year growth 2024-2029 (%)
- Exhibits129: Chart on Middle East and Africa - Market size and forecast 2024-2029 ($ million)
- Exhibits130: Data Table on Middle East and Africa - Market size and forecast 2024-2029 ($ million)
- Exhibits131: Chart on Middle East and Africa - Year-over-year growth 2024-2029 (%)
- Exhibits132: Data Table on Middle East and Africa - Year-over-year growth 2024-2029 (%)
- Exhibits133: Chart on US - Market size and forecast 2024-2029 ($ million)
- Exhibits134: Data Table on US - Market size and forecast 2024-2029 ($ million)
- Exhibits135: Chart on US - Year-over-year growth 2024-2029 (%)
- Exhibits136: Data Table on US - Year-over-year growth 2024-2029 (%)
- Exhibits137: Chart on China - Market size and forecast 2024-2029 ($ million)
- Exhibits138: Data Table on China - Market size and forecast 2024-2029 ($ million)
- Exhibits139: Chart on China - Year-over-year growth 2024-2029 (%)
- Exhibits140: Data Table on China - Year-over-year growth 2024-2029 (%)
- Exhibits141: Chart on India - Market size and forecast 2024-2029 ($ million)
- Exhibits142: Data Table on India - Market size and forecast 2024-2029 ($ million)
- Exhibits143: Chart on India - Year-over-year growth 2024-2029 (%)
- Exhibits144: Data Table on India - Year-over-year growth 2024-2029 (%)
- Exhibits145: Chart on Japan - Market size and forecast 2024-2029 ($ million)
- Exhibits146: Data Table on Japan - Market size and forecast 2024-2029 ($ million)
- Exhibits147: Chart on Japan - Year-over-year growth 2024-2029 (%)
- Exhibits148: Data Table on Japan - Year-over-year growth 2024-2029 (%)
- Exhibits149: Chart on Germany - Market size and forecast 2024-2029 ($ million)
- Exhibits150: Data Table on Germany - Market size and forecast 2024-2029 ($ million)
- Exhibits151: Chart on Germany - Year-over-year growth 2024-2029 (%)
- Exhibits152: Data Table on Germany - Year-over-year growth 2024-2029 (%)
- Exhibits153: Chart on UK - Market size and forecast 2024-2029 ($ million)
- Exhibits154: Data Table on UK - Market size and forecast 2024-2029 ($ million)
- Exhibits155: Chart on UK - Year-over-year growth 2024-2029 (%)
- Exhibits156: Data Table on UK - Year-over-year growth 2024-2029 (%)
- Exhibits157: Chart on France - Market size and forecast 2024-2029 ($ million)
- Exhibits158: Data Table on France - Market size and forecast 2024-2029 ($ million)
- Exhibits159: Chart on France - Year-over-year growth 2024-2029 (%)
- Exhibits160: Data Table on France - Year-over-year growth 2024-2029 (%)
- Exhibits161: Chart on Brazil - Market size and forecast 2024-2029 ($ million)
- Exhibits162: Data Table on Brazil - Market size and forecast 2024-2029 ($ million)
- Exhibits163: Chart on Brazil - Year-over-year growth 2024-2029 (%)
- Exhibits164: Data Table on Brazil - Year-over-year growth 2024-2029 (%)
- Exhibits165: Chart on Indonesia - Market size and forecast 2024-2029 ($ million)
- Exhibits166: Data Table on Indonesia - Market size and forecast 2024-2029 ($ million)
- Exhibits167: Chart on Indonesia - Year-over-year growth 2024-2029 (%)
- Exhibits168: Data Table on Indonesia - Year-over-year growth 2024-2029 (%)
- Exhibits169: Chart on Australia - Market size and forecast 2024-2029 ($ million)
- Exhibits170: Data Table on Australia - Market size and forecast 2024-2029 ($ million)
- Exhibits171: Chart on Australia - Year-over-year growth 2024-2029 (%)
- Exhibits172: Data Table on Australia - Year-over-year growth 2024-2029 (%)
- Exhibits173: Market opportunity By Geographical Landscape ($ million)
- Exhibits174: Data Tables on Market opportunity By Geographical Landscape ($ million)
- Exhibits175: Impact of drivers and challenges in 2024 and 2029
- Exhibits176: Overview on criticality of inputs and factors of differentiation
- Exhibits177: Overview on factors of disruption
- Exhibits178: Impact of key risks on business
- Exhibits179: Companies covered
- Exhibits180: Company ranking index
- Exhibits181: Matrix on companies position and classification
- Exhibits182: Aspectek - Overview
- Exhibits183: Aspectek - Product / Service
- Exhibits184: Aspectek - Key offerings
- Exhibits185: SWOT
- Exhibits186: Eco Lips Inc. - Overview
- Exhibits187: Eco Lips Inc. - Product / Service
- Exhibits188: Eco Lips Inc. - Key offerings
- Exhibits189: SWOT
- Exhibits190: Flowtron - Overview
- Exhibits191: Flowtron - Product / Service
- Exhibits192: Flowtron - Key offerings
- Exhibits193: SWOT
- Exhibits194: Foshan GreenYellow Electric Technology Co. Ltd. - Overview
- Exhibits195: Foshan GreenYellow Electric Technology Co. Ltd. - Product / Service
- Exhibits196: Foshan GreenYellow Electric Technology Co. Ltd. - Key offerings
- Exhibits197: SWOT
- Exhibits198: FUTURA DIRECT LTD. - Overview
- Exhibits199: FUTURA DIRECT LTD. - Product / Service
- Exhibits200: FUTURA DIRECT LTD. - Key offerings
- Exhibits201: SWOT
- Exhibits202: JT Eaton and Co. Inc. - Overview
- Exhibits203: JT Eaton and Co. Inc. - Product / Service
- Exhibits204: JT Eaton and Co. Inc. - Key offerings
- Exhibits205: SWOT
- Exhibits206: Koolatron - Overview
- Exhibits207: Koolatron - Product / Service
- Exhibits208: Koolatron - Key offerings
- Exhibits209: SWOT
- Exhibits210: Livin Well - Overview
- Exhibits211: Livin Well - Product / Service
- Exhibits212: Livin Well - Key offerings
- Exhibits213: SWOT
- Exhibits214: NSI Industries LLC - Overview
- Exhibits215: NSI Industries LLC - Product / Service
- Exhibits216: NSI Industries LLC - Key offerings
- Exhibits217: SWOT
- Exhibits218: Pure Energy Apothecary - Overview
- Exhibits219: Pure Energy Apothecary - Product / Service
- Exhibits220: Pure Energy Apothecary - Key offerings
- Exhibits221: SWOT
- Exhibits222: Rentokil Initial Plc - Overview
- Exhibits223: Rentokil Initial Plc - Business segments
- Exhibits224: Rentokil Initial Plc - Key offerings
- Exhibits225: Rentokil Initial Plc - Segment focus
- Exhibits226: SWOT
- Exhibits227: SereneLife Home LLC - Overview
- Exhibits228: SereneLife Home LLC - Product / Service
- Exhibits229: SereneLife Home LLC - Key offerings
- Exhibits230: SWOT
- Exhibits231: Thermacell Repellents Inc. - Overview
- Exhibits232: Thermacell Repellents Inc. - Product / Service
- Exhibits233: Thermacell Repellents Inc. - Key offerings
- Exhibits234: SWOT
- Exhibits235: Trademark Global LLC - Overview
- Exhibits236: Trademark Global LLC - Product / Service
- Exhibits237: Trademark Global LLC - Key offerings
- Exhibits238: SWOT
- Exhibits239: Woodstream Corp. - Overview
- Exhibits240: Woodstream Corp. - Product / Service
- Exhibits241: Woodstream Corp. - Key offerings
- Exhibits242: SWOT
- Exhibits243: Inclusions checklist
- Exhibits244: Exclusions checklist
- Exhibits245: Currency conversion rates for US$
- Exhibits246: Research methodology
- Exhibits247: Information sources
- Exhibits248: Data validation
- Exhibits249: Validation techniques employed for market sizing
- Exhibits250: Data synthesis
- Exhibits251: 360 degree market analysis
- Exhibits252: List of abbreviations
The insect repellent market is forecasted to grow by USD 3262.7 mn during 2024-2029, accelerating at a CAGR of 7.2% during the forecast period. The report on the insect repellent market provides a holistic analysis, market size and forecast, trends, growth drivers, and challenges, as well as vendor analysis covering around 25 vendors.
The report offers an up-to-date analysis regarding the current market scenario, the latest trends and drivers, and the overall market environment. The market is driven by demand for organic insect repellent products, rising outdoor activities increase demand for insect repellent products, and rise in vector-borne diseases.
| Market Scope | |
|---|---|
| Base Year | 2025 |
| End Year | 2029 |
| Series Year | 2025-2029 |
| Growth Momentum | Accelerate |
| YOY 2025 | 6.5% |
| CAGR | 7.2% |
| Incremental Value | $3262.7 mn |
The study was conducted using an objective combination of primary and secondary information including inputs from key participants in the industry. The report contains a comprehensive market size data, segment with regional analysis and vendor landscape in addition to an analysis of the key companies. Reports have historic and forecast data.
Technavio's insect repellent market is segmented as below:
By Distribution Channel
- Offline
- Online
By Product
- Vaporizers
- Sprays
- Cream and oils
- Coils
- Others
By Type
- Mosquito repellent
- Bug repellent
By Product Type
- Synthetic
- Natural
By Geographical Landscape
- APAC
- Europe
- North America
- South America
- Middle East and Africa
This study identifies the insect repellent fabrics gain advantage over traditional deet containing products as one of the prime reasons driving the insect repellent market growth during the next few years. Also, investment in research and development to develop insect repellents with antiviral and disinfectant properties and low-viscosity silicone oil prevents mosquitoes will lead to sizable demand in the market.
The report on the insect repellent market covers the following areas:
- Insect Repellent Market sizing
- Insect Repellent Market forecast
- Insect Repellent Market industry analysis
The robust vendor analysis is designed to help clients improve their market position, and in line with this, this report provides a detailed analysis of several leading insect repellent market vendors that include Aspectek, BRILLON CONSUMER PRODUCTS PVT. LTD., Eco Lips Inc., Flowtron, Foshan GreenYellow Electric Technology Co. Ltd., FUTURA DIRECT LTD., Helen of Troy Ltd., JT Eaton and Co. Inc., Koolatron, Livin Well, NSI Industries LLC, Pure Energy Apothecary, Reckitt Benckiser Group Plc, Rentokil Initial Plc, Rollins Inc., S.C. Johnson and Son Inc., SereneLife Home LLC, Thermacell Repellents Inc., Trademark Global LLC, and Woodstream Corp.. Also, the insect repellent market analysis report includes information on upcoming trends and challenges that will influence market growth. This is to help companies strategize and leverage all forthcoming growth opportunities.
The publisher presents a detailed picture of the market by the way of study, synthesis, and summation of data from multiple sources by an analysis of key parameters such as profit, pricing, competition, and promotions. It presents various market facets by identifying the key industry influencers. The data presented is comprehensive, reliable, and a result of extensive primary and secondary research. The market research reports provide a complete competitive landscape and an in-depth vendor selection methodology and analysis using qualitative and quantitative research to forecast accurate market growth.
Table of Contents
1 Executive Summary
- 1.1 Market overview
- Executive Summary - Chart on Market Overview
- Executive Summary - Data Table on Market Overview
- Executive Summary - Chart on Global Market Characteristics
- Executive Summary - Chart on Market By Geographical Landscape
- Executive Summary - Chart on Market Segmentation by Distribution Channel
- Executive Summary - Chart on Market Segmentation by Product
- Executive Summary - Chart on Market Segmentation by Type
- Executive Summary - Chart on Market Segmentation by Product Type
- Executive Summary - Chart on Incremental Growth
- Executive Summary - Data Table on Incremental Growth
- Executive Summary - Chart on Company Market Positioning
2 Technavio Analysis
- 2.1 Analysis of price sensitivity, lifecycle, customer purchase basket, adoption rates, and purchase criteria
- Analysis of price sensitivity, lifecycle, customer purchase basket, adoption rates, and purchase criteria
- 2.2 Criticality of inputs and Factors of differentiation
- Overview on criticality of inputs and factors of differentiation
- 2.3 Factors of disruption
- Overview on factors of disruption
- 2.4 Impact of drivers and challenges
- Impact of drivers and challenges in 2024 and 2029
3 Market Landscape
- 3.1 Market ecosystem
- Parent Market
- Data Table on - Parent Market
- 3.2 Market characteristics
- Market characteristics analysis
- 3.3 Value chain analysis
- Value chain analysis
4 Market Sizing
- 4.1 Market definition
- Offerings of companies included in the market definition
- 4.2 Market segment analysis
- Market segments
- 4.3 Market size 2024
- 4.4 Market outlook: Forecast for 2024-2029
- Chart on Global - Market size and forecast 2024-2029 ($ million)
- Data Table on Global - Market size and forecast 2024-2029 ($ million)
- Chart on Global Market: Year-over-year growth 2024-2029 (%)
- Data Table on Global Market: Year-over-year growth 2024-2029 (%)
5 Historic Market Size
- 5.1 Global Insect Repellent Market 2019 - 2023
- Historic Market Size - Data Table on Global Insect Repellent Market 2019 - 2023 ($ million)
- 5.2 Distribution Channel segment analysis 2019 - 2023
- Historic Market Size - Distribution Channel Segment 2019 - 2023 ($ million)
- 5.3 Product segment analysis 2019 - 2023
- Historic Market Size - Product Segment 2019 - 2023 ($ million)
- 5.4 Type segment analysis 2019 - 2023
- Historic Market Size - Type Segment 2019 - 2023 ($ million)
- 5.5 Product Type segment analysis 2019 - 2023
- Historic Market Size - Product Type Segment 2019 - 2023 ($ million)
- 5.6 Geography segment analysis 2019 - 2023
- Historic Market Size - Geography Segment 2019 - 2023 ($ million)
- 5.7 Country segment analysis 2019 - 2023
- Historic Market Size - Country Segment 2019 - 2023 ($ million)
6 Qualitative Analysis
- 6.1 Impact of AI on Global Insect Repellent Market
7 Five Forces Analysis
- 7.1 Five forces summary
- Five forces analysis - Comparison between 2024 and 2029
- 7.2 Bargaining power of buyers
- Bargaining power of buyers - Impact of key factors 2024 and 2029
- 7.3 Bargaining power of suppliers
- Bargaining power of suppliers - Impact of key factors in 2024 and 2029
- 7.4 Threat of new entrants
- Threat of new entrants - Impact of key factors in 2024 and 2029
- 7.5 Threat of substitutes
- Threat of substitutes - Impact of key factors in 2024 and 2029
- 7.6 Threat of rivalry
- Threat of rivalry - Impact of key factors in 2024 and 2029
- 7.7 Market condition
- Chart on Market condition - Five forces 2024 and 2029
8 Market Segmentation by Distribution Channel
- 8.1 Market segments
- Chart on Distribution Channel - Market share 2024-2029 (%)
- Data Table on Distribution Channel - Market share 2024-2029 (%)
- 8.2 Comparison by Distribution Channel
- Chart on Comparison by Distribution Channel
- Data Table on Comparison by Distribution Channel
- 8.3 Offline - Market size and forecast 2024-2029
- Chart on Offline - Market size and forecast 2024-2029 ($ million)
- Data Table on Offline - Market size and forecast 2024-2029 ($ million)
- Chart on Offline - Year-over-year growth 2024-2029 (%)
- Data Table on Offline - Year-over-year growth 2024-2029 (%)
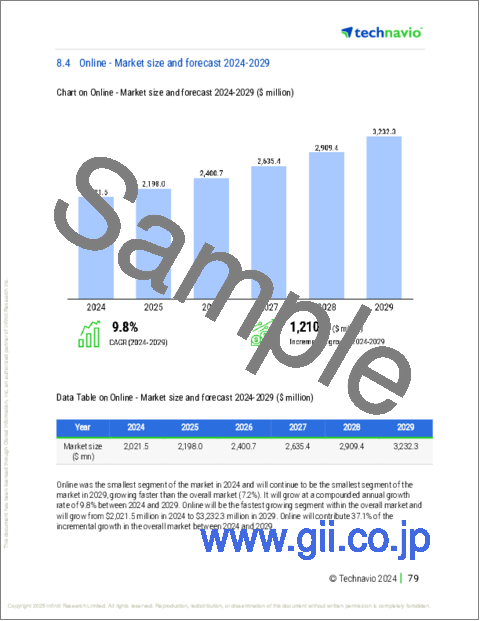
- 8.4 Online - Market size and forecast 2024-2029
- Chart on Online - Market size and forecast 2024-2029 ($ million)
- Data Table on Online - Market size and forecast 2024-2029 ($ million)
- Chart on Online - Year-over-year growth 2024-2029 (%)
- Data Table on Online - Year-over-year growth 2024-2029 (%)
- 8.5 Market opportunity by Distribution Channel
- Market opportunity by Distribution Channel ($ million)
- Data Table on Market opportunity by Distribution Channel ($ million)
9 Market Segmentation by Product
- 9.1 Market segments
- Chart on Product - Market share 2024-2029 (%)
- Data Table on Product - Market share 2024-2029 (%)
- 9.2 Comparison by Product
- Chart on Comparison by Product
- Data Table on Comparison by Product
- 9.3 Vaporizers - Market size and forecast 2024-2029
- Chart on Vaporizers - Market size and forecast 2024-2029 ($ million)
- Data Table on Vaporizers - Market size and forecast 2024-2029 ($ million)
- Chart on Vaporizers - Year-over-year growth 2024-2029 (%)
- Data Table on Vaporizers - Year-over-year growth 2024-2029 (%)
- 9.4 Sprays - Market size and forecast 2024-2029
- Chart on Sprays - Market size and forecast 2024-2029 ($ million)
- Data Table on Sprays - Market size and forecast 2024-2029 ($ million)
- Chart on Sprays - Year-over-year growth 2024-2029 (%)
- Data Table on Sprays - Year-over-year growth 2024-2029 (%)
- 9.5 Cream and oils - Market size and forecast 2024-2029
- Chart on Cream and oils - Market size and forecast 2024-2029 ($ million)
- Data Table on Cream and oils - Market size and forecast 2024-2029 ($ million)
- Chart on Cream and oils - Year-over-year growth 2024-2029 (%)
- Data Table on Cream and oils - Year-over-year growth 2024-2029 (%)
- 9.6 Coils - Market size and forecast 2024-2029
- Chart on Coils - Market size and forecast 2024-2029 ($ million)
- Data Table on Coils - Market size and forecast 2024-2029 ($ million)
- Chart on Coils - Year-over-year growth 2024-2029 (%)
- Data Table on Coils - Year-over-year growth 2024-2029 (%)
- 9.7 Others - Market size and forecast 2024-2029
- Chart on Others - Market size and forecast 2024-2029 ($ million)
- Data Table on Others - Market size and forecast 2024-2029 ($ million)
- Chart on Others - Year-over-year growth 2024-2029 (%)
- Data Table on Others - Year-over-year growth 2024-2029 (%)
- 9.8 Market opportunity by Product
- Market opportunity by Product ($ million)
- Data Table on Market opportunity by Product ($ million)
10 Market Segmentation by Type
- 10.1 Market segments
- Chart on Type - Market share 2024-2029 (%)
- Data Table on Type - Market share 2024-2029 (%)
- 10.2 Comparison by Type
- Chart on Comparison by Type
- Data Table on Comparison by Type
- 10.3 Mosquito repellent - Market size and forecast 2024-2029
- Chart on Mosquito repellent - Market size and forecast 2024-2029 ($ million)
- Data Table on Mosquito repellent - Market size and forecast 2024-2029 ($ million)
- Chart on Mosquito repellent - Year-over-year growth 2024-2029 (%)
- Data Table on Mosquito repellent - Year-over-year growth 2024-2029 (%)
- 10.4 Bug repellent - Market size and forecast 2024-2029
- Chart on Bug repellent - Market size and forecast 2024-2029 ($ million)
- Data Table on Bug repellent - Market size and forecast 2024-2029 ($ million)
- Chart on Bug repellent - Year-over-year growth 2024-2029 (%)
- Data Table on Bug repellent - Year-over-year growth 2024-2029 (%)
- 10.5 Market opportunity by Type
- Market opportunity by Type ($ million)
- Data Table on Market opportunity by Type ($ million)
11 Market Segmentation by Product Type
- 11.1 Market segments
- Chart on Product Type - Market share 2024-2029 (%)
- Data Table on Product Type - Market share 2024-2029 (%)
- 11.2 Comparison by Product Type
- Chart on Comparison by Product Type
- Data Table on Comparison by Product Type
- 11.3 Synthetic - Market size and forecast 2024-2029
- Chart on Synthetic - Market size and forecast 2024-2029 ($ million)
- Data Table on Synthetic - Market size and forecast 2024-2029 ($ million)
- Chart on Synthetic - Year-over-year growth 2024-2029 (%)
- Data Table on Synthetic - Year-over-year growth 2024-2029 (%)
- 11.4 Natural - Market size and forecast 2024-2029
- Chart on Natural - Market size and forecast 2024-2029 ($ million)
- Data Table on Natural - Market size and forecast 2024-2029 ($ million)
- Chart on Natural - Year-over-year growth 2024-2029 (%)
- Data Table on Natural - Year-over-year growth 2024-2029 (%)
- 11.5 Market opportunity by Product Type
- Market opportunity by Product Type ($ million)
- Data Table on Market opportunity by Product Type ($ million)
12 Customer Landscape
- 12.1 Customer landscape overview
- Analysis of price sensitivity, lifecycle, customer purchase basket, adoption rates, and purchase criteria
13 Geographic Landscape
- 13.1 Geographic segmentation
- Chart on Market share By Geographical Landscape 2024-2029 (%)
- Data Table on Market share By Geographical Landscape 2024-2029 (%)
- 13.2 Geographic comparison
- Chart on Geographic comparison
- Data Table on Geographic comparison
- 13.3 APAC - Market size and forecast 2024-2029
- Chart on APAC - Market size and forecast 2024-2029 ($ million)
- Data Table on APAC - Market size and forecast 2024-2029 ($ million)
- Chart on APAC - Year-over-year growth 2024-2029 (%)
- Data Table on APAC - Year-over-year growth 2024-2029 (%)
- 13.4 Europe - Market size and forecast 2024-2029
- Chart on Europe - Market size and forecast 2024-2029 ($ million)
- Data Table on Europe - Market size and forecast 2024-2029 ($ million)
- Chart on Europe - Year-over-year growth 2024-2029 (%)
- Data Table on Europe - Year-over-year growth 2024-2029 (%)
- 13.5 North America - Market size and forecast 2024-2029
- Chart on North America - Market size and forecast 2024-2029 ($ million)
- Data Table on North America - Market size and forecast 2024-2029 ($ million)
- Chart on North America - Year-over-year growth 2024-2029 (%)
- Data Table on North America - Year-over-year growth 2024-2029 (%)
- 13.6 South America - Market size and forecast 2024-2029
- Chart on South America - Market size and forecast 2024-2029 ($ million)
- Data Table on South America - Market size and forecast 2024-2029 ($ million)
- Chart on South America - Year-over-year growth 2024-2029 (%)
- Data Table on South America - Year-over-year growth 2024-2029 (%)
- 13.7 Middle East and Africa - Market size and forecast 2024-2029
- Chart on Middle East and Africa - Market size and forecast 2024-2029 ($ million)
- Data Table on Middle East and Africa - Market size and forecast 2024-2029 ($ million)
- Chart on Middle East and Africa - Year-over-year growth 2024-2029 (%)
- Data Table on Middle East and Africa - Year-over-year growth 2024-2029 (%)
- 13.8 US - Market size and forecast 2024-2029
- Chart on US - Market size and forecast 2024-2029 ($ million)
- Data Table on US - Market size and forecast 2024-2029 ($ million)
- Chart on US - Year-over-year growth 2024-2029 (%)
- Data Table on US - Year-over-year growth 2024-2029 (%)
- 13.9 China - Market size and forecast 2024-2029
- Chart on China - Market size and forecast 2024-2029 ($ million)
- Data Table on China - Market size and forecast 2024-2029 ($ million)
- Chart on China - Year-over-year growth 2024-2029 (%)
- Data Table on China - Year-over-year growth 2024-2029 (%)
- 13.10 India - Market size and forecast 2024-2029
- Chart on India - Market size and forecast 2024-2029 ($ million)
- Data Table on India - Market size and forecast 2024-2029 ($ million)
- Chart on India - Year-over-year growth 2024-2029 (%)
- Data Table on India - Year-over-year growth 2024-2029 (%)
- 13.11 Japan - Market size and forecast 2024-2029
- Chart on Japan - Market size and forecast 2024-2029 ($ million)
- Data Table on Japan - Market size and forecast 2024-2029 ($ million)
- Chart on Japan - Year-over-year growth 2024-2029 (%)
- Data Table on Japan - Year-over-year growth 2024-2029 (%)
- 13.12 Germany - Market size and forecast 2024-2029
- Chart on Germany - Market size and forecast 2024-2029 ($ million)
- Data Table on Germany - Market size and forecast 2024-2029 ($ million)
- Chart on Germany - Year-over-year growth 2024-2029 (%)
- Data Table on Germany - Year-over-year growth 2024-2029 (%)
- 13.13 UK - Market size and forecast 2024-2029
- Chart on UK - Market size and forecast 2024-2029 ($ million)
- Data Table on UK - Market size and forecast 2024-2029 ($ million)
- Chart on UK - Year-over-year growth 2024-2029 (%)
- Data Table on UK - Year-over-year growth 2024-2029 (%)
- 13.14 France - Market size and forecast 2024-2029
- Chart on France - Market size and forecast 2024-2029 ($ million)
- Data Table on France - Market size and forecast 2024-2029 ($ million)
- Chart on France - Year-over-year growth 2024-2029 (%)
- Data Table on France - Year-over-year growth 2024-2029 (%)
- 13.15 Brazil - Market size and forecast 2024-2029
- Chart on Brazil - Market size and forecast 2024-2029 ($ million)
- Data Table on Brazil - Market size and forecast 2024-2029 ($ million)
- Chart on Brazil - Year-over-year growth 2024-2029 (%)
- Data Table on Brazil - Year-over-year growth 2024-2029 (%)
- 13.16 Indonesia - Market size and forecast 2024-2029
- Chart on Indonesia - Market size and forecast 2024-2029 ($ million)
- Data Table on Indonesia - Market size and forecast 2024-2029 ($ million)
- Chart on Indonesia - Year-over-year growth 2024-2029 (%)
- Data Table on Indonesia - Year-over-year growth 2024-2029 (%)
- 13.17 Australia - Market size and forecast 2024-2029
- Chart on Australia - Market size and forecast 2024-2029 ($ million)
- Data Table on Australia - Market size and forecast 2024-2029 ($ million)
- Chart on Australia - Year-over-year growth 2024-2029 (%)
- Data Table on Australia - Year-over-year growth 2024-2029 (%)
- 13.18 Market opportunity By Geographical Landscape
- Market opportunity By Geographical Landscape ($ million)
- Data Tables on Market opportunity By Geographical Landscape ($ million)
14 Drivers, Challenges, and Opportunity/Restraints
- 14.1 Market drivers
- 14.2 Market challenges
- 14.3 Impact of drivers and challenges
- Impact of drivers and challenges in 2024 and 2029
- 14.4 Market opportunities/restraints
15 Competitive Landscape
- 15.1 Overview
- 15.2 Competitive Landscape
- Overview on criticality of inputs and factors of differentiation
- 15.3 Landscape disruption
- Overview on factors of disruption
- 15.4 Industry risks
- Impact of key risks on business
16 Competitive Analysis
- 16.1 Companies profiled
- Companies covered
- 16.2 Company ranking index
- Company ranking index
- 16.3 Market positioning of companies
- Matrix on companies position and classification
- 16.4 Aspectek
- Aspectek - Overview
- Aspectek - Product / Service
- Aspectek - Key offerings
- SWOT
- 16.5 Eco Lips Inc.
- Eco Lips Inc. - Overview
- Eco Lips Inc. - Product / Service
- Eco Lips Inc. - Key offerings
- SWOT
- 16.6 Flowtron
- Flowtron - Overview
- Flowtron - Product / Service
- Flowtron - Key offerings
- SWOT
- 16.7 Foshan GreenYellow Electric Technology Co. Ltd.
- Foshan GreenYellow Electric Technology Co. Ltd. - Overview
- Foshan GreenYellow Electric Technology Co. Ltd. - Product / Service
- Foshan GreenYellow Electric Technology Co. Ltd. - Key offerings
- SWOT
- 16.8 FUTURA DIRECT LTD.
- FUTURA DIRECT LTD. - Overview
- FUTURA DIRECT LTD. - Product / Service
- FUTURA DIRECT LTD. - Key offerings
- SWOT
- 16.9 JT Eaton and Co. Inc.
- JT Eaton and Co. Inc. - Overview
- JT Eaton and Co. Inc. - Product / Service
- JT Eaton and Co. Inc. - Key offerings
- SWOT
- 16.10 Koolatron
- Koolatron - Overview
- Koolatron - Product / Service
- Koolatron - Key offerings
- SWOT
- 16.11 Livin Well
- Livin Well - Overview
- Livin Well - Product / Service
- Livin Well - Key offerings
- SWOT
- 16.12 NSI Industries LLC
- NSI Industries LLC - Overview
- NSI Industries LLC - Product / Service
- NSI Industries LLC - Key offerings
- SWOT
- 16.13 Pure Energy Apothecary
- Pure Energy Apothecary - Overview
- Pure Energy Apothecary - Product / Service
- Pure Energy Apothecary - Key offerings
- SWOT
- 16.14 Rentokil Initial Plc
- Rentokil Initial Plc - Overview
- Rentokil Initial Plc - Business segments
- Rentokil Initial Plc - Key offerings
- Rentokil Initial Plc - Segment focus
- SWOT
- 16.15 SereneLife Home LLC
- SereneLife Home LLC - Overview
- SereneLife Home LLC - Product / Service
- SereneLife Home LLC - Key offerings
- SWOT
- 16.16 Thermacell Repellents Inc.
- Thermacell Repellents Inc. - Overview
- Thermacell Repellents Inc. - Product / Service
- Thermacell Repellents Inc. - Key offerings
- SWOT
- 16.17 Trademark Global LLC
- Trademark Global LLC - Overview
- Trademark Global LLC - Product / Service
- Trademark Global LLC - Key offerings
- SWOT
- 16.18 Woodstream Corp.
- Woodstream Corp. - Overview
- Woodstream Corp. - Product / Service
- Woodstream Corp. - Key offerings
- SWOT
17 Appendix
- 17.1 Scope of the report
- 17.2 Inclusions and exclusions checklist
- Inclusions checklist
- Exclusions checklist
- 17.3 Currency conversion rates for US$
- Currency conversion rates for US$
- 17.4 Research methodology
- Research methodology
- 17.5 Data procurement
- Information sources
- 17.6 Data validation
- Data validation
- 17.7 Validation techniques employed for market sizing
- Validation techniques employed for market sizing
- 17.8 Data synthesis
- Data synthesis
- 17.9 360 degree market analysis
- 360 degree market analysis
- 17.10 List of abbreviations
- List of abbreviations
