|
|
市場調査レポート
商品コード
1685663
アグリビジネスの世界市場 2025~2029年Global Agribusiness Market 2025-2029 |
||||||

|
|||||||
カスタマイズ可能
|
|||||||

| アグリビジネスの世界市場 2025~2029年 |
|
出版日: 2025年03月19日
発行: TechNavio
ページ情報: 英文 237 Pages
納期: 即納可能
|

全表示
- 概要
- 図表
- 目次
アグリビジネス市場は2024-2029年に8億4,340万米ドル、予測期間中のCAGRは4.6%で成長すると予測されます。
当レポートでは、アグリビジネス市場の全体的な分析、市場規模・予測、動向、成長促進要因、課題、約25のベンダーを網羅したベンダー分析などを掲載しています。
現在の市場シナリオ、最新動向と促進要因、市場環境全体に関する最新分析を提供しています。市場は、人口増加による食糧需要の増加、バイオ農薬の高い採用率、農業貿易政策の改善によって牽引されています。
| 市場範囲 | |
|---|---|
| 基準年 | 2025 |
| 終了年 | 2029 |
| 予測期間 | 2025-2029 |
| 成長モメンタム | 加速 |
| 前年比2025年 | 3.7% |
| CAGR | 4.6% |
| 増分額 | 8億4,340万米ドル |
本調査は、業界の主要参加者からのインプットを含め、一次情報と二次情報を客観的に組み合わせて実施しました。レポートには、主要企業の分析に加え、包括的な市場規模データ、地域分析によるセグメント、ベンダー情勢が含まれています。レポートには履歴データと予測データがあります。
本調査では、農業の自動化が今後数年間のアグリビジネス市場の成長を促進する主要な理由の1つであると特定しています。また、アグリビジネスの新たな開発と環境的に持続可能な食品への需要の高まりは、市場の大きな需要につながるでしょう。
目次
第1章 エグゼクティブサマリー
- 市場概要
第2章 Technavio分析
- 価格・ライフサイクル・顧客購入バスケット・採用率・購入基準の分析
- インプットの重要性と差別化の要因
- 混乱の要因
- 促進要因と課題の影響
第3章 市場情勢
- 市場エコシステム
- 市場の特徴
- バリューチェーン分析
第4章 市場規模
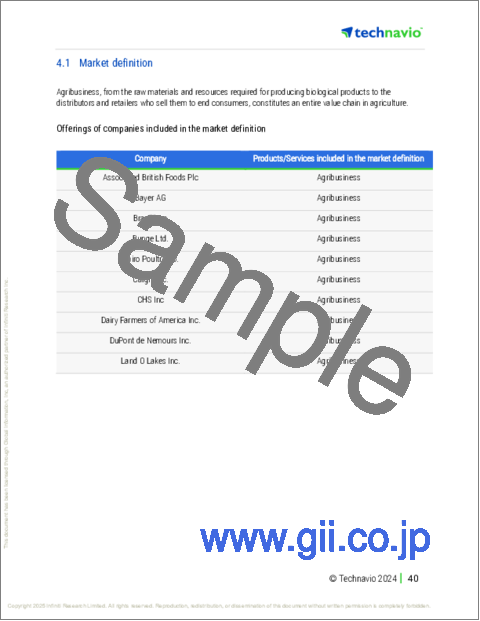
- 市場の定義
- 市場セグメント分析
- 市場規模 2024
- 市場の見通し 2024-2029
第5章 市場規模実績
- アグリビジネスの世界市場 2019-2023
- 製品別セグメント分析 2019-2023
- 用途別セグメント分析 2019-2023
- 技術別セグメント分析 2019-2023
- 流通チャネル別セグメント分析 2019-2023
- 地域別セグメント分析 2019-2023
- 国別セグメント分析 2019-2023
第6章 定性分析
- AIの影響:アグリビジネスの世界市場
第7章 ファイブフォース分析
- ファイブフォースの要約
- 買い手の交渉力
- 供給企業の交渉力
- 新規参入業者の脅威
- 代替品の脅威
- 競争の脅威
- 市況
第8章 市場セグメンテーション:製品別
- 市場セグメント
- 比較:製品別
- 穀物および穀類:市場規模と予測 2024-2029
- 乳製品:市場規模と予測 2024-2029
- 油糧種子:市場規模と予測 2024-2029
- 家畜:市場規模と予測 2024-2029
- その他:市場規模と予測 2024-2029
- 市場機会:製品別
第9章 市場セグメンテーション:用途別
- 市場セグメント
- 比較:用途別
- 農薬:市場規模と予測 2024-2029
- 種子ビジネス:市場規模と予測 2024-2029
- 育種:市場規模と予測 2024-2029
- 機械設備:市場規模と予測 2024-2029
- 市場機会:用途別
第10章 市場セグメンテーション:技術別
- 市場セグメント
- 比較:技術別
- 伝統的な農業:市場規模と予測 2024-2029
- 機械化農業:市場規模と予測 2024-2029
- 精密農業とスマート農業:市場規模と予測 2024-2029
- 有機農業と持続可能な農業:市場規模と予測 2024-2029
- 市場機会:技術別
第11章 市場セグメンテーション:流通チャネル別
- 市場セグメント
- 比較:流通チャネル別
- 小売チェーンとスーパーマーケット:市場規模と予測 2024-2029
- 卸売販売:市場規模と予測 2024-2029
- 消費者直販:市場規模と予測 2024-2029
- 食品加工・製造会社:市場規模と予測 2024-2029
- 市場機会:流通チャネル別
第12章 顧客情勢
- 顧客情勢の概要
第13章 地域別情勢
- 地域別セグメンテーション
- 地域別比較
- アジア太平洋:市場規模と予測 2024-2029
- 北米:市場規模と予測 2024-2029
- 欧州:市場規模と予測 2024-2029
- 南米:市場規模と予測 2024-2029
- 中東・アフリカ:市場規模と予測 2024-2029
- 米国:市場規模と予測 2024-2029
- 中国:市場規模と予測 2024-2029
- 日本:市場規模と予測 2024-2029
- インド:市場規模と予測 2024-2029
- 韓国:市場規模と予測 2024-2029
- ドイツ:市場規模と予測 2024-2029
- 英国:市場規模と予測 2024-2029
- ブラジル:市場規模と予測 2024-2029
- カナダ:市場規模と予測 2024-2029
- フランス:市場規模と予測 2024-2029
- 市場機会:地域情勢別
第14章 促進要因・課題・機会・抑制要因
- 市場促進要因
- 市場の課題
- 促進要因と課題の影響
- 市場の機会・抑制要因
第15章 競合情勢
- 概要
- 競合情勢
- 混乱の状況
- 業界のリスク
第16章 競合分析
- 企業プロファイル
- 企業ランキング指数
- 企業の市場ポジショニング
- Associated British Foods Plc
- Bayer AG
- BrasilAgro
- Bunge Ltd.
- Cairo Poultry Co.
- Cargill Inc.
- CHS Inc
- Dairy Farmers of America Inc.
- DuPont de Nemours Inc.
- Land O Lakes Inc.
- LT Foods
- Nestle SA
- Syngenta Crop Protection AG
- WH Group Ltd.
- Wilmar International Ltd.
第17章 付録
Exhibits:
- Exhibits1: Executive Summary - Chart on Market Overview
- Exhibits2: Executive Summary - Data Table on Market Overview
- Exhibits3: Executive Summary - Chart on Global Market Characteristics
- Exhibits4: Executive Summary - Chart on Market By Geographical Landscape
- Exhibits5: Executive Summary - Chart on Market Segmentation by Product
- Exhibits6: Executive Summary - Chart on Market Segmentation by Application
- Exhibits7: Executive Summary - Chart on Market Segmentation by Technology
- Exhibits8: Executive Summary - Chart on Market Segmentation by Distribution Channel
- Exhibits9: Executive Summary - Chart on Incremental Growth
- Exhibits10: Executive Summary - Data Table on Incremental Growth
- Exhibits11: Executive Summary - Chart on Company Market Positioning
- Exhibits12: Analysis of price sensitivity, lifecycle, customer purchase basket, adoption rates, and purchase criteria
- Exhibits13: Overview on criticality of inputs and factors of differentiation
- Exhibits14: Overview on factors of disruption
- Exhibits15: Impact of drivers and challenges in 2024 and 2029
- Exhibits16: Parent Market
- Exhibits17: Data Table on - Parent Market
- Exhibits18: Market characteristics analysis
- Exhibits19: Value chain analysis
- Exhibits20: Offerings of companies included in the market definition
- Exhibits21: Market segments
- Exhibits22: Chart on Global - Market size and forecast 2024-2029 ($ million)
- Exhibits23: Data Table on Global - Market size and forecast 2024-2029 ($ million)
- Exhibits24: Chart on Global Market: Year-over-year growth 2024-2029 (%)
- Exhibits25: Data Table on Global Market: Year-over-year growth 2024-2029 (%)
- Exhibits26: Historic Market Size - Data Table on Global Agribusiness Market 2019 - 2023 ($ million)
- Exhibits27: Historic Market Size - Product Segment 2019 - 2023 ($ million)
- Exhibits28: Historic Market Size - Application Segment 2019 - 2023 ($ million)
- Exhibits29: Historic Market Size - Technology Segment 2019 - 2023 ($ million)
- Exhibits30: Historic Market Size - Distribution Channel Segment 2019 - 2023 ($ million)
- Exhibits31: Historic Market Size - Geography Segment 2019 - 2023 ($ million)
- Exhibits32: Historic Market Size - Country Segment 2019 - 2023 ($ million)
- Exhibits33: Five forces analysis - Comparison between 2024 and 2029
- Exhibits34: Bargaining power of buyers - Impact of key factors 2024 and 2029
- Exhibits35: Bargaining power of suppliers - Impact of key factors in 2024 and 2029
- Exhibits36: Threat of new entrants - Impact of key factors in 2024 and 2029
- Exhibits37: Threat of substitutes - Impact of key factors in 2024 and 2029
- Exhibits38: Threat of rivalry - Impact of key factors in 2024 and 2029
- Exhibits39: Chart on Market condition - Five forces 2024 and 2029
- Exhibits40: Chart on Product - Market share 2024-2029 (%)
- Exhibits41: Data Table on Product - Market share 2024-2029 (%)
- Exhibits42: Chart on Comparison by Product
- Exhibits43: Data Table on Comparison by Product
- Exhibits44: Chart on Grains and cereals - Market size and forecast 2024-2029 ($ million)
- Exhibits45: Data Table on Grains and cereals - Market size and forecast 2024-2029 ($ million)
- Exhibits46: Chart on Grains and cereals - Year-over-year growth 2024-2029 (%)
- Exhibits47: Data Table on Grains and cereals - Year-over-year growth 2024-2029 (%)
- Exhibits48: Chart on Dairy - Market size and forecast 2024-2029 ($ million)
- Exhibits49: Data Table on Dairy - Market size and forecast 2024-2029 ($ million)
- Exhibits50: Chart on Dairy - Year-over-year growth 2024-2029 (%)
- Exhibits51: Data Table on Dairy - Year-over-year growth 2024-2029 (%)
- Exhibits52: Chart on Oilseeds - Market size and forecast 2024-2029 ($ million)
- Exhibits53: Data Table on Oilseeds - Market size and forecast 2024-2029 ($ million)
- Exhibits54: Chart on Oilseeds - Year-over-year growth 2024-2029 (%)
- Exhibits55: Data Table on Oilseeds - Year-over-year growth 2024-2029 (%)
- Exhibits56: Chart on Livestock - Market size and forecast 2024-2029 ($ million)
- Exhibits57: Data Table on Livestock - Market size and forecast 2024-2029 ($ million)
- Exhibits58: Chart on Livestock - Year-over-year growth 2024-2029 (%)
- Exhibits59: Data Table on Livestock - Year-over-year growth 2024-2029 (%)
- Exhibits60: Chart on Others - Market size and forecast 2024-2029 ($ million)
- Exhibits61: Data Table on Others - Market size and forecast 2024-2029 ($ million)
- Exhibits62: Chart on Others - Year-over-year growth 2024-2029 (%)
- Exhibits63: Data Table on Others - Year-over-year growth 2024-2029 (%)
- Exhibits64: Market opportunity by Product ($ million)
- Exhibits65: Data Table on Market opportunity by Product ($ million)
- Exhibits66: Chart on Application - Market share 2024-2029 (%)
- Exhibits67: Data Table on Application - Market share 2024-2029 (%)
- Exhibits68: Chart on Comparison by Application
- Exhibits69: Data Table on Comparison by Application
- Exhibits70: Chart on Agrichemicals - Market size and forecast 2024-2029 ($ million)
- Exhibits71: Data Table on Agrichemicals - Market size and forecast 2024-2029 ($ million)
- Exhibits72: Chart on Agrichemicals - Year-over-year growth 2024-2029 (%)
- Exhibits73: Data Table on Agrichemicals - Year-over-year growth 2024-2029 (%)
- Exhibits74: Chart on Seed business - Market size and forecast 2024-2029 ($ million)
- Exhibits75: Data Table on Seed business - Market size and forecast 2024-2029 ($ million)
- Exhibits76: Chart on Seed business - Year-over-year growth 2024-2029 (%)
- Exhibits77: Data Table on Seed business - Year-over-year growth 2024-2029 (%)
- Exhibits78: Chart on Breeding - Market size and forecast 2024-2029 ($ million)
- Exhibits79: Data Table on Breeding - Market size and forecast 2024-2029 ($ million)
- Exhibits80: Chart on Breeding - Year-over-year growth 2024-2029 (%)
- Exhibits81: Data Table on Breeding - Year-over-year growth 2024-2029 (%)
- Exhibits82: Chart on Machinery and equipment - Market size and forecast 2024-2029 ($ million)
- Exhibits83: Data Table on Machinery and equipment - Market size and forecast 2024-2029 ($ million)
- Exhibits84: Chart on Machinery and equipment - Year-over-year growth 2024-2029 (%)
- Exhibits85: Data Table on Machinery and equipment - Year-over-year growth 2024-2029 (%)
- Exhibits86: Market opportunity by Application ($ million)
- Exhibits87: Data Table on Market opportunity by Application ($ million)
- Exhibits88: Chart on Technology - Market share 2024-2029 (%)
- Exhibits89: Data Table on Technology - Market share 2024-2029 (%)
- Exhibits90: Chart on Comparison by Technology
- Exhibits91: Data Table on Comparison by Technology
- Exhibits92: Chart on Traditional agriculture - Market size and forecast 2024-2029 ($ million)
- Exhibits93: Data Table on Traditional agriculture - Market size and forecast 2024-2029 ($ million)
- Exhibits94: Chart on Traditional agriculture - Year-over-year growth 2024-2029 (%)
- Exhibits95: Data Table on Traditional agriculture - Year-over-year growth 2024-2029 (%)
- Exhibits96: Chart on Mechanized farming - Market size and forecast 2024-2029 ($ million)
- Exhibits97: Data Table on Mechanized farming - Market size and forecast 2024-2029 ($ million)
- Exhibits98: Chart on Mechanized farming - Year-over-year growth 2024-2029 (%)
- Exhibits99: Data Table on Mechanized farming - Year-over-year growth 2024-2029 (%)
- Exhibits100: Chart on Precision agriculture and smart farming - Market size and forecast 2024-2029 ($ million)
- Exhibits101: Data Table on Precision agriculture and smart farming - Market size and forecast 2024-2029 ($ million)
- Exhibits102: Chart on Precision agriculture and smart farming - Year-over-year growth 2024-2029 (%)
- Exhibits103: Data Table on Precision agriculture and smart farming - Year-over-year growth 2024-2029 (%)
- Exhibits104: Chart on Organic and sustainable Farming - Market size and forecast 2024-2029 ($ million)
- Exhibits105: Data Table on Organic and sustainable Farming - Market size and forecast 2024-2029 ($ million)
- Exhibits106: Chart on Organic and sustainable Farming - Year-over-year growth 2024-2029 (%)
- Exhibits107: Data Table on Organic and sustainable Farming - Year-over-year growth 2024-2029 (%)
- Exhibits108: Market opportunity by Technology ($ million)
- Exhibits109: Data Table on Market opportunity by Technology ($ million)
- Exhibits110: Chart on Distribution Channel - Market share 2024-2029 (%)
- Exhibits111: Data Table on Distribution Channel - Market share 2024-2029 (%)
- Exhibits112: Chart on Comparison by Distribution Channel
- Exhibits113: Data Table on Comparison by Distribution Channel
- Exhibits114: Chart on Retail chains and supermarkets - Market size and forecast 2024-2029 ($ million)
- Exhibits115: Data Table on Retail chains and supermarkets - Market size and forecast 2024-2029 ($ million)
- Exhibits116: Chart on Retail chains and supermarkets - Year-over-year growth 2024-2029 (%)
- Exhibits117: Data Table on Retail chains and supermarkets - Year-over-year growth 2024-2029 (%)
- Exhibits118: Chart on Wholesale distribution - Market size and forecast 2024-2029 ($ million)
- Exhibits119: Data Table on Wholesale distribution - Market size and forecast 2024-2029 ($ million)
- Exhibits120: Chart on Wholesale distribution - Year-over-year growth 2024-2029 (%)
- Exhibits121: Data Table on Wholesale distribution - Year-over-year growth 2024-2029 (%)
- Exhibits122: Chart on Direct-to-consumer - Market size and forecast 2024-2029 ($ million)
- Exhibits123: Data Table on Direct-to-consumer - Market size and forecast 2024-2029 ($ million)
- Exhibits124: Chart on Direct-to-consumer - Year-over-year growth 2024-2029 (%)
- Exhibits125: Data Table on Direct-to-consumer - Year-over-year growth 2024-2029 (%)
- Exhibits126: Chart on Food processing and manufacturing companies - Market size and forecast 2024-2029 ($ million)
- Exhibits127: Data Table on Food processing and manufacturing companies - Market size and forecast 2024-2029 ($ million)
- Exhibits128: Chart on Food processing and manufacturing companies - Year-over-year growth 2024-2029 (%)
- Exhibits129: Data Table on Food processing and manufacturing companies - Year-over-year growth 2024-2029 (%)
- Exhibits130: Market opportunity by Distribution Channel ($ million)
- Exhibits131: Data Table on Market opportunity by Distribution Channel ($ million)
- Exhibits132: Analysis of price sensitivity, lifecycle, customer purchase basket, adoption rates, and purchase criteria
- Exhibits133: Chart on Market share By Geographical Landscape 2024-2029 (%)
- Exhibits134: Data Table on Market share By Geographical Landscape 2024-2029 (%)
- Exhibits135: Chart on Geographic comparison
- Exhibits136: Data Table on Geographic comparison
- Exhibits137: Chart on APAC - Market size and forecast 2024-2029 ($ million)
- Exhibits138: Data Table on APAC - Market size and forecast 2024-2029 ($ million)
- Exhibits139: Chart on APAC - Year-over-year growth 2024-2029 (%)
- Exhibits140: Data Table on APAC - Year-over-year growth 2024-2029 (%)
- Exhibits141: Chart on North America - Market size and forecast 2024-2029 ($ million)
- Exhibits142: Data Table on North America - Market size and forecast 2024-2029 ($ million)
- Exhibits143: Chart on North America - Year-over-year growth 2024-2029 (%)
- Exhibits144: Data Table on North America - Year-over-year growth 2024-2029 (%)
- Exhibits145: Chart on Europe - Market size and forecast 2024-2029 ($ million)
- Exhibits146: Data Table on Europe - Market size and forecast 2024-2029 ($ million)
- Exhibits147: Chart on Europe - Year-over-year growth 2024-2029 (%)
- Exhibits148: Data Table on Europe - Year-over-year growth 2024-2029 (%)
- Exhibits149: Chart on South America - Market size and forecast 2024-2029 ($ million)
- Exhibits150: Data Table on South America - Market size and forecast 2024-2029 ($ million)
- Exhibits151: Chart on South America - Year-over-year growth 2024-2029 (%)
- Exhibits152: Data Table on South America - Year-over-year growth 2024-2029 (%)
- Exhibits153: Chart on Middle East and Africa - Market size and forecast 2024-2029 ($ million)
- Exhibits154: Data Table on Middle East and Africa - Market size and forecast 2024-2029 ($ million)
- Exhibits155: Chart on Middle East and Africa - Year-over-year growth 2024-2029 (%)
- Exhibits156: Data Table on Middle East and Africa - Year-over-year growth 2024-2029 (%)
- Exhibits157: Chart on US - Market size and forecast 2024-2029 ($ million)
- Exhibits158: Data Table on US - Market size and forecast 2024-2029 ($ million)
- Exhibits159: Chart on US - Year-over-year growth 2024-2029 (%)
- Exhibits160: Data Table on US - Year-over-year growth 2024-2029 (%)
- Exhibits161: Chart on China - Market size and forecast 2024-2029 ($ million)
- Exhibits162: Data Table on China - Market size and forecast 2024-2029 ($ million)
- Exhibits163: Chart on China - Year-over-year growth 2024-2029 (%)
- Exhibits164: Data Table on China - Year-over-year growth 2024-2029 (%)
- Exhibits165: Chart on Japan - Market size and forecast 2024-2029 ($ million)
- Exhibits166: Data Table on Japan - Market size and forecast 2024-2029 ($ million)
- Exhibits167: Chart on Japan - Year-over-year growth 2024-2029 (%)
- Exhibits168: Data Table on Japan - Year-over-year growth 2024-2029 (%)
- Exhibits169: Chart on India - Market size and forecast 2024-2029 ($ million)
- Exhibits170: Data Table on India - Market size and forecast 2024-2029 ($ million)
- Exhibits171: Chart on India - Year-over-year growth 2024-2029 (%)
- Exhibits172: Data Table on India - Year-over-year growth 2024-2029 (%)
- Exhibits173: Chart on South Korea - Market size and forecast 2024-2029 ($ million)
- Exhibits174: Data Table on South Korea - Market size and forecast 2024-2029 ($ million)
- Exhibits175: Chart on South Korea - Year-over-year growth 2024-2029 (%)
- Exhibits176: Data Table on South Korea - Year-over-year growth 2024-2029 (%)
- Exhibits177: Chart on Germany - Market size and forecast 2024-2029 ($ million)
- Exhibits178: Data Table on Germany - Market size and forecast 2024-2029 ($ million)
- Exhibits179: Chart on Germany - Year-over-year growth 2024-2029 (%)
- Exhibits180: Data Table on Germany - Year-over-year growth 2024-2029 (%)
- Exhibits181: Chart on UK - Market size and forecast 2024-2029 ($ million)
- Exhibits182: Data Table on UK - Market size and forecast 2024-2029 ($ million)
- Exhibits183: Chart on UK - Year-over-year growth 2024-2029 (%)
- Exhibits184: Data Table on UK - Year-over-year growth 2024-2029 (%)
- Exhibits185: Chart on Brazil - Market size and forecast 2024-2029 ($ million)
- Exhibits186: Data Table on Brazil - Market size and forecast 2024-2029 ($ million)
- Exhibits187: Chart on Brazil - Year-over-year growth 2024-2029 (%)
- Exhibits188: Data Table on Brazil - Year-over-year growth 2024-2029 (%)
- Exhibits189: Chart on Canada - Market size and forecast 2024-2029 ($ million)
- Exhibits190: Data Table on Canada - Market size and forecast 2024-2029 ($ million)
- Exhibits191: Chart on Canada - Year-over-year growth 2024-2029 (%)
- Exhibits192: Data Table on Canada - Year-over-year growth 2024-2029 (%)
- Exhibits193: Chart on France - Market size and forecast 2024-2029 ($ million)
- Exhibits194: Data Table on France - Market size and forecast 2024-2029 ($ million)
- Exhibits195: Chart on France - Year-over-year growth 2024-2029 (%)
- Exhibits196: Data Table on France - Year-over-year growth 2024-2029 (%)
- Exhibits197: Market opportunity By Geographical Landscape ($ million)
- Exhibits198: Data Tables on Market opportunity By Geographical Landscape ($ million)
- Exhibits199: Impact of drivers and challenges in 2024 and 2029
- Exhibits200: Overview on criticality of inputs and factors of differentiation
- Exhibits201: Overview on factors of disruption
- Exhibits202: Impact of key risks on business
- Exhibits203: Companies covered
- Exhibits204: Company ranking index
- Exhibits205: Matrix on companies position and classification
- Exhibits206: Associated British Foods Plc - Overview
- Exhibits207: Associated British Foods Plc - Business segments
- Exhibits208: Associated British Foods Plc - Key offerings
- Exhibits209: Associated British Foods Plc - Segment focus
- Exhibits210: SWOT
- Exhibits211: Bayer AG - Overview
- Exhibits212: Bayer AG - Business segments
- Exhibits213: Bayer AG - Key news
- Exhibits214: Bayer AG - Key offerings
- Exhibits215: Bayer AG - Segment focus
- Exhibits216: SWOT
- Exhibits217: BrasilAgro - Overview
- Exhibits218: BrasilAgro - Product / Service
- Exhibits219: BrasilAgro - Key offerings
- Exhibits220: SWOT
- Exhibits221: Bunge Ltd. - Overview
- Exhibits222: Bunge Ltd. - Business segments
- Exhibits223: Bunge Ltd. - Key news
- Exhibits224: Bunge Ltd. - Key offerings
- Exhibits225: Bunge Ltd. - Segment focus
- Exhibits226: SWOT
- Exhibits227: Cairo Poultry Co. - Overview
- Exhibits228: Cairo Poultry Co. - Product / Service
- Exhibits229: Cairo Poultry Co. - Key offerings
- Exhibits230: SWOT
- Exhibits231: Cargill Inc. - Overview
- Exhibits232: Cargill Inc. - Product / Service
- Exhibits233: Cargill Inc. - Key offerings
- Exhibits234: SWOT
- Exhibits235: CHS Inc - Overview
- Exhibits236: CHS Inc - Business segments
- Exhibits237: CHS Inc - Key offerings
- Exhibits238: CHS Inc - Segment focus
- Exhibits239: SWOT
- Exhibits240: Dairy Farmers of America Inc. - Overview
- Exhibits241: Dairy Farmers of America Inc. - Product / Service
- Exhibits242: Dairy Farmers of America Inc. - Key offerings
- Exhibits243: SWOT
- Exhibits244: DuPont de Nemours Inc. - Overview
- Exhibits245: DuPont de Nemours Inc. - Business segments
- Exhibits246: DuPont de Nemours Inc. - Key news
- Exhibits247: DuPont de Nemours Inc. - Key offerings
- Exhibits248: DuPont de Nemours Inc. - Segment focus
- Exhibits249: SWOT
- Exhibits250: Land O Lakes Inc. - Overview
- Exhibits251: Land O Lakes Inc. - Product / Service
- Exhibits252: Land O Lakes Inc. - Key offerings
- Exhibits253: SWOT
- Exhibits254: LT Foods - Overview
- Exhibits255: LT Foods - Product / Service
- Exhibits256: LT Foods - Key offerings
- Exhibits257: SWOT
- Exhibits258: Nestle SA - Overview
- Exhibits259: Nestle SA - Business segments
- Exhibits260: Nestle SA - Key news
- Exhibits261: Nestle SA - Key offerings
- Exhibits262: Nestle SA - Segment focus
- Exhibits263: SWOT
- Exhibits264: Syngenta Crop Protection AG - Overview
- Exhibits265: Syngenta Crop Protection AG - Product / Service
- Exhibits266: Syngenta Crop Protection AG - Key offerings
- Exhibits267: SWOT
- Exhibits268: WH Group Ltd. - Overview
- Exhibits269: WH Group Ltd. - Business segments
- Exhibits270: WH Group Ltd. - Key news
- Exhibits271: WH Group Ltd. - Key offerings
- Exhibits272: WH Group Ltd. - Segment focus
- Exhibits273: SWOT
- Exhibits274: Wilmar International Ltd. - Overview
- Exhibits275: Wilmar International Ltd. - Business segments
- Exhibits276: Wilmar International Ltd. - Key offerings
- Exhibits277: Wilmar International Ltd. - Segment focus
- Exhibits278: SWOT
- Exhibits279: Inclusions checklist
- Exhibits280: Exclusions checklist
- Exhibits281: Currency conversion rates for US$
- Exhibits282: Research methodology
- Exhibits283: Information sources
- Exhibits284: Data validation
- Exhibits285: Validation techniques employed for market sizing
- Exhibits286: Data synthesis
- Exhibits287: 360 degree market analysis
- Exhibits288: List of abbreviations
The agribusiness market is forecasted to grow by USD 843.4 million during 2024-2029, accelerating at a CAGR of 4.6% during the forecast period. The report on the agribusiness market provides a holistic analysis, market size and forecast, trends, growth drivers, and challenges, as well as vendor analysis covering around 25 vendors.
The report offers an up-to-date analysis regarding the current market scenario, the latest trends and drivers, and the overall market environment. The market is driven by increasing demand for food due to population growth, high adoption of bio-agrochemicals, and improving agriculture trade policy.
| Market Scope | |
|---|---|
| Base Year | 2025 |
| End Year | 2029 |
| Series Year | 2025-2029 |
| Growth Momentum | Accelerate |
| YOY 2025 | 3.7% |
| CAGR | 4.6% |
| Incremental Value | $843.4 mn |
The study was conducted using an objective combination of primary and secondary information including inputs from key participants in the industry. The report contains a comprehensive market size data, segment with regional analysis and vendor landscape in addition to an analysis of the key companies. Reports have historic and forecast data.
Technavio's agribusiness market is segmented as below:
By Product
- Grains and cereals
- Dairy
- Oilseeds
- Livestock
- Others
By Application
- Agrichemicals
- Seed business
- Breeding
- Machinery and equipment
By Technology
- Traditional agriculture
- Mechanized farming
- Precision agriculture and smart farming
- Organic and sustainable Farming
By Distribution Channel
- Retail chains and supermarkets
- Wholesale distribution
- Direct-to-consumer
- Food processing and manufacturing companies
By Geographical Landscape
- APAC
- North America
- Europe
- South America
- Middle East and Africa
This study identifies the automation in agriculture as one of the prime reasons driving the agribusiness market growth during the next few years. Also, new developments in agribusiness and growing demand for environmentally sustainable food will lead to sizable demand in the market.
The report on the agribusiness market covers the following areas:
- Agribusiness Market sizing
- Agribusiness Market forecast
- Agribusiness Market industry analysis
The robust vendor analysis is designed to help clients improve their market position, and in line with this, this report provides a detailed analysis of several leading agribusiness market vendors that include Associated British Foods PLC, Bayer AG, BrasilAgro, Bunge Ltd., Cairo Poultry Co., Cargill Inc., Charoen Pokphand Foods PCL, CHS Inc, Dairy Farmers of America Inc., DuPont de Nemours Inc., Godrej Agrovet Ltd, Indian Farmers Fertiliser Cooperative Ltd., Land O Lakes Inc., LT Foods, Nestle SA, Olam Group Ltd., Syngenta Crop Protection AG, WH Group Ltd., and Wilmar International Ltd.. Also, the agribusiness market analysis report includes information on upcoming trends and challenges that will influence market growth. This is to help companies strategize and leverage all forthcoming growth opportunities.
The publisher presents a detailed picture of the market by the way of study, synthesis, and summation of data from multiple sources by an analysis of key parameters such as profit, pricing, competition, and promotions. It presents various market facets by identifying the key industry influencers. The data presented is comprehensive, reliable, and a result of extensive primary and secondary research. The market research reports provide a complete competitive landscape and an in-depth vendor selection methodology and analysis using qualitative and quantitative research to forecast accurate market growth.
Table of Contents
1 Executive Summary
- 1.1 Market overview
- Executive Summary - Chart on Market Overview
- Executive Summary - Data Table on Market Overview
- Executive Summary - Chart on Global Market Characteristics
- Executive Summary - Chart on Market By Geographical Landscape
- Executive Summary - Chart on Market Segmentation by Product
- Executive Summary - Chart on Market Segmentation by Application
- Executive Summary - Chart on Market Segmentation by Technology
- Executive Summary - Chart on Market Segmentation by Distribution Channel
- Executive Summary - Chart on Incremental Growth
- Executive Summary - Data Table on Incremental Growth
- Executive Summary - Chart on Company Market Positioning
2 Technavio Analysis
- 2.1 Analysis of price sensitivity, lifecycle, customer purchase basket, adoption rates, and purchase criteria
- Analysis of price sensitivity, lifecycle, customer purchase basket, adoption rates, and purchase criteria
- 2.2 Criticality of inputs and Factors of differentiation
- Overview on criticality of inputs and factors of differentiation
- 2.3 Factors of disruption
- Overview on factors of disruption
- 2.4 Impact of drivers and challenges
- Impact of drivers and challenges in 2024 and 2029
3 Market Landscape
- 3.1 Market ecosystem
- Parent Market
- Data Table on - Parent Market
- 3.2 Market characteristics
- Market characteristics analysis
- 3.3 Value chain analysis
- Value chain analysis
4 Market Sizing
- 4.1 Market definition
- Offerings of companies included in the market definition
- 4.2 Market segment analysis
- Market segments
- 4.3 Market size 2024
- 4.4 Market outlook: Forecast for 2024-2029
- Chart on Global - Market size and forecast 2024-2029 ($ million)
- Data Table on Global - Market size and forecast 2024-2029 ($ million)
- Chart on Global Market: Year-over-year growth 2024-2029 (%)
- Data Table on Global Market: Year-over-year growth 2024-2029 (%)
5 Historic Market Size
- 5.1 Global Agribusiness Market 2019 - 2023
- Historic Market Size - Data Table on Global Agribusiness Market 2019 - 2023 ($ million)
- 5.2 Product segment analysis 2019 - 2023
- Historic Market Size - Product Segment 2019 - 2023 ($ million)
- 5.3 Application segment analysis 2019 - 2023
- Historic Market Size - Application Segment 2019 - 2023 ($ million)
- 5.4 Technology segment analysis 2019 - 2023
- Historic Market Size - Technology Segment 2019 - 2023 ($ million)
- 5.5 Distribution Channel segment analysis 2019 - 2023
- Historic Market Size - Distribution Channel Segment 2019 - 2023 ($ million)
- 5.6 Geography segment analysis 2019 - 2023
- Historic Market Size - Geography Segment 2019 - 2023 ($ million)
- 5.7 Country segment analysis 2019 - 2023
- Historic Market Size - Country Segment 2019 - 2023 ($ million)
6 Qualitative Analysis
- 6.1 Impact of AI on the global agribusiness market
7 Five Forces Analysis
- 7.1 Five forces summary
- Five forces analysis - Comparison between 2024 and 2029
- 7.2 Bargaining power of buyers
- Bargaining power of buyers - Impact of key factors 2024 and 2029
- 7.3 Bargaining power of suppliers
- Bargaining power of suppliers - Impact of key factors in 2024 and 2029
- 7.4 Threat of new entrants
- Threat of new entrants - Impact of key factors in 2024 and 2029
- 7.5 Threat of substitutes
- Threat of substitutes - Impact of key factors in 2024 and 2029
- 7.6 Threat of rivalry
- Threat of rivalry - Impact of key factors in 2024 and 2029
- 7.7 Market condition
- Chart on Market condition - Five forces 2024 and 2029
8 Market Segmentation by Product
- 8.1 Market segments
- Chart on Product - Market share 2024-2029 (%)
- Data Table on Product - Market share 2024-2029 (%)
- 8.2 Comparison by Product
- Chart on Comparison by Product
- Data Table on Comparison by Product
- 8.3 Grains and cereals - Market size and forecast 2024-2029
- Chart on Grains and cereals - Market size and forecast 2024-2029 ($ million)
- Data Table on Grains and cereals - Market size and forecast 2024-2029 ($ million)
- Chart on Grains and cereals - Year-over-year growth 2024-2029 (%)
- Data Table on Grains and cereals - Year-over-year growth 2024-2029 (%)
- 8.4 Dairy - Market size and forecast 2024-2029
- Chart on Dairy - Market size and forecast 2024-2029 ($ million)
- Data Table on Dairy - Market size and forecast 2024-2029 ($ million)
- Chart on Dairy - Year-over-year growth 2024-2029 (%)
- Data Table on Dairy - Year-over-year growth 2024-2029 (%)
- 8.5 Oilseeds - Market size and forecast 2024-2029
- Chart on Oilseeds - Market size and forecast 2024-2029 ($ million)
- Data Table on Oilseeds - Market size and forecast 2024-2029 ($ million)
- Chart on Oilseeds - Year-over-year growth 2024-2029 (%)
- Data Table on Oilseeds - Year-over-year growth 2024-2029 (%)
- 8.6 Livestock - Market size and forecast 2024-2029
- Chart on Livestock - Market size and forecast 2024-2029 ($ million)
- Data Table on Livestock - Market size and forecast 2024-2029 ($ million)
- Chart on Livestock - Year-over-year growth 2024-2029 (%)
- Data Table on Livestock - Year-over-year growth 2024-2029 (%)
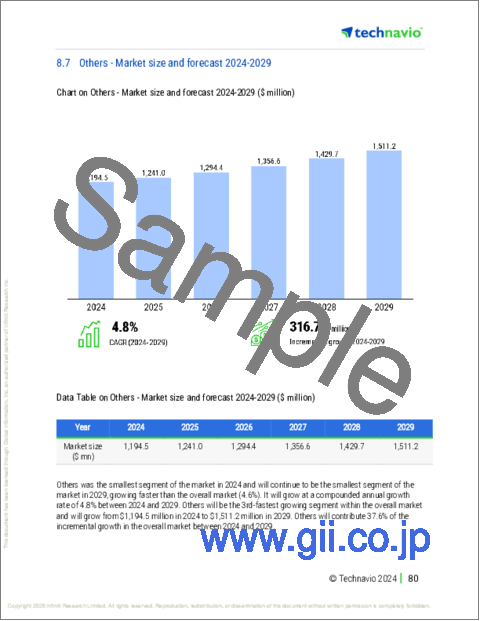
- 8.7 Others - Market size and forecast 2024-2029
- Chart on Others - Market size and forecast 2024-2029 ($ million)
- Data Table on Others - Market size and forecast 2024-2029 ($ million)
- Chart on Others - Year-over-year growth 2024-2029 (%)
- Data Table on Others - Year-over-year growth 2024-2029 (%)
- 8.8 Market opportunity by Product
- Market opportunity by Product ($ million)
- Data Table on Market opportunity by Product ($ million)
9 Market Segmentation by Application
- 9.1 Market segments
- Chart on Application - Market share 2024-2029 (%)
- Data Table on Application - Market share 2024-2029 (%)
- 9.2 Comparison by Application
- Chart on Comparison by Application
- Data Table on Comparison by Application
- 9.3 Agrichemicals - Market size and forecast 2024-2029
- Chart on Agrichemicals - Market size and forecast 2024-2029 ($ million)
- Data Table on Agrichemicals - Market size and forecast 2024-2029 ($ million)
- Chart on Agrichemicals - Year-over-year growth 2024-2029 (%)
- Data Table on Agrichemicals - Year-over-year growth 2024-2029 (%)
- 9.4 Seed business - Market size and forecast 2024-2029
- Chart on Seed business - Market size and forecast 2024-2029 ($ million)
- Data Table on Seed business - Market size and forecast 2024-2029 ($ million)
- Chart on Seed business - Year-over-year growth 2024-2029 (%)
- Data Table on Seed business - Year-over-year growth 2024-2029 (%)
- 9.5 Breeding - Market size and forecast 2024-2029
- Chart on Breeding - Market size and forecast 2024-2029 ($ million)
- Data Table on Breeding - Market size and forecast 2024-2029 ($ million)
- Chart on Breeding - Year-over-year growth 2024-2029 (%)
- Data Table on Breeding - Year-over-year growth 2024-2029 (%)
- 9.6 Machinery and equipment - Market size and forecast 2024-2029
- Chart on Machinery and equipment - Market size and forecast 2024-2029 ($ million)
- Data Table on Machinery and equipment - Market size and forecast 2024-2029 ($ million)
- Chart on Machinery and equipment - Year-over-year growth 2024-2029 (%)
- Data Table on Machinery and equipment - Year-over-year growth 2024-2029 (%)
- 9.7 Market opportunity by Application
- Market opportunity by Application ($ million)
- Data Table on Market opportunity by Application ($ million)
10 Market Segmentation by Technology
- 10.1 Market segments
- Chart on Technology - Market share 2024-2029 (%)
- Data Table on Technology - Market share 2024-2029 (%)
- 10.2 Comparison by Technology
- Chart on Comparison by Technology
- Data Table on Comparison by Technology
- 10.3 Traditional agriculture - Market size and forecast 2024-2029
- Chart on Traditional agriculture - Market size and forecast 2024-2029 ($ million)
- Data Table on Traditional agriculture - Market size and forecast 2024-2029 ($ million)
- Chart on Traditional agriculture - Year-over-year growth 2024-2029 (%)
- Data Table on Traditional agriculture - Year-over-year growth 2024-2029 (%)
- 10.4 Mechanized farming - Market size and forecast 2024-2029
- Chart on Mechanized farming - Market size and forecast 2024-2029 ($ million)
- Data Table on Mechanized farming - Market size and forecast 2024-2029 ($ million)
- Chart on Mechanized farming - Year-over-year growth 2024-2029 (%)
- Data Table on Mechanized farming - Year-over-year growth 2024-2029 (%)
- 10.5 Precision agriculture and smart farming - Market size and forecast 2024-2029
- Chart on Precision agriculture and smart farming - Market size and forecast 2024-2029 ($ million)
- Data Table on Precision agriculture and smart farming - Market size and forecast 2024-2029 ($ million)
- Chart on Precision agriculture and smart farming - Year-over-year growth 2024-2029 (%)
- Data Table on Precision agriculture and smart farming - Year-over-year growth 2024-2029 (%)
- 10.6 Organic and sustainable Farming - Market size and forecast 2024-2029
- Chart on Organic and sustainable Farming - Market size and forecast 2024-2029 ($ million)
- Data Table on Organic and sustainable Farming - Market size and forecast 2024-2029 ($ million)
- Chart on Organic and sustainable Farming - Year-over-year growth 2024-2029 (%)
- Data Table on Organic and sustainable Farming - Year-over-year growth 2024-2029 (%)
- 10.7 Market opportunity by Technology
- Market opportunity by Technology ($ million)
- Data Table on Market opportunity by Technology ($ million)
11 Market Segmentation by Distribution Channel
- 11.1 Market segments
- Chart on Distribution Channel - Market share 2024-2029 (%)
- Data Table on Distribution Channel - Market share 2024-2029 (%)
- 11.2 Comparison by Distribution Channel
- Chart on Comparison by Distribution Channel
- Data Table on Comparison by Distribution Channel
- 11.3 Retail chains and supermarkets - Market size and forecast 2024-2029
- Chart on Retail chains and supermarkets - Market size and forecast 2024-2029 ($ million)
- Data Table on Retail chains and supermarkets - Market size and forecast 2024-2029 ($ million)
- Chart on Retail chains and supermarkets - Year-over-year growth 2024-2029 (%)
- Data Table on Retail chains and supermarkets - Year-over-year growth 2024-2029 (%)
- 11.4 Wholesale distribution - Market size and forecast 2024-2029
- Chart on Wholesale distribution - Market size and forecast 2024-2029 ($ million)
- Data Table on Wholesale distribution - Market size and forecast 2024-2029 ($ million)
- Chart on Wholesale distribution - Year-over-year growth 2024-2029 (%)
- Data Table on Wholesale distribution - Year-over-year growth 2024-2029 (%)
- 11.5 Direct-to-consumer - Market size and forecast 2024-2029
- Chart on Direct-to-consumer - Market size and forecast 2024-2029 ($ million)
- Data Table on Direct-to-consumer - Market size and forecast 2024-2029 ($ million)
- Chart on Direct-to-consumer - Year-over-year growth 2024-2029 (%)
- Data Table on Direct-to-consumer - Year-over-year growth 2024-2029 (%)
- 11.6 Food processing and manufacturing companies - Market size and forecast 2024-2029
- Chart on Food processing and manufacturing companies - Market size and forecast 2024-2029 ($ million)
- Data Table on Food processing and manufacturing companies - Market size and forecast 2024-2029 ($ million)
- Chart on Food processing and manufacturing companies - Year-over-year growth 2024-2029 (%)
- Data Table on Food processing and manufacturing companies - Year-over-year growth 2024-2029 (%)
- 11.7 Market opportunity by Distribution Channel
- Market opportunity by Distribution Channel ($ million)
- Data Table on Market opportunity by Distribution Channel ($ million)
12 Customer Landscape
- 12.1 Customer landscape overview
- Analysis of price sensitivity, lifecycle, customer purchase basket, adoption rates, and purchase criteria
13 Geographic Landscape
- 13.1 Geographic segmentation
- Chart on Market share By Geographical Landscape 2024-2029 (%)
- Data Table on Market share By Geographical Landscape 2024-2029 (%)
- 13.2 Geographic comparison
- Chart on Geographic comparison
- Data Table on Geographic comparison
- 13.3 APAC - Market size and forecast 2024-2029
- Chart on APAC - Market size and forecast 2024-2029 ($ million)
- Data Table on APAC - Market size and forecast 2024-2029 ($ million)
- Chart on APAC - Year-over-year growth 2024-2029 (%)
- Data Table on APAC - Year-over-year growth 2024-2029 (%)
- 13.4 North America - Market size and forecast 2024-2029
- Chart on North America - Market size and forecast 2024-2029 ($ million)
- Data Table on North America - Market size and forecast 2024-2029 ($ million)
- Chart on North America - Year-over-year growth 2024-2029 (%)
- Data Table on North America - Year-over-year growth 2024-2029 (%)
- 13.5 Europe - Market size and forecast 2024-2029
- Chart on Europe - Market size and forecast 2024-2029 ($ million)
- Data Table on Europe - Market size and forecast 2024-2029 ($ million)
- Chart on Europe - Year-over-year growth 2024-2029 (%)
- Data Table on Europe - Year-over-year growth 2024-2029 (%)
- 13.6 South America - Market size and forecast 2024-2029
- Chart on South America - Market size and forecast 2024-2029 ($ million)
- Data Table on South America - Market size and forecast 2024-2029 ($ million)
- Chart on South America - Year-over-year growth 2024-2029 (%)
- Data Table on South America - Year-over-year growth 2024-2029 (%)
- 13.7 Middle East and Africa - Market size and forecast 2024-2029
- Chart on Middle East and Africa - Market size and forecast 2024-2029 ($ million)
- Data Table on Middle East and Africa - Market size and forecast 2024-2029 ($ million)
- Chart on Middle East and Africa - Year-over-year growth 2024-2029 (%)
- Data Table on Middle East and Africa - Year-over-year growth 2024-2029 (%)
- 13.8 US - Market size and forecast 2024-2029
- Chart on US - Market size and forecast 2024-2029 ($ million)
- Data Table on US - Market size and forecast 2024-2029 ($ million)
- Chart on US - Year-over-year growth 2024-2029 (%)
- Data Table on US - Year-over-year growth 2024-2029 (%)
- 13.9 China - Market size and forecast 2024-2029
- Chart on China - Market size and forecast 2024-2029 ($ million)
- Data Table on China - Market size and forecast 2024-2029 ($ million)
- Chart on China - Year-over-year growth 2024-2029 (%)
- Data Table on China - Year-over-year growth 2024-2029 (%)
- 13.10 Japan - Market size and forecast 2024-2029
- Chart on Japan - Market size and forecast 2024-2029 ($ million)
- Data Table on Japan - Market size and forecast 2024-2029 ($ million)
- Chart on Japan - Year-over-year growth 2024-2029 (%)
- Data Table on Japan - Year-over-year growth 2024-2029 (%)
- 13.11 India - Market size and forecast 2024-2029
- Chart on India - Market size and forecast 2024-2029 ($ million)
- Data Table on India - Market size and forecast 2024-2029 ($ million)
- Chart on India - Year-over-year growth 2024-2029 (%)
- Data Table on India - Year-over-year growth 2024-2029 (%)
- 13.12 South Korea - Market size and forecast 2024-2029
- Chart on South Korea - Market size and forecast 2024-2029 ($ million)
- Data Table on South Korea - Market size and forecast 2024-2029 ($ million)
- Chart on South Korea - Year-over-year growth 2024-2029 (%)
- Data Table on South Korea - Year-over-year growth 2024-2029 (%)
- 13.13 Germany - Market size and forecast 2024-2029
- Chart on Germany - Market size and forecast 2024-2029 ($ million)
- Data Table on Germany - Market size and forecast 2024-2029 ($ million)
- Chart on Germany - Year-over-year growth 2024-2029 (%)
- Data Table on Germany - Year-over-year growth 2024-2029 (%)
- 13.14 UK - Market size and forecast 2024-2029
- Chart on UK - Market size and forecast 2024-2029 ($ million)
- Data Table on UK - Market size and forecast 2024-2029 ($ million)
- Chart on UK - Year-over-year growth 2024-2029 (%)
- Data Table on UK - Year-over-year growth 2024-2029 (%)
- 13.15 Brazil - Market size and forecast 2024-2029
- Chart on Brazil - Market size and forecast 2024-2029 ($ million)
- Data Table on Brazil - Market size and forecast 2024-2029 ($ million)
- Chart on Brazil - Year-over-year growth 2024-2029 (%)
- Data Table on Brazil - Year-over-year growth 2024-2029 (%)
- 13.16 Canada - Market size and forecast 2024-2029
- Chart on Canada - Market size and forecast 2024-2029 ($ million)
- Data Table on Canada - Market size and forecast 2024-2029 ($ million)
- Chart on Canada - Year-over-year growth 2024-2029 (%)
- Data Table on Canada - Year-over-year growth 2024-2029 (%)
- 13.17 France - Market size and forecast 2024-2029
- Chart on France - Market size and forecast 2024-2029 ($ million)
- Data Table on France - Market size and forecast 2024-2029 ($ million)
- Chart on France - Year-over-year growth 2024-2029 (%)
- Data Table on France - Year-over-year growth 2024-2029 (%)
- 13.18 Market opportunity By Geographical Landscape
- Market opportunity By Geographical Landscape ($ million)
- Data Tables on Market opportunity By Geographical Landscape ($ million)
14 Drivers, Challenges, and Opportunity/Restraints
- 14.1 Market drivers
- 14.2 Market challenges
- 14.3 Impact of drivers and challenges
- Impact of drivers and challenges in 2024 and 2029
- 14.4 Market opportunities/restraints
15 Competitive Landscape
- 15.1 Overview
- 15.2 Competitive Landscape
- Overview on criticality of inputs and factors of differentiation
- 15.3 Landscape disruption
- Overview on factors of disruption
- 15.4 Industry risks
- Impact of key risks on business
16 Competitive Analysis
- 16.1 Companies profiled
- Companies covered
- 16.2 Company ranking index
- Company ranking index
- 16.3 Market positioning of companies
- Matrix on companies position and classification
- 16.4 Associated British Foods Plc
- Associated British Foods Plc - Overview
- Associated British Foods Plc - Business segments
- Associated British Foods Plc - Key offerings
- Associated British Foods Plc - Segment focus
- SWOT
- 16.5 Bayer AG
- Bayer AG - Overview
- Bayer AG - Business segments
- Bayer AG - Key news
- Bayer AG - Key offerings
- Bayer AG - Segment focus
- SWOT
- 16.6 BrasilAgro
- BrasilAgro - Overview
- BrasilAgro - Product / Service
- BrasilAgro - Key offerings
- SWOT
- 16.7 Bunge Ltd.
- Bunge Ltd. - Overview
- Bunge Ltd. - Business segments
- Bunge Ltd. - Key news
- Bunge Ltd. - Key offerings
- Bunge Ltd. - Segment focus
- SWOT
- 16.8 Cairo Poultry Co.
- Cairo Poultry Co. - Overview
- Cairo Poultry Co. - Product / Service
- Cairo Poultry Co. - Key offerings
- SWOT
- 16.9 Cargill Inc.
- Cargill Inc. - Overview
- Cargill Inc. - Product / Service
- Cargill Inc. - Key offerings
- SWOT
- 16.10 CHS Inc
- CHS Inc - Overview
- CHS Inc - Business segments
- CHS Inc - Key offerings
- CHS Inc - Segment focus
- SWOT
- 16.11 Dairy Farmers of America Inc.
- Dairy Farmers of America Inc. - Overview
- Dairy Farmers of America Inc. - Product / Service
- Dairy Farmers of America Inc. - Key offerings
- SWOT
- 16.12 DuPont de Nemours Inc.
- DuPont de Nemours Inc. - Overview
- DuPont de Nemours Inc. - Business segments
- DuPont de Nemours Inc. - Key news
- DuPont de Nemours Inc. - Key offerings
- DuPont de Nemours Inc. - Segment focus
- SWOT
- 16.13 Land O Lakes Inc.
- Land O Lakes Inc. - Overview
- Land O Lakes Inc. - Product / Service
- Land O Lakes Inc. - Key offerings
- SWOT
- 16.14 LT Foods
- LT Foods - Overview
- LT Foods - Product / Service
- LT Foods - Key offerings
- SWOT
- 16.15 Nestle SA
- Nestle SA - Overview
- Nestle SA - Business segments
- Nestle SA - Key news
- Nestle SA - Key offerings
- Nestle SA - Segment focus
- SWOT
- 16.16 Syngenta Crop Protection AG
- Syngenta Crop Protection AG - Overview
- Syngenta Crop Protection AG - Product / Service
- Syngenta Crop Protection AG - Key offerings
- SWOT
- 16.17 WH Group Ltd.
- WH Group Ltd. - Overview
- WH Group Ltd. - Business segments
- WH Group Ltd. - Key news
- WH Group Ltd. - Key offerings
- WH Group Ltd. - Segment focus
- SWOT
- 16.18 Wilmar International Ltd.
- Wilmar International Ltd. - Overview
- Wilmar International Ltd. - Business segments
- Wilmar International Ltd. - Key offerings
- Wilmar International Ltd. - Segment focus
- SWOT
17 Appendix
- 17.1 Scope of the report
- 17.2 Inclusions and exclusions checklist
- Inclusions checklist
- Exclusions checklist
- 17.3 Currency conversion rates for US$
- Currency conversion rates for US$
- 17.4 Research methodology
- Research methodology
- 17.5 Data procurement
- Information sources
- 17.6 Data validation
- Data validation
- 17.7 Validation techniques employed for market sizing
- Validation techniques employed for market sizing
- 17.8 Data synthesis
- Data synthesis
- 17.9 360 degree market analysis
- 360 degree market analysis
- 17.10 List of abbreviations
- List of abbreviations

