|
|
市場調査レポート
商品コード
1416085
前臨床動物行動の世界市場 2024-2028Global Preclinical Animal Behavior Market 2024-2028 |
||||||
|
|
|||||||
カスタマイズ可能
|
|||||||


| 前臨床動物行動の世界市場 2024-2028 |
|
出版日: 2024年01月11日
発行: TechNavio
ページ情報: 英文 155 Pages
納期: 即納可能
|

- 全表示
- 概要
- 図表
- 目次
概要
前臨床動物行動市場は2023-2028年に2,761万米ドル、予測期間中のCAGRは5.03%で成長すると予測されます。
当レポートでは、前臨床動物行動市場の全体的な分析、市場規模・予測、動向、成長促進要因、課題、約25のベンダーを網羅したベンダー分析などを掲載しています。
現在の市場シナリオ、最新動向と促進要因、市場環境全体に関する最新分析を提供しています。市場は、様々な慢性疾患や障害の有病率の増加、医薬品開発のための前臨床試験における動物の使用の増加、様々な疾患の前臨床研究や試験の増加によって牽引されています。
| 市場範囲 | |
|---|---|
| 基準年 | 2024 |
| 終了年 | 2028 |
| 予測期間 | 2024-2028 |
| 成長モメンタム | 加速 |
| 前年比2024年 | 4.58% |
| CAGR | 5.03% |
| 増分額 | 2,761万米ドル |
本調査では、ヘルスケア分野におけるデジタル化と自動化の進展が、今後数年間の前臨床動物行動市場の成長を牽引する主要因の1つであると分析しています。また、動物行動追跡システムにおける研究開発投資や技術革新の高まりは、市場の大きな需要につながっています。
目次
第1章 エグゼクティブサマリー
- 市場概要
第2章 市場情勢
- 市場エコシステム
第3章 市場規模
- 市場の定義
- 市場セグメント分析
- 市場規模 2023
- 市場の見通し 2023-2028
第4章 市場規模実績
- 前臨床動物行動の世界市場 2018-2022
- 用途別セグメント分析 2018-2022
- エンドユーザーセグメント分析 2018-2022
- 地域別セグメント分析 2018-2022
- 国別セグメント分析 2018-2022
第5章 ファイブフォース分析
- ファイブフォースの要約
- 買い手の交渉力
- 供給企業の交渉力
- 新規参入業者の脅威
- 代替品の脅威
- 競争の脅威
- 市況
第6章 市場セグメンテーション:用途別
- 市場セグメント
- 比較:用途別
- 小動物:市場規模と予測 2023-2028
- 大型動物:市場規模と予測 2023-2028
- 市場機会:用途別
第7章 市場セグメンテーション:エンドユーザー別
- 市場セグメント
- 比較:エンドユーザー別
- 工業研究所およびCRO:市場規模と予測 2023-2028
- 学術および政府の調査機関:市場規模と予測 2023-2028
- 市場機会:エンドユーザー別
第8章 顧客情勢
- 顧客情勢の概要
第9章 地域別情勢
- 地域別セグメンテーション
- 地域別比較
- 北米:市場規模と予測 2023-2028
- 欧州:市場規模と予測 2023-2028
- アジア:市場規模と予測 2023-2028
- 世界のその他の地域:市場規模と予測 2023-2028
- 米国:市場規模と予測 2023-2028
- ドイツ:市場規模と予測 2023-2028
- フランス:市場規模と予測 2023-2028
- 英国:市場規模と予測 2023-2028
- 日本:市場規模と予測 2023-2028
- 市場機会:地域情勢別
第10章 促進要因、課題、および動向
- 市場促進要因
- 市場の課題
- 促進要因と課題の影響
- 市場動向
第11章 ベンダー情勢
- 概要
- ベンダー情勢
- 混乱の状況
- 業界のリスク
第12章 ベンダー分析
- 対象ベンダー
- ベンダーの市場ポジショニング
- ANY-maze
- Biobserve GmbH
- Columbus Instruments LLC
- Conduct Science Inc.
- Harvard Bioscience Inc.
- Imetronic
- Intellibio
- Kinder Scientific
- Med Associates Inc.
- Mouse Specifics Inc.
- Muromachi Kikai Co. Ltd.
- Noldus Information Technology bv
- O HARA and CO., LTD.
- Omnitech Electronics Inc.
- Orchid Scientific and Innovative India Pvt. Ltd.
第13章 付録
Exhibits:
- Exhibits1: Executive Summary - Chart on Market Overview
- Exhibits2: Executive Summary - Data Table on Market Overview
- Exhibits3: Executive Summary - Chart on Global Market Characteristics
- Exhibits4: Executive Summary - Chart on Market By Geographical Landscape
- Exhibits5: Executive Summary - Chart on Market Segmentation by Application
- Exhibits6: Executive Summary - Chart on Market Segmentation by End-user
- Exhibits7: Executive Summary - Chart on Incremental Growth
- Exhibits8: Executive Summary - Data Table on Incremental Growth
- Exhibits9: Executive Summary - Chart on Vendor Market Positioning
- Exhibits10: Parent market
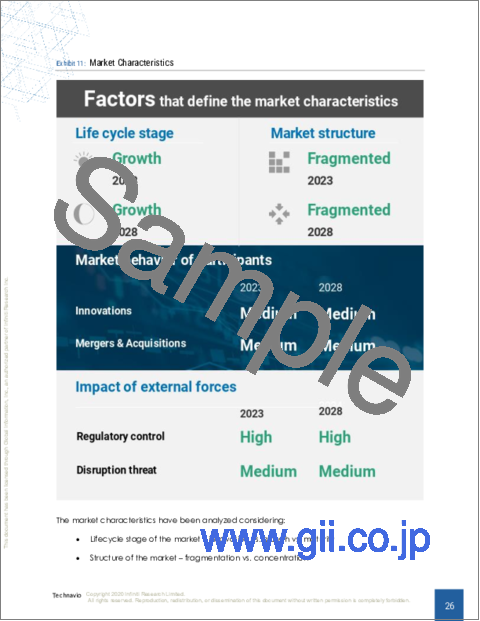
- Exhibits11: Market Characteristics
- Exhibits12: Offerings of vendors included in the market definition
- Exhibits13: Market segments
- Exhibits14: Chart on Global - Market size and forecast 2023-2028 ($ million)
- Exhibits15: Data Table on Global - Market size and forecast 2023-2028 ($ million)
- Exhibits16: Chart on Global Market: Year-over-year growth 2023-2028 (%)
- Exhibits17: Data Table on Global Market: Year-over-year growth 2023-2028 (%)
- Exhibits18: Historic Market Size - Data Table on global preclinical animal behavior market 2018 - 2022 ($ million)
- Exhibits19: Historic Market Size - Application Segment 2018 - 2022 ($ million)
- Exhibits20: Historic Market Size - End-user Segment 2018 - 2022 ($ million)
- Exhibits21: Historic Market Size - Geography Segment 2018 - 2022 ($ million)
- Exhibits22: Historic Market Size - Country Segment 2018 - 2022 ($ million)
- Exhibits23: Five forces analysis - Comparison between 2023 and 2028
- Exhibits24: Chart on Bargaining power of buyers - Impact of key factors 2023 and 2028
- Exhibits25: Bargaining power of suppliers - Impact of key factors in 2023 and 2028
- Exhibits26: Threat of new entrants - Impact of key factors in 2023 and 2028
- Exhibits27: Threat of substitutes - Impact of key factors in 2023 and 2028
- Exhibits28: Threat of rivalry - Impact of key factors in 2023 and 2028
- Exhibits29: Chart on Market condition - Five forces 2023 and 2028
- Exhibits30: Chart on Application - Market share 2023-2028 (%)
- Exhibits31: Data Table on Application - Market share 2023-2028 (%)
- Exhibits32: Chart on Comparison by Application
- Exhibits33: Data Table on Comparison by Application
- Exhibits34: Chart on Small animals - Market size and forecast 2023-2028 ($ million)
- Exhibits35: Data Table on Small animals - Market size and forecast 2023-2028 ($ million)
- Exhibits36: Chart on Small animals - Year-over-year growth 2023-2028 (%)
- Exhibits37: Data Table on Small animals - Year-over-year growth 2023-2028 (%)
- Exhibits38: Chart on Large animals - Market size and forecast 2023-2028 ($ million)
- Exhibits39: Data Table on Large animals - Market size and forecast 2023-2028 ($ million)
- Exhibits40: Chart on Large animals - Year-over-year growth 2023-2028 (%)
- Exhibits41: Data Table on Large animals - Year-over-year growth 2023-2028 (%)
- Exhibits42: Market opportunity by Application ($ million)
- Exhibits43: Data Table on Market opportunity by Application ($ million)
- Exhibits44: Chart on End-user - Market share 2023-2028 (%)
- Exhibits45: Data Table on End-user - Market share 2023-2028 (%)
- Exhibits46: Chart on Comparison by End-user
- Exhibits47: Data Table on Comparison by End-user
- Exhibits48: Chart on Industrial laboratories and CROs - Market size and forecast 2023-2028 ($ million)
- Exhibits49: Data Table on Industrial laboratories and CROs - Market size and forecast 2023-2028 ($ million)
- Exhibits50: Chart on Industrial laboratories and CROs - Year-over-year growth 2023-2028 (%)
- Exhibits51: Data Table on Industrial laboratories and CROs - Year-over-year growth 2023-2028 (%)
- Exhibits52: Chart on Academic and government research laboratories - Market size and forecast 2023-2028 ($ million)
- Exhibits53: Data Table on Academic and government research laboratories - Market size and forecast 2023-2028 ($ million)
- Exhibits54: Chart on Academic and government research laboratories - Year-over-year growth 2023-2028 (%)
- Exhibits55: Data Table on Academic and government research laboratories - Year-over-year growth 2023-2028 (%)
- Exhibits56: Market opportunity by End-user ($ million)
- Exhibits57: Data Table on Market opportunity by End-user ($ million)
- Exhibits58: Analysis of price sensitivity, lifecycle, customer purchase basket, adoption rates, and purchase criteria
- Exhibits59: Chart on Market share By Geographical Landscape 2023-2028 (%)
- Exhibits60: Data Table on Market share By Geographical Landscape 2023-2028 (%)
- Exhibits61: Chart on Geographic comparison
- Exhibits62: Data Table on Geographic comparison
- Exhibits63: Chart on North America - Market size and forecast 2023-2028 ($ million)
- Exhibits64: Data Table on North America - Market size and forecast 2023-2028 ($ million)
- Exhibits65: Chart on North America - Year-over-year growth 2023-2028 (%)
- Exhibits66: Data Table on North America - Year-over-year growth 2023-2028 (%)
- Exhibits67: Chart on Europe - Market size and forecast 2023-2028 ($ million)
- Exhibits68: Data Table on Europe - Market size and forecast 2023-2028 ($ million)
- Exhibits69: Chart on Europe - Year-over-year growth 2023-2028 (%)
- Exhibits70: Data Table on Europe - Year-over-year growth 2023-2028 (%)
- Exhibits71: Chart on Asia - Market size and forecast 2023-2028 ($ million)
- Exhibits72: Data Table on Asia - Market size and forecast 2023-2028 ($ million)
- Exhibits73: Chart on Asia - Year-over-year growth 2023-2028 (%)
- Exhibits74: Data Table on Asia - Year-over-year growth 2023-2028 (%)
- Exhibits75: Chart on Rest of World (ROW) - Market size and forecast 2023-2028 ($ million)
- Exhibits76: Data Table on Rest of World (ROW) - Market size and forecast 2023-2028 ($ million)
- Exhibits77: Chart on Rest of World (ROW) - Year-over-year growth 2023-2028 (%)
- Exhibits78: Data Table on Rest of World (ROW) - Year-over-year growth 2023-2028 (%)
- Exhibits79: Chart on US - Market size and forecast 2023-2028 ($ million)
- Exhibits80: Data Table on US - Market size and forecast 2023-2028 ($ million)
- Exhibits81: Chart on US - Year-over-year growth 2023-2028 (%)
- Exhibits82: Data Table on US - Year-over-year growth 2023-2028 (%)
- Exhibits83: Chart on Germany - Market size and forecast 2023-2028 ($ million)
- Exhibits84: Data Table on Germany - Market size and forecast 2023-2028 ($ million)
- Exhibits85: Chart on Germany - Year-over-year growth 2023-2028 (%)
- Exhibits86: Data Table on Germany - Year-over-year growth 2023-2028 (%)
- Exhibits87: Chart on France - Market size and forecast 2023-2028 ($ million)
- Exhibits88: Data Table on France - Market size and forecast 2023-2028 ($ million)
- Exhibits89: Chart on France - Year-over-year growth 2023-2028 (%)
- Exhibits90: Data Table on France - Year-over-year growth 2023-2028 (%)
- Exhibits91: Chart on UK - Market size and forecast 2023-2028 ($ million)
- Exhibits92: Data Table on UK - Market size and forecast 2023-2028 ($ million)
- Exhibits93: Chart on UK - Year-over-year growth 2023-2028 (%)
- Exhibits94: Data Table on UK - Year-over-year growth 2023-2028 (%)
- Exhibits95: Chart on Japan - Market size and forecast 2023-2028 ($ million)
- Exhibits96: Data Table on Japan - Market size and forecast 2023-2028 ($ million)
- Exhibits97: Chart on Japan - Year-over-year growth 2023-2028 (%)
- Exhibits98: Data Table on Japan - Year-over-year growth 2023-2028 (%)
- Exhibits99: Market opportunity By Geographical Landscape ($ million)
- Exhibits100: Data Tables on Market opportunity By Geographical Landscape ($ million)
- Exhibits101: Impact of drivers and challenges in 2023 and 2028
- Exhibits102: Overview on Criticality of inputs and Factors of differentiation
- Exhibits103: Overview on factors of disruption
- Exhibits104: Impact of key risks on business
- Exhibits105: Vendors covered
- Exhibits106: Matrix on vendor position and classification
- Exhibits107: ANY-maze - Overview
- Exhibits108: ANY-maze - Product / Service
- Exhibits109: ANY-maze - Key offerings
- Exhibits110: Biobserve GmbH - Overview
- Exhibits111: Biobserve GmbH - Product / Service
- Exhibits112: Biobserve GmbH - Key offerings
- Exhibits113: Columbus Instruments LLC - Overview
- Exhibits114: Columbus Instruments LLC - Product / Service
- Exhibits115: Columbus Instruments LLC - Key offerings
- Exhibits116: Conduct Science Inc. - Overview
- Exhibits117: Conduct Science Inc. - Product / Service
- Exhibits118: Conduct Science Inc. - Key offerings
- Exhibits119: Harvard Bioscience Inc. - Overview
- Exhibits120: Harvard Bioscience Inc. - Product / Service
- Exhibits121: Harvard Bioscience Inc. - Key offerings
- Exhibits122: Imetronic - Overview
- Exhibits123: Imetronic - Product / Service
- Exhibits124: Imetronic - Key offerings
- Exhibits125: Intellibio - Overview
- Exhibits126: Intellibio - Product / Service
- Exhibits127: Intellibio - Key offerings
- Exhibits128: Kinder Scientific - Overview
- Exhibits129: Kinder Scientific - Product / Service
- Exhibits130: Kinder Scientific - Key offerings
- Exhibits131: Med Associates Inc. - Overview
- Exhibits132: Med Associates Inc. - Product / Service
- Exhibits133: Med Associates Inc. - Key offerings
- Exhibits134: Mouse Specifics Inc. - Overview
- Exhibits135: Mouse Specifics Inc. - Product / Service
- Exhibits136: Mouse Specifics Inc. - Key offerings
- Exhibits137: Muromachi Kikai Co. Ltd. - Overview
- Exhibits138: Muromachi Kikai Co. Ltd. - Product / Service
- Exhibits139: Muromachi Kikai Co. Ltd. - Key offerings
- Exhibits140: Noldus Information Technology bv - Overview
- Exhibits141: Noldus Information Technology bv - Product / Service
- Exhibits142: Noldus Information Technology bv - Key offerings
- Exhibits143: O HARA and CO., LTD. - Overview
- Exhibits144: O HARA and CO., LTD. - Product / Service
- Exhibits145: O HARA and CO., LTD. - Key offerings
- Exhibits146: Omnitech Electronics Inc. - Overview
- Exhibits147: Omnitech Electronics Inc. - Product / Service
- Exhibits148: Omnitech Electronics Inc. - Key offerings
- Exhibits149: Orchid Scientific and Innovative India Pvt. Ltd. - Overview
- Exhibits150: Orchid Scientific and Innovative India Pvt. Ltd. - Product / Service
- Exhibits151: Orchid Scientific and Innovative India Pvt. Ltd. - Key offerings
- Exhibits152: Inclusions checklist
- Exhibits153: Exclusions checklist
- Exhibits154: Currency conversion rates for US$
- Exhibits155: Research methodology
- Exhibits156: Validation techniques employed for market sizing
- Exhibits157: Information sources
- Exhibits158: List of abbreviations
Abstract
The preclinical animal behavior market is forecasted to grow by USD 27.61 mn during 2023-2028, accelerating at a CAGR of 5.03% during the forecast period. The report on the preclinical animal behavior market provides a holistic analysis, market size and forecast, trends, growth drivers, and challenges, as well as vendor analysis covering around 25 vendors.
The report offers an up-to-date analysis regarding the current market scenario, the latest trends and drivers, and the overall market environment. The market is driven by increasing prevalence of various chronic diseases and disorders, increasing use of animals in preclinical trials for drug development, and rise in preclinical research and testing for various diseases.
| Market Scope | |
|---|---|
| Base Year | 2024 |
| End Year | 2028 |
| Series Year | 2024-2028 |
| Growth Momentum | Accelerate |
| YOY 2024 | 4.58% |
| CAGR | 5.03% |
| Incremental Value | $27.61mn |
Technavio's preclinical animal behavior market is segmented as below:
By Application
- Small animals
- Large animals
By End-user
- Industrial laboratories
- CROs
- Academic
- government research laboratories
By Geographical Landscape
- North America
- Europe
- Asia
- Rest of World (ROW)
This study identifies the increase in digitization and automation in healthcare sector as one of the prime reasons driving the preclinical animal behavior market growth during the next few years. Also, rising investments in r and d and innovations in animal behavior tracking systems will lead to sizable demand in the market.
The report on the preclinical animal behavior market covers the following areas:
- Preclinical animal behavior market sizing
- Preclinical animal behavior market forecast
- Preclinical animal behavior market industry analysis
The robust vendor analysis is designed to help clients improve their market position, and in line with this, this report provides a detailed analysis of several leading preclinical animal behavior market vendors that include ANY-maze, Biobserve GmbH, Columbus Instruments LLC, Conduct Science Inc., Harvard Bioscience Inc., Imetronic, Intellibio, Kinder Scientific, Mouse Specifics Inc., Muromachi Kikai Co. Ltd., Noldus Information Technology bv, O HARA and CO., LTD., Omnitech Electronics Inc., Orchid Scientific and Innovative India Pvt. Ltd., PhenoSys GmbH, Sable Systems International, San Diego Instruments Inc., Signal Solutions LLC, Med Associates Inc., and Tecniplast Spa. Also, the preclinical animal behavior market analysis report includes information on upcoming trends and challenges that will influence market growth. This is to help companies strategize and leverage all forthcoming growth opportunities.
The study was conducted using an objective combination of primary and secondary information including inputs from key participants in the industry. The report contains a comprehensive market and vendor landscape in addition to an analysis of the key vendors.
The publisher presents a detailed picture of the market by the way of study, synthesis, and summation of data from multiple sources by an analysis of key parameters such as profit, pricing, competition, and promotions. It presents various market facets by identifying the key industry influencers. The data presented is comprehensive, reliable, and a result of extensive research - both primary and secondary. The market research reports provide a complete competitive landscape and an in-depth vendor selection methodology and analysis using qualitative and quantitative research to forecast the accurate market growth.
Table of Contents
1 Executive Summary
- 1.1 Market overview
- Exhibit 01: Executive Summary - Chart on Market Overview
- Exhibit 02: Executive Summary - Data Table on Market Overview
- Exhibit 03: Executive Summary - Chart on Global Market Characteristics
- Exhibit 04: Executive Summary - Chart on Market By Geographical Landscape
- Exhibit 05: Executive Summary - Chart on Market Segmentation by Application
- Exhibit 06: Executive Summary - Chart on Market Segmentation by End-user
- Exhibit 07: Executive Summary - Chart on Incremental Growth
- Exhibit 08: Executive Summary - Data Table on Incremental Growth
- Exhibit 09: Executive Summary - Chart on Vendor Market Positioning
2 Market Landscape
- 2.1 Market ecosystem
- Exhibit 10: Parent market
- Exhibit 11: Market Characteristics
3 Market Sizing
- 3.1 Market definition
- Exhibit 12: Offerings of vendors included in the market definition
- 3.2 Market segment analysis
- Exhibit 13: Market segments
- 3.3 Market size 2023
- 3.4 Market outlook: Forecast for 2023-2028
- Exhibit 14: Chart on Global - Market size and forecast 2023-2028 ($ million)
- Exhibit 15: Data Table on Global - Market size and forecast 2023-2028 ($ million)
- Exhibit 16: Chart on Global Market: Year-over-year growth 2023-2028 (%)
- Exhibit 17: Data Table on Global Market: Year-over-year growth 2023-2028 (%)
4 Historic Market Size
- 4.1 Global preclinical animal behavior market 2018 - 2022
- Exhibit 18: Historic Market Size - Data Table on global preclinical animal behavior market 2018 - 2022 ($ million)
- 4.2 Application Segment Analysis 2018 - 2022
- Exhibit 19: Historic Market Size - Application Segment 2018 - 2022 ($ million)
- 4.3 End-user Segment Analysis 2018 - 2022
- Exhibit 20: Historic Market Size - End-user Segment 2018 - 2022 ($ million)
- 4.4 Geography Segment Analysis 2018 - 2022
- Exhibit 21: Historic Market Size - Geography Segment 2018 - 2022 ($ million)
- 4.5 Country Segment Analysis 2018 - 2022
- Exhibit 22: Historic Market Size - Country Segment 2018 - 2022 ($ million)
5 Five Forces Analysis
- 5.1 Five forces summary
- Exhibit 23: Five forces analysis - Comparison between 2023 and 2028
- 5.2 Bargaining power of buyers
- Exhibit 24: Chart on Bargaining power of buyers - Impact of key factors 2023 and 2028
- 5.3 Bargaining power of suppliers
- Exhibit 25: Bargaining power of suppliers - Impact of key factors in 2023 and 2028
- 5.4 Threat of new entrants
- Exhibit 26: Threat of new entrants - Impact of key factors in 2023 and 2028
- 5.5 Threat of substitutes
- Exhibit 27: Threat of substitutes - Impact of key factors in 2023 and 2028
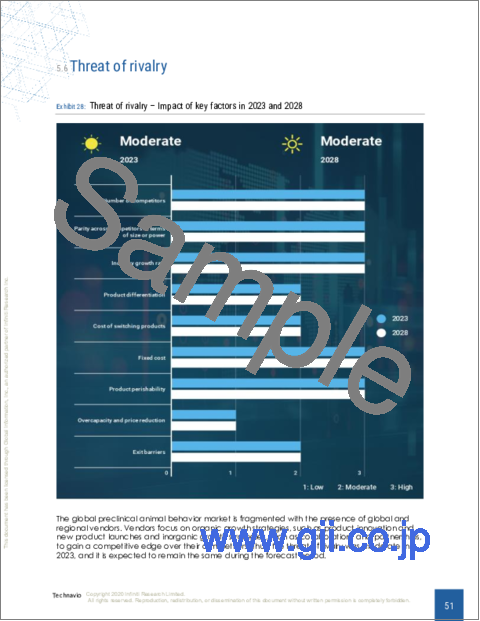
- 5.6 Threat of rivalry
- Exhibit 28: Threat of rivalry - Impact of key factors in 2023 and 2028
- 5.7 Market condition
- Exhibit 29: Chart on Market condition - Five forces 2023 and 2028
6 Market Segmentation by Application
- 6.1 Market segments
- Exhibit 30: Chart on Application - Market share 2023-2028 (%)
- Exhibit 31: Data Table on Application - Market share 2023-2028 (%)
- 6.2 Comparison by Application
- Exhibit 32: Chart on Comparison by Application
- Exhibit 33: Data Table on Comparison by Application
- 6.3 Small animals - Market size and forecast 2023-2028
- Exhibit 34: Chart on Small animals - Market size and forecast 2023-2028 ($ million)
- Exhibit 35: Data Table on Small animals - Market size and forecast 2023-2028 ($ million)
- Exhibit 36: Chart on Small animals - Year-over-year growth 2023-2028 (%)
- Exhibit 37: Data Table on Small animals - Year-over-year growth 2023-2028 (%)
- 6.4 Large animals - Market size and forecast 2023-2028
- Exhibit 38: Chart on Large animals - Market size and forecast 2023-2028 ($ million)
- Exhibit 39: Data Table on Large animals - Market size and forecast 2023-2028 ($ million)
- Exhibit 40: Chart on Large animals - Year-over-year growth 2023-2028 (%)
- Exhibit 41: Data Table on Large animals - Year-over-year growth 2023-2028 (%)
- 6.5 Market opportunity by Application
- Exhibit 42: Market opportunity by Application ($ million)
- Exhibit 43: Data Table on Market opportunity by Application ($ million)
7 Market Segmentation by End-user
- 7.1 Market segments
- Exhibit 44: Chart on End-user - Market share 2023-2028 (%)
- Exhibit 45: Data Table on End-user - Market share 2023-2028 (%)
- 7.2 Comparison by End-user
- Exhibit 46: Chart on Comparison by End-user
- Exhibit 47: Data Table on Comparison by End-user
- 7.3 Industrial laboratories and CROs - Market size and forecast 2023-2028
- Exhibit 48: Chart on Industrial laboratories and CROs - Market size and forecast 2023-2028 ($ million)
- Exhibit 49: Data Table on Industrial laboratories and CROs - Market size and forecast 2023-2028 ($ million)
- Exhibit 50: Chart on Industrial laboratories and CROs - Year-over-year growth 2023-2028 (%)
- Exhibit 51: Data Table on Industrial laboratories and CROs - Year-over-year growth 2023-2028 (%)
- 7.4 Academic and government research laboratories - Market size and forecast 2023-2028
- Exhibit 52: Chart on Academic and government research laboratories - Market size and forecast 2023-2028 ($ million)
- Exhibit 53: Data Table on Academic and government research laboratories - Market size and forecast 2023-2028 ($ million)
- Exhibit 54: Chart on Academic and government research laboratories - Year-over-year growth 2023-2028 (%)
- Exhibit 55: Data Table on Academic and government research laboratories - Year-over-year growth 2023-2028 (%)
- 7.5 Market opportunity by End-user
- Exhibit 56: Market opportunity by End-user ($ million)
- Exhibit 57: Data Table on Market opportunity by End-user ($ million)
8 Customer Landscape
- 8.1 Customer landscape overview
- Exhibit 58: Analysis of price sensitivity, lifecycle, customer purchase basket, adoption rates, and purchase criteria
9 Geographic Landscape
- 9.1 Geographic segmentation
- Exhibit 59: Chart on Market share By Geographical Landscape 2023-2028 (%)
- Exhibit 60: Data Table on Market share By Geographical Landscape 2023-2028 (%)
- 9.2 Geographic comparison
- Exhibit 61: Chart on Geographic comparison
- Exhibit 62: Data Table on Geographic comparison
- 9.3 North America - Market size and forecast 2023-2028
- Exhibit 63: Chart on North America - Market size and forecast 2023-2028 ($ million)
- Exhibit 64: Data Table on North America - Market size and forecast 2023-2028 ($ million)
- Exhibit 65: Chart on North America - Year-over-year growth 2023-2028 (%)
- Exhibit 66: Data Table on North America - Year-over-year growth 2023-2028 (%)
- 9.4 Europe - Market size and forecast 2023-2028
- Exhibit 67: Chart on Europe - Market size and forecast 2023-2028 ($ million)
- Exhibit 68: Data Table on Europe - Market size and forecast 2023-2028 ($ million)
- Exhibit 69: Chart on Europe - Year-over-year growth 2023-2028 (%)
- Exhibit 70: Data Table on Europe - Year-over-year growth 2023-2028 (%)
- 9.5 Asia - Market size and forecast 2023-2028
- Exhibit 71: Chart on Asia - Market size and forecast 2023-2028 ($ million)
- Exhibit 72: Data Table on Asia - Market size and forecast 2023-2028 ($ million)
- Exhibit 73: Chart on Asia - Year-over-year growth 2023-2028 (%)
- Exhibit 74: Data Table on Asia - Year-over-year growth 2023-2028 (%)
- 9.6 Rest of World (ROW) - Market size and forecast 2023-2028
- Exhibit 75: Chart on Rest of World (ROW) - Market size and forecast 2023-2028 ($ million)
- Exhibit 76: Data Table on Rest of World (ROW) - Market size and forecast 2023-2028 ($ million)
- Exhibit 77: Chart on Rest of World (ROW) - Year-over-year growth 2023-2028 (%)
- Exhibit 78: Data Table on Rest of World (ROW) - Year-over-year growth 2023-2028 (%)
- 9.7 US - Market size and forecast 2023-2028
- Exhibit 79: Chart on US - Market size and forecast 2023-2028 ($ million)
- Exhibit 80: Data Table on US - Market size and forecast 2023-2028 ($ million)
- Exhibit 81: Chart on US - Year-over-year growth 2023-2028 (%)
- Exhibit 82: Data Table on US - Year-over-year growth 2023-2028 (%)
- 9.8 Germany - Market size and forecast 2023-2028
- Exhibit 83: Chart on Germany - Market size and forecast 2023-2028 ($ million)
- Exhibit 84: Data Table on Germany - Market size and forecast 2023-2028 ($ million)
- Exhibit 85: Chart on Germany - Year-over-year growth 2023-2028 (%)
- Exhibit 86: Data Table on Germany - Year-over-year growth 2023-2028 (%)
- 9.9 France - Market size and forecast 2023-2028
- Exhibit 87: Chart on France - Market size and forecast 2023-2028 ($ million)
- Exhibit 88: Data Table on France - Market size and forecast 2023-2028 ($ million)
- Exhibit 89: Chart on France - Year-over-year growth 2023-2028 (%)
- Exhibit 90: Data Table on France - Year-over-year growth 2023-2028 (%)
- 9.10 UK - Market size and forecast 2023-2028
- Exhibit 91: Chart on UK - Market size and forecast 2023-2028 ($ million)
- Exhibit 92: Data Table on UK - Market size and forecast 2023-2028 ($ million)
- Exhibit 93: Chart on UK - Year-over-year growth 2023-2028 (%)
- Exhibit 94: Data Table on UK - Year-over-year growth 2023-2028 (%)
- 9.11 Japan - Market size and forecast 2023-2028
- Exhibit 95: Chart on Japan - Market size and forecast 2023-2028 ($ million)
- Exhibit 96: Data Table on Japan - Market size and forecast 2023-2028 ($ million)
- Exhibit 97: Chart on Japan - Year-over-year growth 2023-2028 (%)
- Exhibit 98: Data Table on Japan - Year-over-year growth 2023-2028 (%)
- 9.12 Market opportunity By Geographical Landscape
- Exhibit 99: Market opportunity By Geographical Landscape ($ million)
- Exhibit 100: Data Tables on Market opportunity By Geographical Landscape ($ million)
10 Drivers, Challenges, and Trends
- 10.1 Market drivers
- 10.2 Market challenges
- 10.3 Impact of drivers and challenges
- Exhibit 101: Impact of drivers and challenges in 2023 and 2028
- 10.4 Market trends
11 Vendor Landscape
- 11.1 Overview
- 11.2 Vendor landscape
- Exhibit 102: Overview on Criticality of inputs and Factors of differentiation
- 11.3 Landscape disruption
- Exhibit 103: Overview on factors of disruption
- 11.4 Industry risks
- Exhibit 104: Impact of key risks on business
12 Vendor Analysis
- 12.1 Vendors covered
- Exhibit 105: Vendors covered
- 12.2 Market positioning of vendors
- Exhibit 106: Matrix on vendor position and classification
- 12.3 ANY-maze
- Exhibit 107: ANY-maze - Overview
- Exhibit 108: ANY-maze - Product / Service
- Exhibit 109: ANY-maze - Key offerings
- 12.4 Biobserve GmbH
- Exhibit 110: Biobserve GmbH - Overview
- Exhibit 111: Biobserve GmbH - Product / Service
- Exhibit 112: Biobserve GmbH - Key offerings
- 12.5 Columbus Instruments LLC
- Exhibit 113: Columbus Instruments LLC - Overview
- Exhibit 114: Columbus Instruments LLC - Product / Service
- Exhibit 115: Columbus Instruments LLC - Key offerings
- 12.6 Conduct Science Inc.
- Exhibit 116: Conduct Science Inc. - Overview
- Exhibit 117: Conduct Science Inc. - Product / Service
- Exhibit 118: Conduct Science Inc. - Key offerings
- 12.7 Harvard Bioscience Inc.
- Exhibit 119: Harvard Bioscience Inc. - Overview
- Exhibit 120: Harvard Bioscience Inc. - Product / Service
- Exhibit 121: Harvard Bioscience Inc. - Key offerings
- 12.8 Imetronic
- Exhibit 122: Imetronic - Overview
- Exhibit 123: Imetronic - Product / Service
- Exhibit 124: Imetronic - Key offerings
- 12.9 Intellibio
- Exhibit 125: Intellibio - Overview
- Exhibit 126: Intellibio - Product / Service
- Exhibit 127: Intellibio - Key offerings
- 12.10 Kinder Scientific
- Exhibit 128: Kinder Scientific - Overview
- Exhibit 129: Kinder Scientific - Product / Service
- Exhibit 130: Kinder Scientific - Key offerings
- 12.11 Med Associates Inc.
- Exhibit 131: Med Associates Inc. - Overview
- Exhibit 132: Med Associates Inc. - Product / Service
- Exhibit 133: Med Associates Inc. - Key offerings
- 12.12 Mouse Specifics Inc.
- Exhibit 134: Mouse Specifics Inc. - Overview
- Exhibit 135: Mouse Specifics Inc. - Product / Service
- Exhibit 136: Mouse Specifics Inc. - Key offerings
- 12.13 Muromachi Kikai Co. Ltd.
- Exhibit 137: Muromachi Kikai Co. Ltd. - Overview
- Exhibit 138: Muromachi Kikai Co. Ltd. - Product / Service
- Exhibit 139: Muromachi Kikai Co. Ltd. - Key offerings
- 12.14 Noldus Information Technology bv
- Exhibit 140: Noldus Information Technology bv - Overview
- Exhibit 141: Noldus Information Technology bv - Product / Service
- Exhibit 142: Noldus Information Technology bv - Key offerings
- 12.15 O HARA and CO., LTD.
- Exhibit 143: O HARA and CO., LTD. - Overview
- Exhibit 144: O HARA and CO., LTD. - Product / Service
- Exhibit 145: O HARA and CO., LTD. - Key offerings
- 12.16 Omnitech Electronics Inc.
- Exhibit 146: Omnitech Electronics Inc. - Overview
- Exhibit 147: Omnitech Electronics Inc. - Product / Service
- Exhibit 148: Omnitech Electronics Inc. - Key offerings
- 12.17 Orchid Scientific and Innovative India Pvt. Ltd.
- Exhibit 149: Orchid Scientific and Innovative India Pvt. Ltd. - Overview
- Exhibit 150: Orchid Scientific and Innovative India Pvt. Ltd. - Product / Service
- Exhibit 151: Orchid Scientific and Innovative India Pvt. Ltd. - Key offerings
13 Appendix
- 13.1 Scope of the report
- 13.2 Inclusions and exclusions checklist
- Exhibit 152: Inclusions checklist
- Exhibit 153: Exclusions checklist
- 13.3 Currency conversion rates for US$
- Exhibit 154: Currency conversion rates for US$
- 13.4 Research methodology
- Exhibit 155: Research methodology
- Exhibit 156: Validation techniques employed for market sizing
- Exhibit 157: Information sources
- 13.5 List of abbreviations
- Exhibit 158: List of abbreviations
