|
|
市場調査レポート
商品コード
1666758
インテリジェントポンプおよび制御システムの世界市場 2025~2029年Global Intelligent Pump and Control Systems Market 2025-2029 |
||||||

|
|||||||
カスタマイズ可能
|
|||||||


| インテリジェントポンプおよび制御システムの世界市場 2025~2029年 |
|
出版日: 2025年02月21日
発行: TechNavio
ページ情報: 英文 241 Pages
納期: 即納可能
|

全表示
- 概要
- 目次
インテリジェントポンプおよび制御システム市場は、2024~2029年にかけて12億300万米ドル、予測期間中のCAGRは9%で成長すると予測されています。
当レポートでは、インテリジェントポンプおよび制御システム市場の全体的な分析、市場規模・予測、動向、成長促進要因、課題、約25のベンダーを網羅したベンダー分析などを掲載しています。
現在の市場シナリオ、最新動向と促進要因、市場環境全体に関する最新分析を提供しています。市場は、モーター機能の効率性、エンドユーザー産業における適切な監視と流量制御の必要性、産業におけるコストとエネルギーの節約によって牽引されています。
| 市場範囲 | |
|---|---|
| 基準年 | 2025年 |
| 終了年 | 2029年 |
| 予測期間 | 2025~2029年 |
| 成長モメンタム | 加速 |
| 前年比2025年 | 8% |
| CAGR | 9% |
| 増分額 | 12億300万米ドル |
本調査は、業界の主要参加者からのインプットを含め、一次情報と二次情報を客観的に組み合わせて実施しました。本レポートには、主要企業の分析に加え、包括的な市場規模データ、地域別分析によるセグメント、ベンダー情勢が含まれています。レポートには履歴データと予測データがあります。
本調査では、今後数年間のインテリジェントポンプおよび制御システム市場の成長を促進する主要な理由の1つとして、インテリジェントポンプにおけるワイヤレス制御とモニタリングを挙げています。また、産業オートメーションにおけるIIoTとBDAの役割、インテリジェントポンプにおける遠隔状態監視システムは、市場の大きな需要につながります。
目次
第1章 エグゼクティブサマリー
- 市場概要
第2章 Technavio別分析
- 価格・ライフサイクル・顧客購入バスケット・採用率・購入基準の分析
- インプットの重要性と差別化の要因
- 混乱の要因
- 促進要因と課題の影響
第3章 市場情勢
- 市場エコシステム
- 市場の特徴
- バリューチェーン分析
第4章 市場規模
- 市場の定義
- 市場セグメント分析
- 市場規模 2024年
- 市場展望 2024~2029年
第5章 市場規模実績
- インテリジェントポンプおよび制御システムの世界市場 2019~2023年
- コンポーネント別セグメント分析 2019~2023年
- タイプ別セグメント分析 2019~2023年
- エンドユーザー別セグメント分析 2019~2023年
- 用途別セグメント分析 2019~2023年
- 地域別セグメント分析 2019~2023年
- 国別セグメント分析 2019~2023年
第6章 定性分析
- AIの影響:インテリジェントポンプおよび制御システムの世界市場
第7章 ファイブフォース分析
- ファイブフォースの要約
- 買い手の交渉力
- 供給企業の交渉力
- 新規参入業者の脅威
- 代替品の脅威
- 競争の脅威
- 市況
第8章 市場セグメンテーション:コンポーネント別
- 市場セグメント
- 比較:コンポーネント別
- インテリジェントポンプ:市場規模と予測 2024~2029年
- 制御システム:市場規模と予測 2024~2029年
- 市場機会:コンポーネント別
第9章 市場セグメンテーション:タイプ別
- 市場セグメント
- 比較:タイプ別
- 遠心ポンプ:市場規模と予測 2024~2029年
- 容積式ポンプ:市場規模と予測 2024~2029年
- 市場機会:タイプ別
第10章 市場セグメンテーション:エンドユーザー別
- 市場セグメント
- 比較:エンドユーザー別
- 上下水道処理産業:市場規模と予測 2024~2029年
- 石油・ガス産業:市場規模と予測 2024~2029年
- 化学・石油化学産業:市場規模と予測 2024~2029年
- 電力産業:市場規模と予測 2024~2029年
- その他:市場規模と予測 2024~2029年
- 市場機会:エンドユーザー別
第11章 市場セグメンテーション:用途別
- 市場セグメント
- 比較:用途別
- フロー制御:市場規模と予測 2024~2029年
- 液体移送:市場規模と予測 2024~2029年
- 圧力ブースト:市場規模と予測 2024~2029年
- その他:市場規模と予測 2024~2029年
- 市場機会:用途別
第12章 顧客情勢
- 顧客情勢の概要
第13章 地域別情勢
- 地域別セグメンテーション
- 地域別比較
- アジア太平洋:市場規模と予測 2024~2029年
- 北米:市場規模と予測 2024~2029年
- 欧州:市場規模と予測 2024~2029年
- 中東・アフリカ:市場規模と予測 2024~2029年
- 南米:市場規模と予測 2024~2029年
- 米国:市場規模と予測 2024~2029年
- 中国:市場規模と予測 2024~2029年
- 日本:市場規模と予測 2024~2029年
- カナダ:市場規模と予測 2024~2029年
- インド:市場規模と予測 2024~2029年
- 韓国:市場規模と予測 2024~2029年
- ドイツ:市場規模と予測 2024~2029年
- フランス:市場規模と予測 2024~2029年
- イタリア:市場規模と予測 2024~2029年
- 市場機会:地域情勢別
第14章 促進要因・課題・機会・抑制要因
- 市場促進要因
- 市場の課題
- 促進要因と課題の影響
- 市場の機会・抑制要因
第15章 競合情勢
- 概要
- 競合情勢
- 混乱の状況
- 業界のリスク
第16章 競合分析
- 企業プロファイル
- 企業ランキング指数
- 企業の市場ポジショニング
- ABB Ltd.
- Alfa Laval AB
- CIRCOR International Inc.
- Flowserve Corp.
- Grundfos Holding AS
- ITT PRO Services
- Ketek Group
- Kirloskar Brothers Ltd.
- KSB SE and Co. KGaA
- Liberty Pumps
- S.A. Armstrong Ltd.
- Sulzer Management Ltd.
- Unico LLC
- Xylem Inc.
- Yaskawa Electric Corp.
第17章 付録
The intelligent pump and control systems market is forecasted to grow by USD 1203 million during 2024-2029, accelerating at a CAGR of 9% during the forecast period. The report on the intelligent pump and control systems market provides a holistic analysis, market size and forecast, trends, growth drivers, and challenges, as well as vendor analysis covering around 25 vendors.
The report offers an up-to-date analysis regarding the current market scenario, the latest trends and drivers, and the overall market environment. The market is driven by efficiency in terms of motor functionality, need for proper monitoring and flow control in end-user industries, and cost and energy savings for industries.
| Market Scope | |
|---|---|
| Base Year | 2025 |
| End Year | 2029 |
| Series Year | 2025-2029 |
| Growth Momentum | Accelerate |
| YOY 2025 | 8% |
| CAGR | 9% |
| Incremental Value | $1203 mn |
The study was conducted using an objective combination of primary and secondary information including inputs from key participants in the industry. The report contains a comprehensive market size data, segment with regional analysis and vendor landscape in addition to an analysis of the key companies. Reports have historic and forecast data.
Technavio's intelligent pump and control systems market is segmented as below:
By Component
- Intelligent pumps
- Control systems
By Type
- Centrifugal pumps
- Positive displacement pumps
By End-user
- Water and wastewater industry
- Oil and gas industry
- Chemical and petrochemical industry
- Power industry
- Others
By Application
- Flow control
- Liquid transfer
- Pressure Boosting
- Others
By Geographical Landscape
- APAC
- North America
- Europe
- Middle East and Africa
- South America
This study identifies the wireless control and monitoring in intelligent pumps as one of the prime reasons driving the intelligent pump and control systems market growth during the next few years. Also, role of IIoT and bda in industrial automation and remote condition monitoring systems in intelligent pumps will lead to sizable demand in the market.
The report on the intelligent pump and control systems market covers the following areas:
- Intelligent Pump And Control Systems Market sizing
- Intelligent Pump And Control Systems Market forecast
- Intelligent Pump And Control Systems Market industry analysis
The robust vendor analysis is designed to help clients improve their market position, and in line with this, this report provides a detailed analysis of several leading intelligent pump and control systems market vendors that include ABB Ltd., Alfa Laval AB, CIRCOR International Inc., Dana SAC UK Ltd, Flowserve Corp., Grundfos Holding AS, HNP MIKROSYSTEME GMBH, ITT PRO Services, Ketek Group, Kirloskar Brothers Ltd., KSB SE and Co. KGaA, Liberty Pumps, Nidec Corp., Robert Bosch GmbH, S.A. Armstrong Ltd., Sulzer Ltd., Unico LLC, Wanner Engineering Inc, Xylem Inc., and Yaskawa Electric Corp.. Also, the intelligent pump and control systems market analysis report includes information on upcoming trends and challenges that will influence market growth. This is to help companies strategize and leverage all forthcoming growth opportunities.
The publisher presents a detailed picture of the market by the way of study, synthesis, and summation of data from multiple sources by an analysis of key parameters such as profit, pricing, competition, and promotions. It presents various market facets by identifying the key industry influencers. The data presented is comprehensive, reliable, and a result of extensive primary and secondary research. The market research reports provide a complete competitive landscape and an in-depth vendor selection methodology and analysis using qualitative and quantitative research to forecast accurate market growth.
Table of Contents
1 Executive Summary
- 1.1 Market overview
- Executive Summary - Chart on Market Overview
- Executive Summary - Data Table on Market Overview
- Executive Summary - Chart on Global Market Characteristics
- Executive Summary - Chart on Market By Geographical Landscape
- Executive Summary - Chart on Market Segmentation by Component
- Executive Summary - Chart on Market Segmentation by Type
- Executive Summary - Chart on Market Segmentation by End-user
- Executive Summary - Chart on Market Segmentation by Application
- Executive Summary - Chart on Incremental Growth
- Executive Summary - Data Table on Incremental Growth
- Executive Summary - Chart on Company Market Positioning
2 Technavio Analysis
- 2.1 Analysis of price sensitivity, lifecycle, customer purchase basket, adoption rates, and purchase criteria
- Analysis of price sensitivity, lifecycle, customer purchase basket, adoption rates, and purchase criteria
- 2.2 Criticality of inputs and Factors of differentiation
- Overview on criticality of inputs and factors of differentiation
- 2.3 Factors of disruption
- Overview on factors of disruption
- 2.4 Impact of drivers and challenges
- Impact of drivers and challenges in 2024 and 2029
3 Market Landscape
- 3.1 Market ecosystem
- Parent Market
- Data Table on - Parent Market
- 3.2 Market characteristics
- Market characteristics analysis
- 3.3 Value chain analysis
- Value chain analysis
4 Market Sizing
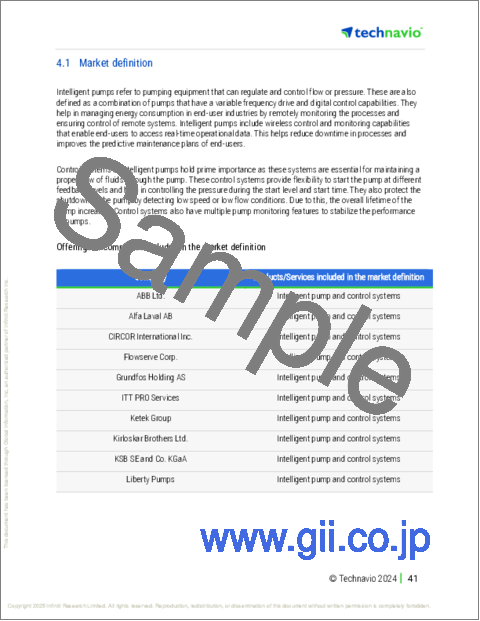
- 4.1 Market definition
- Offerings of companies included in the market definition
- 4.2 Market segment analysis
- Market segments
- 4.3 Market size 2024
- 4.4 Market outlook: Forecast for 2024-2029
- Chart on Global - Market size and forecast 2024-2029 ($ million)
- Data Table on Global - Market size and forecast 2024-2029 ($ million)
- Chart on Global Market: Year-over-year growth 2024-2029 (%)
- Data Table on Global Market: Year-over-year growth 2024-2029 (%)
5 Historic Market Size
- 5.1 Global Intelligent Pump And Control Systems Market 2019 - 2023
- Historic Market Size - Data Table on Global Intelligent Pump And Control Systems Market 2019 - 2023 ($ million)
- 5.2 Component segment analysis 2019 - 2023
- Historic Market Size - Component Segment 2019 - 2023 ($ million)
- 5.3 Type segment analysis 2019 - 2023
- Historic Market Size - Type Segment 2019 - 2023 ($ million)
- 5.4 End-user segment analysis 2019 - 2023
- Historic Market Size - End-user Segment 2019 - 2023 ($ million)
- 5.5 Application segment analysis 2019 - 2023
- Historic Market Size - Application Segment 2019 - 2023 ($ million)
- 5.6 Geography segment analysis 2019 - 2023
- Historic Market Size - Geography Segment 2019 - 2023 ($ million)
- 5.7 Country segment analysis 2019 - 2023
- Historic Market Size - Country Segment 2019 - 2023 ($ million)
6 Qualitative Analysis
- 6.1 Impact of AI on Global Intelligent Pump and Control Systems Market
7 Five Forces Analysis
- 7.1 Five forces summary
- Five forces analysis - Comparison between 2024 and 2029
- 7.2 Bargaining power of buyers
- Bargaining power of buyers - Impact of key factors 2024 and 2029
- 7.3 Bargaining power of suppliers
- Bargaining power of suppliers - Impact of key factors in 2024 and 2029
- 7.4 Threat of new entrants
- Threat of new entrants - Impact of key factors in 2024 and 2029
- 7.5 Threat of substitutes
- Threat of substitutes - Impact of key factors in 2024 and 2029
- 7.6 Threat of rivalry
- Threat of rivalry - Impact of key factors in 2024 and 2029
- 7.7 Market condition
- Chart on Market condition - Five forces 2024 and 2029
8 Market Segmentation by Component
- 8.1 Market segments
- Chart on Component - Market share 2024-2029 (%)
- Data Table on Component - Market share 2024-2029 (%)
- 8.2 Comparison by Component
- Chart on Comparison by Component
- Data Table on Comparison by Component
- 8.3 Intelligent pumps - Market size and forecast 2024-2029
- Chart on Intelligent pumps - Market size and forecast 2024-2029 ($ million)
- Data Table on Intelligent pumps - Market size and forecast 2024-2029 ($ million)
- Chart on Intelligent pumps - Year-over-year growth 2024-2029 (%)
- Data Table on Intelligent pumps - Year-over-year growth 2024-2029 (%)
- 8.4 Control systems - Market size and forecast 2024-2029
- Chart on Control systems - Market size and forecast 2024-2029 ($ million)
- Data Table on Control systems - Market size and forecast 2024-2029 ($ million)
- Chart on Control systems - Year-over-year growth 2024-2029 (%)
- Data Table on Control systems - Year-over-year growth 2024-2029 (%)
- 8.5 Market opportunity by Component
- Market opportunity by Component ($ million)
- Data Table on Market opportunity by Component ($ million)
9 Market Segmentation by Type
- 9.1 Market segments
- Chart on Type - Market share 2024-2029 (%)
- Data Table on Type - Market share 2024-2029 (%)
- 9.2 Comparison by Type
- Chart on Comparison by Type
- Data Table on Comparison by Type
- 9.3 Centrifugal pumps - Market size and forecast 2024-2029
- Chart on Centrifugal pumps - Market size and forecast 2024-2029 ($ million)
- Data Table on Centrifugal pumps - Market size and forecast 2024-2029 ($ million)
- Chart on Centrifugal pumps - Year-over-year growth 2024-2029 (%)
- Data Table on Centrifugal pumps - Year-over-year growth 2024-2029 (%)
- 9.4 Positive displacement pumps - Market size and forecast 2024-2029
- Chart on Positive displacement pumps - Market size and forecast 2024-2029 ($ million)
- Data Table on Positive displacement pumps - Market size and forecast 2024-2029 ($ million)
- Chart on Positive displacement pumps - Year-over-year growth 2024-2029 (%)
- Data Table on Positive displacement pumps - Year-over-year growth 2024-2029 (%)
- 9.5 Market opportunity by Type
- Market opportunity by Type ($ million)
- Data Table on Market opportunity by Type ($ million)
10 Market Segmentation by End-user
- 10.1 Market segments
- Chart on End-user - Market share 2024-2029 (%)
- Data Table on End-user - Market share 2024-2029 (%)
- 10.2 Comparison by End-user
- Chart on Comparison by End-user
- Data Table on Comparison by End-user
- 10.3 Water and wastewater industry - Market size and forecast 2024-2029
- Chart on Water and wastewater industry - Market size and forecast 2024-2029 ($ million)
- Data Table on Water and wastewater industry - Market size and forecast 2024-2029 ($ million)
- Chart on Water and wastewater industry - Year-over-year growth 2024-2029 (%)
- Data Table on Water and wastewater industry - Year-over-year growth 2024-2029 (%)
- 10.4 Oil and gas industry - Market size and forecast 2024-2029
- Chart on Oil and gas industry - Market size and forecast 2024-2029 ($ million)
- Data Table on Oil and gas industry - Market size and forecast 2024-2029 ($ million)
- Chart on Oil and gas industry - Year-over-year growth 2024-2029 (%)
- Data Table on Oil and gas industry - Year-over-year growth 2024-2029 (%)
- 10.5 Chemical and petrochemical industry - Market size and forecast 2024-2029
- Chart on Chemical and petrochemical industry - Market size and forecast 2024-2029 ($ million)
- Data Table on Chemical and petrochemical industry - Market size and forecast 2024-2029 ($ million)
- Chart on Chemical and petrochemical industry - Year-over-year growth 2024-2029 (%)
- Data Table on Chemical and petrochemical industry - Year-over-year growth 2024-2029 (%)
- 10.6 Power industry - Market size and forecast 2024-2029
- Chart on Power industry - Market size and forecast 2024-2029 ($ million)
- Data Table on Power industry - Market size and forecast 2024-2029 ($ million)
- Chart on Power industry - Year-over-year growth 2024-2029 (%)
- Data Table on Power industry - Year-over-year growth 2024-2029 (%)
- 10.7 Others - Market size and forecast 2024-2029
- Chart on Others - Market size and forecast 2024-2029 ($ million)
- Data Table on Others - Market size and forecast 2024-2029 ($ million)
- Chart on Others - Year-over-year growth 2024-2029 (%)
- Data Table on Others - Year-over-year growth 2024-2029 (%)
- 10.8 Market opportunity by End-user
- Market opportunity by End-user ($ million)
- Data Table on Market opportunity by End-user ($ million)
11 Market Segmentation by Application
- 11.1 Market segments
- Chart on Application - Market share 2024-2029 (%)
- Data Table on Application - Market share 2024-2029 (%)
- 11.2 Comparison by Application
- Chart on Comparison by Application
- Data Table on Comparison by Application
- 11.3 Flow control - Market size and forecast 2024-2029
- Chart on Flow control - Market size and forecast 2024-2029 ($ million)
- Data Table on Flow control - Market size and forecast 2024-2029 ($ million)
- Chart on Flow control - Year-over-year growth 2024-2029 (%)
- Data Table on Flow control - Year-over-year growth 2024-2029 (%)
- 11.4 Liquid transfer - Market size and forecast 2024-2029
- Chart on Liquid transfer - Market size and forecast 2024-2029 ($ million)
- Data Table on Liquid transfer - Market size and forecast 2024-2029 ($ million)
- Chart on Liquid transfer - Year-over-year growth 2024-2029 (%)
- Data Table on Liquid transfer - Year-over-year growth 2024-2029 (%)
- 11.5 Pressure Boosting - Market size and forecast 2024-2029
- Chart on Pressure Boosting - Market size and forecast 2024-2029 ($ million)
- Data Table on Pressure Boosting - Market size and forecast 2024-2029 ($ million)
- Chart on Pressure Boosting - Year-over-year growth 2024-2029 (%)
- Data Table on Pressure Boosting - Year-over-year growth 2024-2029 (%)
- 11.6 Others - Market size and forecast 2024-2029
- Chart on Others - Market size and forecast 2024-2029 ($ million)
- Data Table on Others - Market size and forecast 2024-2029 ($ million)
- Chart on Others - Year-over-year growth 2024-2029 (%)
- Data Table on Others - Year-over-year growth 2024-2029 (%)
- 11.7 Market opportunity by Application
- Market opportunity by Application ($ million)
- Data Table on Market opportunity by Application ($ million)
12 Customer Landscape
- 12.1 Customer landscape overview
- Analysis of price sensitivity, lifecycle, customer purchase basket, adoption rates, and purchase criteria
13 Geographic Landscape
- 13.1 Geographic segmentation
- Chart on Market share By Geographical Landscape 2024-2029 (%)
- Data Table on Market share By Geographical Landscape 2024-2029 (%)
- 13.2 Geographic comparison
- Chart on Geographic comparison
- Data Table on Geographic comparison
- 13.3 APAC - Market size and forecast 2024-2029
- Chart on APAC - Market size and forecast 2024-2029 ($ million)
- Data Table on APAC - Market size and forecast 2024-2029 ($ million)
- Chart on APAC - Year-over-year growth 2024-2029 (%)
- Data Table on APAC - Year-over-year growth 2024-2029 (%)
- 13.4 North America - Market size and forecast 2024-2029
- Chart on North America - Market size and forecast 2024-2029 ($ million)
- Data Table on North America - Market size and forecast 2024-2029 ($ million)
- Chart on North America - Year-over-year growth 2024-2029 (%)
- Data Table on North America - Year-over-year growth 2024-2029 (%)
- 13.5 Europe - Market size and forecast 2024-2029
- Chart on Europe - Market size and forecast 2024-2029 ($ million)
- Data Table on Europe - Market size and forecast 2024-2029 ($ million)
- Chart on Europe - Year-over-year growth 2024-2029 (%)
- Data Table on Europe - Year-over-year growth 2024-2029 (%)
- 13.6 Middle East and Africa - Market size and forecast 2024-2029
- Chart on Middle East and Africa - Market size and forecast 2024-2029 ($ million)
- Data Table on Middle East and Africa - Market size and forecast 2024-2029 ($ million)
- Chart on Middle East and Africa - Year-over-year growth 2024-2029 (%)
- Data Table on Middle East and Africa - Year-over-year growth 2024-2029 (%)
- 13.7 South America - Market size and forecast 2024-2029
- Chart on South America - Market size and forecast 2024-2029 ($ million)
- Data Table on South America - Market size and forecast 2024-2029 ($ million)
- Chart on South America - Year-over-year growth 2024-2029 (%)
- Data Table on South America - Year-over-year growth 2024-2029 (%)
- 13.8 US - Market size and forecast 2024-2029
- Chart on US - Market size and forecast 2024-2029 ($ million)
- Data Table on US - Market size and forecast 2024-2029 ($ million)
- Chart on US - Year-over-year growth 2024-2029 (%)
- Data Table on US - Year-over-year growth 2024-2029 (%)
- 13.9 China - Market size and forecast 2024-2029
- Chart on China - Market size and forecast 2024-2029 ($ million)
- Data Table on China - Market size and forecast 2024-2029 ($ million)
- Chart on China - Year-over-year growth 2024-2029 (%)
- Data Table on China - Year-over-year growth 2024-2029 (%)
- 13.10 Japan - Market size and forecast 2024-2029
- Chart on Japan - Market size and forecast 2024-2029 ($ million)
- Data Table on Japan - Market size and forecast 2024-2029 ($ million)
- Chart on Japan - Year-over-year growth 2024-2029 (%)
- Data Table on Japan - Year-over-year growth 2024-2029 (%)
- 13.11 Canada - Market size and forecast 2024-2029
- Chart on Canada - Market size and forecast 2024-2029 ($ million)
- Data Table on Canada - Market size and forecast 2024-2029 ($ million)
- Chart on Canada - Year-over-year growth 2024-2029 (%)
- Data Table on Canada - Year-over-year growth 2024-2029 (%)
- 13.12 India - Market size and forecast 2024-2029
- Chart on India - Market size and forecast 2024-2029 ($ million)
- Data Table on India - Market size and forecast 2024-2029 ($ million)
- Chart on India - Year-over-year growth 2024-2029 (%)
- Data Table on India - Year-over-year growth 2024-2029 (%)
- 13.13 South Korea - Market size and forecast 2024-2029
- Chart on South Korea - Market size and forecast 2024-2029 ($ million)
- Data Table on South Korea - Market size and forecast 2024-2029 ($ million)
- Chart on South Korea - Year-over-year growth 2024-2029 (%)
- Data Table on South Korea - Year-over-year growth 2024-2029 (%)
- 13.14 Germany - Market size and forecast 2024-2029
- Chart on Germany - Market size and forecast 2024-2029 ($ million)
- Data Table on Germany - Market size and forecast 2024-2029 ($ million)
- Chart on Germany - Year-over-year growth 2024-2029 (%)
- Data Table on Germany - Year-over-year growth 2024-2029 (%)
- 13.15 France - Market size and forecast 2024-2029
- Chart on France - Market size and forecast 2024-2029 ($ million)
- Data Table on France - Market size and forecast 2024-2029 ($ million)
- Chart on France - Year-over-year growth 2024-2029 (%)
- Data Table on France - Year-over-year growth 2024-2029 (%)
- 13.16 Italy - Market size and forecast 2024-2029
- Chart on Italy - Market size and forecast 2024-2029 ($ million)
- Data Table on Italy - Market size and forecast 2024-2029 ($ million)
- Chart on Italy - Year-over-year growth 2024-2029 (%)
- Data Table on Italy - Year-over-year growth 2024-2029 (%)
- 13.17 Market opportunity By Geographical Landscape
- Market opportunity By Geographical Landscape ($ million)
- Data Tables on Market opportunity By Geographical Landscape ($ million)
14 Drivers, Challenges, and Opportunity/Restraints
- 14.1 Market drivers
- 14.2 Market challenges
- 14.3 Impact of drivers and challenges
- Impact of drivers and challenges in 2024 and 2029
- 14.4 Market opportunities/restraints
15 Competitive Landscape
- 15.1 Overview
- 15.2 Competitive Landscape
- Overview on criticality of inputs and factors of differentiation
- 15.3 Landscape disruption
- Overview on factors of disruption
- 15.4 Industry risks
- Impact of key risks on business
16 Competitive Analysis
- 16.1 Companies profiled
- Companies covered
- 16.2 Company ranking index
- Company ranking index
- 16.3 Market positioning of companies
- Matrix on companies position and classification
- 16.4 ABB Ltd.
- ABB Ltd. - Overview
- ABB Ltd. - Business segments
- ABB Ltd. - Key news
- ABB Ltd. - Key offerings
- ABB Ltd. - Segment focus
- SWOT
- 16.5 Alfa Laval AB
- Alfa Laval AB - Overview
- Alfa Laval AB - Business segments
- Alfa Laval AB - Key news
- Alfa Laval AB - Key offerings
- Alfa Laval AB - Segment focus
- SWOT
- 16.6 CIRCOR International Inc.
- CIRCOR International Inc. - Overview
- CIRCOR International Inc. - Business segments
- CIRCOR International Inc. - Key offerings
- CIRCOR International Inc. - Segment focus
- SWOT
- 16.7 Flowserve Corp.
- Flowserve Corp. - Overview
- Flowserve Corp. - Business segments
- Flowserve Corp. - Key offerings
- Flowserve Corp. - Segment focus
- SWOT
- 16.8 Grundfos Holding AS
- Grundfos Holding AS - Overview
- Grundfos Holding AS - Product / Service
- Grundfos Holding AS - Key news
- Grundfos Holding AS - Key offerings
- SWOT
- 16.9 ITT PRO Services
- ITT PRO Services - Overview
- ITT PRO Services - Product / Service
- ITT PRO Services - Key offerings
- SWOT
- 16.10 Ketek Group
- Ketek Group - Overview
- Ketek Group - Product / Service
- Ketek Group - Key offerings
- SWOT
- 16.11 Kirloskar Brothers Ltd.
- Kirloskar Brothers Ltd. - Overview
- Kirloskar Brothers Ltd. - Product / Service
- Kirloskar Brothers Ltd. - Key offerings
- SWOT
- 16.12 KSB SE and Co. KGaA
- KSB SE and Co. KGaA - Overview
- KSB SE and Co. KGaA - Business segments
- KSB SE and Co. KGaA - Key offerings
- KSB SE and Co. KGaA - Segment focus
- SWOT
- 16.13 Liberty Pumps
- Liberty Pumps - Overview
- Liberty Pumps - Product / Service
- Liberty Pumps - Key offerings
- SWOT
- 16.14 S.A. Armstrong Ltd.
- S.A. Armstrong Ltd. - Overview
- S.A. Armstrong Ltd. - Product / Service
- S.A. Armstrong Ltd. - Key offerings
- SWOT
- 16.15 Sulzer Management Ltd.
- Sulzer Management Ltd. - Overview
- Sulzer Management Ltd. - Business segments
- Sulzer Management Ltd. - Key news
- Sulzer Management Ltd. - Key offerings
- Sulzer Management Ltd. - Segment focus
- SWOT
- 16.16 Unico LLC
- Unico LLC - Overview
- Unico LLC - Product / Service
- Unico LLC - Key offerings
- SWOT
- 16.17 Xylem Inc.
- Xylem Inc. - Overview
- Xylem Inc. - Business segments
- Xylem Inc. - Key news
- Xylem Inc. - Key offerings
- Xylem Inc. - Segment focus
- SWOT
- 16.18 Yaskawa Electric Corp.
- Yaskawa Electric Corp. - Overview
- Yaskawa Electric Corp. - Product / Service
- Yaskawa Electric Corp. - Key news
- Yaskawa Electric Corp. - Key offerings
- SWOT
17 Appendix
- 17.1 Scope of the report
- 17.2 Inclusions and exclusions checklist
- Inclusions checklist
- Exclusions checklist
- 17.3 Currency conversion rates for US$
- Currency conversion rates for US$
- 17.4 Research methodology
- Research methodology
- 17.5 Data procurement
- Information sources
- 17.6 Data validation
- Data validation
- 17.7 Validation techniques employed for market sizing
- Validation techniques employed for market sizing
- 17.8 Data synthesis
- Data synthesis
- 17.9 360 degree market analysis
- 360 degree market analysis
- 17.10 List of abbreviations
- List of abbreviations

