|
|
市場調査レポート
商品コード
1666763
Eバイク用バッテリーの世界市場 2025~2029年Global E-bike Battery Market 2025-2029 |
||||||
|
|||||||
カスタマイズ可能
|
|||||||


| Eバイク用バッテリーの世界市場 2025~2029年 |
|
出版日: 2025年02月20日
発行: TechNavio
ページ情報: 英文 235 Pages
納期: 即納可能
|

全表示
- 概要
- 目次
Eバイク用バッテリー市場は、2024~2029年にかけて16億2,950万米ドル、予測期間中のCAGRは4.6%で成長すると予測されています。
当レポートでは、Eバイク用バッテリー市場の全体的な分析、市場規模・予測、動向、成長促進要因、課題、約25のベンダーを網羅したベンダー分析などを掲載しています。
現在の市場シナリオ、最新動向と促進要因、市場環境全体に関する最新分析を提供しています。市場は、他のバッテリー技術と比較した場合のリチウムイオンバッテリーの長寿命化、Eバイクの燃費効率、環境に優しい交通手段に対する需要の高まりによって牽引されています。
| 市場範囲 | |
|---|---|
| 基準年 | 2025年 |
| 終了年 | 2029年 |
| 予測期間 | 2025~2029年 |
| 成長モメンタム | 加速 |
| 前年比2025年 | 4.3% |
| CAGR | 4.6% |
| 増分額 | 16億2,950万米ドル |
本調査は、業界の主要参加者からのインプットを含め、一次情報と二次情報を客観的に組み合わせて実施しました。レポートには、主要企業の分析に加え、包括的な市場規模データ、地域分析によるセグメント、ベンダー情勢が含まれています。レポートには過去データと予測データがあります。
本調査では、今後数年間のEバイク用バッテリー市場の成長を促進する主な要因の1つとして、Eバイクデザインの進歩を挙げています。また、Eバイク充電のための再生可能エネルギー使用の増加やコネクテッドEバイクの人気は、市場の大きな需要につながります。
目次
第1章 エグゼクティブサマリー
- 市場概要
第2章 Technavio別分析
- 価格・ライフサイクル・顧客購入バスケット・採用率・購入基準の分析
- インプットの重要性と差別化の要因
- 混乱の要因
- 促進要因と課題の影響
第3章 市場情勢
- 市場エコシステム
- 市場の特徴
- バリューチェーン分析
第4章 市場規模
- 市場の定義
- 市場セグメント分析
- 市場規模 2024年
- 市場展望 2024~2029年
第5章 市場規模実績
- Eバイク用バッテリーの世界市場 2019~2023年
- 流通チャネル別セグメント分析 2019~2023年
- バッテリータイプ別セグメント分析 2019~2023年
- バリエーション別セグメント分析 2019~2023年
- 装備別セグメント分析 2019~2023年
- 地域別セグメント分析 2019~2023年
- 国別セグメント分析 2019~2023年
第6章 定性分析
- AIの影響: Eバイク用バッテリーの世界市場
第7章 ファイブフォース分析
- ファイブフォースの要約
- 買い手の交渉力
- 供給企業の交渉力
- 新規参入業者の脅威
- 代替品の脅威
- 競争の脅威
- 市況
第8章 市場セグメンテーション:流通チャネル別
- 市場セグメント
- 比較:流通チャネル別
- オフライン:市場規模と予測 2024~2029年
- オンライン:市場規模と予測 2024~2029年
- 市場機会:流通チャネル別
第9章 市場セグメンテーション:バッテリータイプ別
- 市場セグメント
- 比較:バッテリータイプ別
- リチウムイオンバッテリー:市場規模と予測 2024~2029年
- 鉛蓄バッテリー:市場規模と予測 2024~2029年
- その他:市場規模と予測 2024~2029年
- 市場機会:バッテリータイプ別
第10章 市場セグメンテーション:バリエーション別
- 市場セグメント
- 比較:バリエーション別
- ミッドモーター:市場規模と予測 2024~2029年
- ハブモーター:市場規模と予測 2024~2029年
- 市場機会:バリエーション別
第11章 市場セグメンテーション:装備別
- 市場セグメント
- 比較:装備別
- ダウンチューブ:市場規模と予測 2024~2029年
- インフレーム:市場規模と予測 2024~2029年
- リアキャリア:市場規模と予測 2024~2029年
- 市場機会:装備別
第12章 顧客情勢
- 顧客情勢の概要
第13章 地域別情勢
- 地域別セグメンテーション
- 地域別比較
- アジア太平洋:市場規模と予測 2024~2029年
- 欧州:市場規模と予測 2024~2029年
- 北米:市場規模と予測 2024~2029年
- 南米:市場規模と予測 2024~2029年
- 中東・アフリカ:市場規模と予測 2024~2029年
- 中国:市場規模と予測 2024~2029年
- インド:市場規模と予測 2024~2029年
- 米国:市場規模と予測 2024~2029年
- 日本:市場規模と予測 2024~2029年
- 韓国:市場規模と予測 2024~2029年
- 英国:市場規模と予測 2024~2029年
- フランス:市場規模と予測 2024~2029年
- カナダ:市場規模と予測 2024~2029年
- ドイツ:市場規模と予測 2024~2029年
- イタリア:市場規模と予測 2024~2029年
- 市場機会:地域情勢別
第14章 促進要因・課題・機会・抑制要因
- 市場促進要因
- 市場の課題
- 促進要因と課題の影響
- 市場の機会・抑制要因
第15章 競合情勢
- 概要
- 競合情勢
- 混乱の状況
- 業界のリスク
第16章 競合分析
- 企業プロファイル
- 企業ランキング指数
- 企業の市場ポジショニング
- BMZ Holding GmbH
- Giant Manufacturing Co. Ltd.
- Hunan CTS Technology Co. Ltd.
- Johnson Matthey Plc
- LG Corp.
- OptimumNano Energy Co. Ltd.
- Panasonic Holdings Corp.
- Phylion Battery Co. Ltd.
- Robert Bosch GmbH
- Samsung Electronics Co. Ltd.
- Shenzhen Handpack Technology Co. Ltd.
- SHIMANO INC.
- VARTA AG
- Yamaha Motor Co. Ltd.
- ZHANGZHOU YOKU ENERGY TECHNOLOGY Co. Ltd.
第17章 付録
The E-bike battery market is forecasted to grow by USD 1629.5 million during 2024-2029, accelerating at a CAGR of 4.6% during the forecast period. The report on the E-bike battery market provides a holistic analysis, market size and forecast, trends, growth drivers, and challenges, as well as vendor analysis covering around 25 vendors.
The report offers an up-to-date analysis regarding the current market scenario, the latest trends and drivers, and the overall market environment. The market is driven by longer shelf life of Li-ion battery when compared with other battery technologies, fuel-efficiency of e-bikes, and increasing demand for eco-friendly transport.
| Market Scope | |
|---|---|
| Base Year | 2025 |
| End Year | 2029 |
| Series Year | 2025-2029 |
| Growth Momentum | Accelerate |
| YOY 2025 | 4.3% |
| CAGR | 4.6% |
| Incremental Value | $1629.5 mn |
The study was conducted using an objective combination of primary and secondary information including inputs from key participants in the industry. The report contains a comprehensive market size data, segment with regional analysis and vendor landscape in addition to an analysis of the key companies. Reports have historic and forecast data.
Technavio's E-bike battery market is segmented as below:
By Distribution Channel
- Offline
- Online
By Battery Type
- Lithium-ion battery
- Lead acid battery
- Others
By Variant
- Mid motor
- Hub motor
By Fitment
- Down tube
- In frame
- Rear carrier
By Geographical Landscape
- APAC
- Europe
- North America
- South America
- Middle East and Africa
This study identifies the advances in E-bike designs as one of the prime reasons driving the E-bike battery market growth during the next few years. Also, increased use of renewable energy for charging e-bikes and popularity of connected e-bikes will lead to sizable demand in the market.
The report on the E-bike battery market covers the following areas:
- E-Bike Battery Market sizing
- E-Bike Battery Market forecast
- E-Bike Battery Market industry analysis
The robust vendor analysis is designed to help clients improve their market position, and in line with this, this report provides a detailed analysis of several leading E-bike battery market vendors that include BMZ Holding GmbH, Coslight India Telecom Pvt. Ltd., Giant Manufacturing Co. Ltd., GRUPO FOTONA, Guangzhou Yuntong Lithium Battery Co. Ltd., Hunan CTS Technology Co. Ltd., Johnson Matthey PLC, Kingbo Power Technology Co. Ltd., LG Corp., Melsen Power Technology Co. Ltd., OptimumNano Energy Co. Ltd., Panasonic Holdings Corp., Phylion Battery Co. Ltd., Robert Bosch GmbH, Samsung Electronics Co. Ltd., Shenzhen Handpack Technology Co. Ltd., SHIMANO INC., VARTA AG, Yamaha Motor Co. Ltd., and ZHANGZHOU YOKU ENERGY TECHNOLOGY Co. Ltd.. Also, the E-bike battery market analysis report includes information on upcoming trends and challenges that will influence market growth. This is to help companies strategize and leverage all forthcoming growth opportunities.
The publisher presents a detailed picture of the market by the way of study, synthesis, and summation of data from multiple sources by an analysis of key parameters such as profit, pricing, competition, and promotions. It presents various market facets by identifying the key industry influencers. The data presented is comprehensive, reliable, and a result of extensive primary and secondary research. The market research reports provide a complete competitive landscape and an in-depth vendor selection methodology and analysis using qualitative and quantitative research to forecast accurate market growth.
Table of Contents
1 Executive Summary
- 1.1 Market overview
- Executive Summary - Chart on Market Overview
- Executive Summary - Data Table on Market Overview
- Executive Summary - Chart on Global Market Characteristics
- Executive Summary - Chart on Market By Geographical Landscape
- Executive Summary - Chart on Market Segmentation by Distribution Channel
- Executive Summary - Chart on Market Segmentation by Battery Type
- Executive Summary - Chart on Market Segmentation by Variant
- Executive Summary - Chart on Market Segmentation by Fitment
- Executive Summary - Chart on Incremental Growth
- Executive Summary - Data Table on Incremental Growth
- Executive Summary - Chart on Company Market Positioning
2 Technavio Analysis
- 2.1 Analysis of price sensitivity, lifecycle, customer purchase basket, adoption rates, and purchase criteria
- Analysis of price sensitivity, lifecycle, customer purchase basket, adoption rates, and purchase criteria
- 2.2 Criticality of inputs and Factors of differentiation
- Overview on criticality of inputs and factors of differentiation
- 2.3 Factors of disruption
- Overview on factors of disruption
- 2.4 Impact of drivers and challenges
- Impact of drivers and challenges in 2024 and 2029
3 Market Landscape
- 3.1 Market ecosystem
- Parent Market
- Data Table on - Parent Market
- 3.2 Market characteristics
- Market characteristics analysis
- 3.3 Value chain analysis
- Value chain analysis
4 Market Sizing
- 4.1 Market definition
- Offerings of companies included in the market definition
- 4.2 Market segment analysis
- Market segments
- 4.3 Market size 2024
- 4.4 Market outlook: Forecast for 2024-2029
- Chart on Global - Market size and forecast 2024-2029 ($ million)
- Data Table on Global - Market size and forecast 2024-2029 ($ million)
- Chart on Global Market: Year-over-year growth 2024-2029 (%)
- Data Table on Global Market: Year-over-year growth 2024-2029 (%)
5 Historic Market Size
- 5.1 Global E-Bike Battery Market 2019 - 2023
- Historic Market Size - Data Table on Global E-Bike Battery Market 2019 - 2023 ($ million)
- 5.2 Distribution Channel segment analysis 2019 - 2023
- Historic Market Size - Distribution Channel Segment 2019 - 2023 ($ million)
- 5.3 Battery Type segment analysis 2019 - 2023
- Historic Market Size - Battery Type Segment 2019 - 2023 ($ million)
- 5.4 Variant segment analysis 2019 - 2023
- Historic Market Size - Variant Segment 2019 - 2023 ($ million)
- 5.5 Fitment segment analysis 2019 - 2023
- Historic Market Size - Fitment Segment 2019 - 2023 ($ million)
- 5.6 Geography segment analysis 2019 - 2023
- Historic Market Size - Geography Segment 2019 - 2023 ($ million)
- 5.7 Country segment analysis 2019 - 2023
- Historic Market Size - Country Segment 2019 - 2023 ($ million)
6 Qualitative Analysis
- 6.1 The AI impact on Global E-bike Battery Market
7 Five Forces Analysis
- 7.1 Five forces summary
- Five forces analysis - Comparison between 2024 and 2029
- 7.2 Bargaining power of buyers
- Bargaining power of buyers - Impact of key factors 2024 and 2029
- 7.3 Bargaining power of suppliers
- Bargaining power of suppliers - Impact of key factors in 2024 and 2029
- 7.4 Threat of new entrants
- Threat of new entrants - Impact of key factors in 2024 and 2029
- 7.5 Threat of substitutes
- Threat of substitutes - Impact of key factors in 2024 and 2029
- 7.6 Threat of rivalry
- Threat of rivalry - Impact of key factors in 2024 and 2029
- 7.7 Market condition
- Chart on Market condition - Five forces 2024 and 2029
8 Market Segmentation by Distribution Channel
- 8.1 Market segments
- Chart on Distribution Channel - Market share 2024-2029 (%)
- Data Table on Distribution Channel - Market share 2024-2029 (%)
- 8.2 Comparison by Distribution Channel
- Chart on Comparison by Distribution Channel
- Data Table on Comparison by Distribution Channel
- 8.3 Offline - Market size and forecast 2024-2029
- Chart on Offline - Market size and forecast 2024-2029 ($ million)
- Data Table on Offline - Market size and forecast 2024-2029 ($ million)
- Chart on Offline - Year-over-year growth 2024-2029 (%)
- Data Table on Offline - Year-over-year growth 2024-2029 (%)
- 8.4 Online - Market size and forecast 2024-2029
- Chart on Online - Market size and forecast 2024-2029 ($ million)
- Data Table on Online - Market size and forecast 2024-2029 ($ million)
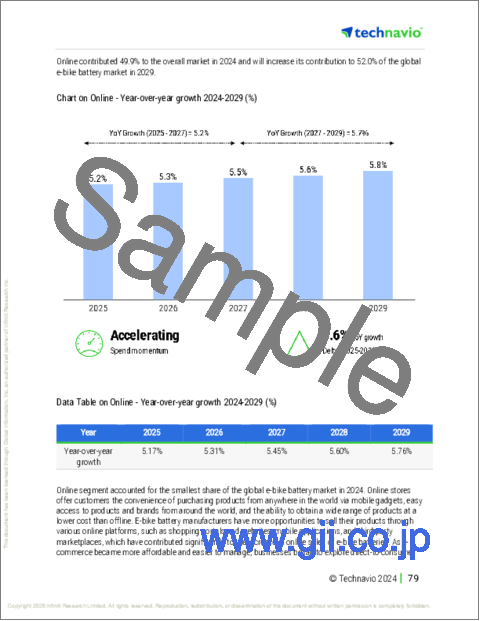
- Chart on Online - Year-over-year growth 2024-2029 (%)
- Data Table on Online - Year-over-year growth 2024-2029 (%)
- 8.5 Market opportunity by Distribution Channel
- Market opportunity by Distribution Channel ($ million)
- Data Table on Market opportunity by Distribution Channel ($ million)
9 Market Segmentation by Battery Type
- 9.1 Market segments
- Chart on Battery Type - Market share 2024-2029 (%)
- Data Table on Battery Type - Market share 2024-2029 (%)
- 9.2 Comparison by Battery Type
- Chart on Comparison by Battery Type
- Data Table on Comparison by Battery Type
- 9.3 Lithium-ion battery - Market size and forecast 2024-2029
- Chart on Lithium-ion battery - Market size and forecast 2024-2029 ($ million)
- Data Table on Lithium-ion battery - Market size and forecast 2024-2029 ($ million)
- Chart on Lithium-ion battery - Year-over-year growth 2024-2029 (%)
- Data Table on Lithium-ion battery - Year-over-year growth 2024-2029 (%)
- 9.4 Lead acid battery - Market size and forecast 2024-2029
- Chart on Lead acid battery - Market size and forecast 2024-2029 ($ million)
- Data Table on Lead acid battery - Market size and forecast 2024-2029 ($ million)
- Chart on Lead acid battery - Year-over-year growth 2024-2029 (%)
- Data Table on Lead acid battery - Year-over-year growth 2024-2029 (%)
- 9.5 Others - Market size and forecast 2024-2029
- Chart on Others - Market size and forecast 2024-2029 ($ million)
- Data Table on Others - Market size and forecast 2024-2029 ($ million)
- Chart on Others - Year-over-year growth 2024-2029 (%)
- Data Table on Others - Year-over-year growth 2024-2029 (%)
- 9.6 Market opportunity by Battery Type
- Market opportunity by Battery Type ($ million)
- Data Table on Market opportunity by Battery Type ($ million)
10 Market Segmentation by Variant
- 10.1 Market segments
- Chart on Variant - Market share 2024-2029 (%)
- Data Table on Variant - Market share 2024-2029 (%)
- 10.2 Comparison by Variant
- Chart on Comparison by Variant
- Data Table on Comparison by Variant
- 10.3 Mid motor - Market size and forecast 2024-2029
- Chart on Mid motor - Market size and forecast 2024-2029 ($ million)
- Data Table on Mid motor - Market size and forecast 2024-2029 ($ million)
- Chart on Mid motor - Year-over-year growth 2024-2029 (%)
- Data Table on Mid motor - Year-over-year growth 2024-2029 (%)
- 10.4 Hub motor - Market size and forecast 2024-2029
- Chart on Hub motor - Market size and forecast 2024-2029 ($ million)
- Data Table on Hub motor - Market size and forecast 2024-2029 ($ million)
- Chart on Hub motor - Year-over-year growth 2024-2029 (%)
- Data Table on Hub motor - Year-over-year growth 2024-2029 (%)
- 10.5 Market opportunity by Variant
- Market opportunity by Variant ($ million)
- Data Table on Market opportunity by Variant ($ million)
11 Market Segmentation by Fitment
- 11.1 Market segments
- Chart on Fitment - Market share 2024-2029 (%)
- Data Table on Fitment - Market share 2024-2029 (%)
- 11.2 Comparison by Fitment
- Chart on Comparison by Fitment
- Data Table on Comparison by Fitment
- 11.3 Down tube - Market size and forecast 2024-2029
- Chart on Down tube - Market size and forecast 2024-2029 ($ million)
- Data Table on Down tube - Market size and forecast 2024-2029 ($ million)
- Chart on Down tube - Year-over-year growth 2024-2029 (%)
- Data Table on Down tube - Year-over-year growth 2024-2029 (%)
- 11.4 In frame - Market size and forecast 2024-2029
- Chart on In frame - Market size and forecast 2024-2029 ($ million)
- Data Table on In frame - Market size and forecast 2024-2029 ($ million)
- Chart on In frame - Year-over-year growth 2024-2029 (%)
- Data Table on In frame - Year-over-year growth 2024-2029 (%)
- 11.5 Rear carrier - Market size and forecast 2024-2029
- Chart on Rear carrier - Market size and forecast 2024-2029 ($ million)
- Data Table on Rear carrier - Market size and forecast 2024-2029 ($ million)
- Chart on Rear carrier - Year-over-year growth 2024-2029 (%)
- Data Table on Rear carrier - Year-over-year growth 2024-2029 (%)
- 11.6 Market opportunity by Fitment
- Market opportunity by Fitment ($ million)
- Data Table on Market opportunity by Fitment ($ million)
12 Customer Landscape
- 12.1 Customer landscape overview
- Analysis of price sensitivity, lifecycle, customer purchase basket, adoption rates, and purchase criteria
13 Geographic Landscape
- 13.1 Geographic segmentation
- Chart on Market share By Geographical Landscape 2024-2029 (%)
- Data Table on Market share By Geographical Landscape 2024-2029 (%)
- 13.2 Geographic comparison
- Chart on Geographic comparison
- Data Table on Geographic comparison
- 13.3 APAC - Market size and forecast 2024-2029
- Chart on APAC - Market size and forecast 2024-2029 ($ million)
- Data Table on APAC - Market size and forecast 2024-2029 ($ million)
- Chart on APAC - Year-over-year growth 2024-2029 (%)
- Data Table on APAC - Year-over-year growth 2024-2029 (%)
- 13.4 Europe - Market size and forecast 2024-2029
- Chart on Europe - Market size and forecast 2024-2029 ($ million)
- Data Table on Europe - Market size and forecast 2024-2029 ($ million)
- Chart on Europe - Year-over-year growth 2024-2029 (%)
- Data Table on Europe - Year-over-year growth 2024-2029 (%)
- 13.5 North America - Market size and forecast 2024-2029
- Chart on North America - Market size and forecast 2024-2029 ($ million)
- Data Table on North America - Market size and forecast 2024-2029 ($ million)
- Chart on North America - Year-over-year growth 2024-2029 (%)
- Data Table on North America - Year-over-year growth 2024-2029 (%)
- 13.6 South America - Market size and forecast 2024-2029
- Chart on South America - Market size and forecast 2024-2029 ($ million)
- Data Table on South America - Market size and forecast 2024-2029 ($ million)
- Chart on South America - Year-over-year growth 2024-2029 (%)
- Data Table on South America - Year-over-year growth 2024-2029 (%)
- 13.7 Middle East and Africa - Market size and forecast 2024-2029
- Chart on Middle East and Africa - Market size and forecast 2024-2029 ($ million)
- Data Table on Middle East and Africa - Market size and forecast 2024-2029 ($ million)
- Chart on Middle East and Africa - Year-over-year growth 2024-2029 (%)
- Data Table on Middle East and Africa - Year-over-year growth 2024-2029 (%)
- 13.8 China - Market size and forecast 2024-2029
- Chart on China - Market size and forecast 2024-2029 ($ million)
- Data Table on China - Market size and forecast 2024-2029 ($ million)
- Chart on China - Year-over-year growth 2024-2029 (%)
- Data Table on China - Year-over-year growth 2024-2029 (%)
- 13.9 India - Market size and forecast 2024-2029
- Chart on India - Market size and forecast 2024-2029 ($ million)
- Data Table on India - Market size and forecast 2024-2029 ($ million)
- Chart on India - Year-over-year growth 2024-2029 (%)
- Data Table on India - Year-over-year growth 2024-2029 (%)
- 13.10 US - Market size and forecast 2024-2029
- Chart on US - Market size and forecast 2024-2029 ($ million)
- Data Table on US - Market size and forecast 2024-2029 ($ million)
- Chart on US - Year-over-year growth 2024-2029 (%)
- Data Table on US - Year-over-year growth 2024-2029 (%)
- 13.11 Japan - Market size and forecast 2024-2029
- Chart on Japan - Market size and forecast 2024-2029 ($ million)
- Data Table on Japan - Market size and forecast 2024-2029 ($ million)
- Chart on Japan - Year-over-year growth 2024-2029 (%)
- Data Table on Japan - Year-over-year growth 2024-2029 (%)
- 13.12 South Korea - Market size and forecast 2024-2029
- Chart on South Korea - Market size and forecast 2024-2029 ($ million)
- Data Table on South Korea - Market size and forecast 2024-2029 ($ million)
- Chart on South Korea - Year-over-year growth 2024-2029 (%)
- Data Table on South Korea - Year-over-year growth 2024-2029 (%)
- 13.13 UK - Market size and forecast 2024-2029
- Chart on UK - Market size and forecast 2024-2029 ($ million)
- Data Table on UK - Market size and forecast 2024-2029 ($ million)
- Chart on UK - Year-over-year growth 2024-2029 (%)
- Data Table on UK - Year-over-year growth 2024-2029 (%)
- 13.14 France - Market size and forecast 2024-2029
- Chart on France - Market size and forecast 2024-2029 ($ million)
- Data Table on France - Market size and forecast 2024-2029 ($ million)
- Chart on France - Year-over-year growth 2024-2029 (%)
- Data Table on France - Year-over-year growth 2024-2029 (%)
- 13.15 Canada - Market size and forecast 2024-2029
- Chart on Canada - Market size and forecast 2024-2029 ($ million)
- Data Table on Canada - Market size and forecast 2024-2029 ($ million)
- Chart on Canada - Year-over-year growth 2024-2029 (%)
- Data Table on Canada - Year-over-year growth 2024-2029 (%)
- 13.16 Germany - Market size and forecast 2024-2029
- Chart on Germany - Market size and forecast 2024-2029 ($ million)
- Data Table on Germany - Market size and forecast 2024-2029 ($ million)
- Chart on Germany - Year-over-year growth 2024-2029 (%)
- Data Table on Germany - Year-over-year growth 2024-2029 (%)
- 13.17 Italy - Market size and forecast 2024-2029
- Chart on Italy - Market size and forecast 2024-2029 ($ million)
- Data Table on Italy - Market size and forecast 2024-2029 ($ million)
- Chart on Italy - Year-over-year growth 2024-2029 (%)
- Data Table on Italy - Year-over-year growth 2024-2029 (%)
- 13.18 Market opportunity By Geographical Landscape
- Market opportunity By Geographical Landscape ($ million)
- Data Tables on Market opportunity By Geographical Landscape ($ million)
14 Drivers, Challenges, and Opportunity/Restraints
- 14.1 Market drivers
- 14.2 Market challenges
- 14.3 Impact of drivers and challenges
- Impact of drivers and challenges in 2024 and 2029
- 14.4 Market opportunities/restraints
15 Competitive Landscape
- 15.1 Overview
- 15.2 Competitive Landscape
- Overview on criticality of inputs and factors of differentiation
- 15.3 Landscape disruption
- Overview on factors of disruption
- 15.4 Industry risks
- Impact of key risks on business
16 Competitive Analysis
- 16.1 Companies profiled
- Companies covered
- 16.2 Company ranking index
- Company ranking index
- 16.3 Market positioning of companies
- Matrix on companies position and classification
- 16.4 BMZ Holding GmbH
- BMZ Holding GmbH - Overview
- BMZ Holding GmbH - Product / Service
- BMZ Holding GmbH - Key offerings
- SWOT
- 16.5 Giant Manufacturing Co. Ltd.
- Giant Manufacturing Co. Ltd. - Overview
- Giant Manufacturing Co. Ltd. - Business segments
- Giant Manufacturing Co. Ltd. - Key offerings
- Giant Manufacturing Co. Ltd. - Segment focus
- SWOT
- 16.6 Hunan CTS Technology Co. Ltd.
- Hunan CTS Technology Co. Ltd. - Overview
- Hunan CTS Technology Co. Ltd. - Product / Service
- Hunan CTS Technology Co. Ltd. - Key offerings
- SWOT
- 16.7 Johnson Matthey Plc
- Johnson Matthey Plc - Overview
- Johnson Matthey Plc - Business segments
- Johnson Matthey Plc - Key offerings
- Johnson Matthey Plc - Segment focus
- SWOT
- 16.8 LG Corp.
- LG Corp. - Overview
- LG Corp. - Business segments
- LG Corp. - Key news
- LG Corp. - Key offerings
- LG Corp. - Segment focus
- SWOT
- 16.9 OptimumNano Energy Co. Ltd.
- OptimumNano Energy Co. Ltd. - Overview
- OptimumNano Energy Co. Ltd. - Product / Service
- OptimumNano Energy Co. Ltd. - Key offerings
- SWOT
- 16.10 Panasonic Holdings Corp.
- Panasonic Holdings Corp. - Overview
- Panasonic Holdings Corp. - Business segments
- Panasonic Holdings Corp. - Key news
- Panasonic Holdings Corp. - Key offerings
- Panasonic Holdings Corp. - Segment focus
- SWOT
- 16.11 Phylion Battery Co. Ltd.
- Phylion Battery Co. Ltd. - Overview
- Phylion Battery Co. Ltd. - Product / Service
- Phylion Battery Co. Ltd. - Key offerings
- SWOT
- 16.12 Robert Bosch GmbH
- Robert Bosch GmbH - Overview
- Robert Bosch GmbH - Product / Service
- Robert Bosch GmbH - Key news
- Robert Bosch GmbH - Key offerings
- SWOT
- 16.13 Samsung Electronics Co. Ltd.
- Samsung Electronics Co. Ltd. - Overview
- Samsung Electronics Co. Ltd. - Business segments
- Samsung Electronics Co. Ltd. - Key news
- Samsung Electronics Co. Ltd. - Key offerings
- Samsung Electronics Co. Ltd. - Segment focus
- SWOT
- 16.14 Shenzhen Handpack Technology Co. Ltd.
- Shenzhen Handpack Technology Co. Ltd. - Overview
- Shenzhen Handpack Technology Co. Ltd. - Product / Service
- Shenzhen Handpack Technology Co. Ltd. - Key offerings
- SWOT
- 16.15 SHIMANO INC.
- SHIMANO INC. - Overview
- SHIMANO INC. - Business segments
- SHIMANO INC. - Key offerings
- SHIMANO INC. - Segment focus
- SWOT
- 16.16 VARTA AG
- VARTA AG - Overview
- VARTA AG - Business segments
- VARTA AG - Key offerings
- VARTA AG - Segment focus
- SWOT
- 16.17 Yamaha Motor Co. Ltd.
- Yamaha Motor Co. Ltd. - Overview
- Yamaha Motor Co. Ltd. - Business segments
- Yamaha Motor Co. Ltd. - Key offerings
- Yamaha Motor Co. Ltd. - Segment focus
- SWOT
- 16.18 ZHANGZHOU YOKU ENERGY TECHNOLOGY Co. Ltd.
- ZHANGZHOU YOKU ENERGY TECHNOLOGY Co. Ltd. - Overview
- ZHANGZHOU YOKU ENERGY TECHNOLOGY Co. Ltd. - Product / Service
- ZHANGZHOU YOKU ENERGY TECHNOLOGY Co. Ltd. - Key offerings
- SWOT
17 Appendix
- 17.1 Scope of the report
- 17.2 Inclusions and exclusions checklist
- Inclusions checklist
- Exclusions checklist
- 17.3 Currency conversion rates for US$
- Currency conversion rates for US$
- 17.4 Research methodology
- Research methodology
- 17.5 Data procurement
- Information sources
- 17.6 Data validation
- Data validation
- 17.7 Validation techniques employed for market sizing
- Validation techniques employed for market sizing
- 17.8 Data synthesis
- Data synthesis
- 17.9 360 degree market analysis
- 360 degree market analysis
- 17.10 List of abbreviations
- List of abbreviations
