|
|
市場調査レポート
商品コード
1626696
電気自動車充電インフラの世界市場 2025年~2029年Global Electric Vehicle Charging Infrastructure Market 2025-2029 |
||||||
|
|||||||
カスタマイズ可能
|
|||||||


| 電気自動車充電インフラの世界市場 2025年~2029年 |
|
出版日: 2024年12月25日
発行: TechNavio
ページ情報: 英文 201 Pages
納期: 即納可能
|

全表示
- 概要
- 図表
- 目次
電気自動車充電インフラ市場 2025年~2029年
電気自動車充電インフラ市場は2024年~2029年に1,966億5,400万米ドル、予測期間中のCAGRは44.8%で成長すると予測されます。当レポートでは、電気自動車充電インフラ市場の全体的な分析、市場規模・予測、動向、成長促進要因、課題、約25のベンダーを網羅したベンダー分析などを掲載しています。
現在の市場シナリオ、最新動向と促進要因、市場環境全体に関する最新分析を提供しています。市場は、EV充電ステーションの設置を支援する政府のイニシアチブの増加、税制優遇措置によるEV販売の増加、整備されたEV充電インフラへの需要の押し上げ、EVの生産台数の増加が牽引しています。
| 市場範囲 | |
|---|---|
| 基準年 | 2025年 |
| 終了年 | 2029年 |
| 予測期間 | 2025年~2029年 |
| 成長モメンタム | 加速 |
| 前年比2025年 | 32.2% |
| CAGR | 44.8% |
| 増分額 | 1,966億5,400万米ドル |
本調査では、再生可能エネルギーによるEV充電ステーションへの電力供給が、今後数年間の電気自動車充電インフラ市場成長を牽引する主要な理由の1つであると特定しています。また、EVのワイヤレス充電の出現とV2G(Vehicle to Grid)エネルギー伝送の普及は、市場の大きな需要につながります。
目次
第1章 エグゼクティブサマリー
- 市場概要
第2章 Technavioによる分析
- 価格・ライフサイクル・顧客購入バスケット・採用率・購入基準の分析
- インプットの重要性と差別化の要因
- 混乱の要因
- 促進要因と課題の影響
第3章 市場情勢
- 市場エコシステム
- 市場の特徴
- バリューチェーン分析
第4章 市場規模
- 市場の定義
- 市場セグメント分析
- 市場規模、2024年
- 市場の見通し、2024年~2029年
第5章 市場規模実績
- 電気自動車充電インフラの世界市場、2019年~2023年
- 方法セグメント分析、2019年~2023年
- タイプセグメント分析、2019年~2023年
- 地域別セグメント分析、2019年~2023年
- 国別セグメント分析、2019年~2023年
第6章 定性分析
- AIの影響:電気自動車充電インフラの世界市場
第7章 ファイブフォース分析
- ファイブフォースの要約
- 買い手の交渉力
- 供給企業の交渉力
- 新規参入業者の脅威
- 代替品の脅威
- 競争の脅威
- 市況
第8章 市場セグメンテーション:方法別
- 市場セグメント
- 比較:方法別
- 急速充電器:市場規模と予測、2024年~2029年
- 低速充電器:市場規模と予測、2024年~2029年
- 市場機会:方法別
第9章 市場セグメンテーション:タイプ別
- 市場セグメント
- 比較:タイプ別
- 交流:市場規模と予測、2024年~2029年
- 直流:市場規模と予測、2024年~2029年
- 市場機会:タイプ別
第10章 顧客情勢
- 顧客情勢の概要
第11章 地域別情勢
- 地域別セグメンテーション
- 地域別比較
- アジア太平洋:市場規模と予測、2024年~2029年
- 北米:市場規模と予測、2024年~2029年
- 欧州:市場規模と予測、2024年~2029年
- 南米:市場規模と予測、2024年~2029年
- 中東・アフリカ:市場規模と予測、2024年~2029年
- 中国:市場規模と予測、2024年~2029年
- 米国:市場規模と予測、2024年~2029年
- 日本:市場規模と予測、2024年~2029年
- インド:市場規模と予測、2024年~2029年
- カナダ:市場規模と予測、2024年~2029年
- 英国:市場規模と予測、2024年~2029年
- ドイツ:市場規模と予測、2024年~2029年
- フランス:市場規模と予測、2024年~2029年
- ブラジル:市場規模と予測、2024年~2029年
- スペイン:市場規模と予測、2024年~2029年
- 市場機会:地域情勢別
第12章 促進要因・課題・機会・抑制要因
- 市場促進要因
- 市場の課題
- 促進要因と課題の影響
- 市場の機会・抑制要因
第13章 競合情勢
- 概要
- 競合情勢
- 混乱の状況
- 業界のリスク
第14章 競合分析
- 企業プロファイル
- 企業ランキング指数
- 企業の市場ポジショニング
- ABB Ltd.
- Alfen NV
- BYD Co. Ltd.
- 概要
- 事業内容
- 主要ニュース
- 主な提供製品
- セグメントの焦点
- SWOT
- Eaton Corp plc
- 概要
- 事業内容
- 主要ニュース
- 主な提供製品
- セグメントの焦点
- SWOT
- General Electric Co.
- 概要
- 事業内容
- 主要ニュース
- 主な提供製品
- セグメントの焦点
- SWOT
- Infineon Technologies AG
- 概要
- 事業内容
- 主要ニュース
- 主な提供製品
- セグメントの焦点
- SWOT
- LS Power Development LLC
- 概要
- 製品/サービス
- 主なサービス
- SWOT
- Phihong USA Corp.
- 概要
- 製品/サービス
- 主なサービス
- SWOT
- Schneider Electric SE
- 概要
- 事業内容
- 主要ニュース
- 主な提供製品
- セグメントの焦点
- SWOT
- Shell plc
- 概要
- 事業内容
- 主要ニュース
- 主な提供製品
- セグメントの焦点
- SWOT
- Siemens AG
- 概要
- 事業内容
- 主要ニュース
- 主な提供製品
- セグメントの焦点
- SWOT
- Tesla Inc.
- 概要
- 事業内容
- 主要ニュース
- 主な提供製品
- セグメントの焦点
- SWOT
- The Mobility House GmbH
- 概要
- 製品/サービス
- 主なサービス
- SWOT
- TotalEnergies SE
- 概要
- 事業セグメント
- 主要ニュース
- T主なサービス
- セグメントの焦点
- SWOT
- Webasto SE
- 概要
- 製品/サービス
- 主要ニュース
- 主な提供製品
- SWOT
第15章 付録
Exhibits:
- Exhibits1: Executive Summary - Chart on Market Overview
- Exhibits2: Executive Summary - Data Table on Market Overview
- Exhibits3: Executive Summary - Chart on Global Market Characteristics
- Exhibits4: Executive Summary - Chart on Market By Geographical Landscape
- Exhibits5: Executive Summary - Chart on Market Segmentation by Method
- Exhibits6: Executive Summary - Chart on Market Segmentation by Type
- Exhibits7: Executive Summary - Chart on Incremental Growth
- Exhibits8: Executive Summary - Data Table on Incremental Growth
- Exhibits9: Executive Summary - Chart on Company Market Positioning
- Exhibits10: Analysis of price sensitivity, lifecycle, customer purchase basket, adoption rates, and purchase criteria
- Exhibits11: Overview on criticality of inputs and factors of differentiation
- Exhibits12: Overview on factors of disruption
- Exhibits13: Impact of drivers and challenges in 2024 and 2029
- Exhibits14: Parent Market
- Exhibits15: Data Table on - Parent Market
- Exhibits16: Market characteristics analysis
- Exhibits17: Value chain analysis
- Exhibits18: Offerings of companies included in the market definition
- Exhibits19: Market segments
- Exhibits20: Chart on Global - Market size and forecast 2024-2029 ($ million)
- Exhibits21: Data Table on Global - Market size and forecast 2024-2029 ($ million)
- Exhibits22: Chart on Global Market: Year-over-year growth 2024-2029 (%)
- Exhibits23: Data Table on Global Market: Year-over-year growth 2024-2029 (%)
- Exhibits24: Historic Market Size - Data Table on Global Electric Vehicle Charging Infrastructure Market 2019 - 2023 ($ million)
- Exhibits25: Historic Market Size - Method Segment 2019 - 2023 ($ million)
- Exhibits26: Historic Market Size - Type Segment 2019 - 2023 ($ million)
- Exhibits27: Historic Market Size - Geography Segment 2019 - 2023 ($ million)
- Exhibits28: Historic Market Size - Country Segment 2019 - 2023 ($ million)
- Exhibits29: Five forces analysis - Comparison between 2024 and 2029
- Exhibits30: Bargaining power of buyers - Impact of key factors 2024 and 2029
- Exhibits31: Bargaining power of suppliers - Impact of key factors in 2024 and 2029
- Exhibits32: Threat of new entrants - Impact of key factors in 2024 and 2029
- Exhibits33: Threat of substitutes - Impact of key factors in 2024 and 2029
- Exhibits34: Threat of rivalry - Impact of key factors in 2024 and 2029
- Exhibits35: Chart on Market condition - Five forces 2024 and 2029
- Exhibits36: Chart on Method - Market share 2024-2029 (%)
- Exhibits37: Data Table on Method - Market share 2024-2029 (%)
- Exhibits38: Chart on Comparison by Method
- Exhibits39: Data Table on Comparison by Method
- Exhibits40: Chart on Fast charger - Market size and forecast 2024-2029 ($ million)
- Exhibits41: Data Table on Fast charger - Market size and forecast 2024-2029 ($ million)
- Exhibits42: Chart on Fast charger - Year-over-year growth 2024-2029 (%)
- Exhibits43: Data Table on Fast charger - Year-over-year growth 2024-2029 (%)
- Exhibits44: Chart on Slow charger - Market size and forecast 2024-2029 ($ million)
- Exhibits45: Data Table on Slow charger - Market size and forecast 2024-2029 ($ million)
- Exhibits46: Chart on Slow charger - Year-over-year growth 2024-2029 (%)
- Exhibits47: Data Table on Slow charger - Year-over-year growth 2024-2029 (%)
- Exhibits48: Market opportunity by Method ($ million)
- Exhibits49: Data Table on Market opportunity by Method ($ million)
- Exhibits50: Chart on Type - Market share 2024-2029 (%)
- Exhibits51: Data Table on Type - Market share 2024-2029 (%)
- Exhibits52: Chart on Comparison by Type
- Exhibits53: Data Table on Comparison by Type
- Exhibits54: Chart on AC - Market size and forecast 2024-2029 ($ million)
- Exhibits55: Data Table on AC - Market size and forecast 2024-2029 ($ million)
- Exhibits56: Chart on AC - Year-over-year growth 2024-2029 (%)
- Exhibits57: Data Table on AC - Year-over-year growth 2024-2029 (%)
- Exhibits58: Chart on DC - Market size and forecast 2024-2029 ($ million)
- Exhibits59: Data Table on DC - Market size and forecast 2024-2029 ($ million)
- Exhibits60: Chart on DC - Year-over-year growth 2024-2029 (%)
- Exhibits61: Data Table on DC - Year-over-year growth 2024-2029 (%)
- Exhibits62: Market opportunity by Type ($ million)
- Exhibits63: Data Table on Market opportunity by Type ($ million)
- Exhibits64: Analysis of price sensitivity, lifecycle, customer purchase basket, adoption rates, and purchase criteria
- Exhibits65: Chart on Market share By Geographical Landscape 2024-2029 (%)
- Exhibits66: Data Table on Market share By Geographical Landscape 2024-2029 (%)
- Exhibits67: Chart on Geographic comparison
- Exhibits68: Data Table on Geographic comparison
- Exhibits69: Chart on APAC - Market size and forecast 2024-2029 ($ million)
- Exhibits70: Data Table on APAC - Market size and forecast 2024-2029 ($ million)
- Exhibits71: Chart on APAC - Year-over-year growth 2024-2029 (%)
- Exhibits72: Data Table on APAC - Year-over-year growth 2024-2029 (%)
- Exhibits73: Chart on North America - Market size and forecast 2024-2029 ($ million)
- Exhibits74: Data Table on North America - Market size and forecast 2024-2029 ($ million)
- Exhibits75: Chart on North America - Year-over-year growth 2024-2029 (%)
- Exhibits76: Data Table on North America - Year-over-year growth 2024-2029 (%)
- Exhibits77: Chart on Europe - Market size and forecast 2024-2029 ($ million)
- Exhibits78: Data Table on Europe - Market size and forecast 2024-2029 ($ million)
- Exhibits79: Chart on Europe - Year-over-year growth 2024-2029 (%)
- Exhibits80: Data Table on Europe - Year-over-year growth 2024-2029 (%)
- Exhibits81: Chart on South America - Market size and forecast 2024-2029 ($ million)
- Exhibits82: Data Table on South America - Market size and forecast 2024-2029 ($ million)
- Exhibits83: Chart on South America - Year-over-year growth 2024-2029 (%)
- Exhibits84: Data Table on South America - Year-over-year growth 2024-2029 (%)
- Exhibits85: Chart on Middle East and Africa - Market size and forecast 2024-2029 ($ million)
- Exhibits86: Data Table on Middle East and Africa - Market size and forecast 2024-2029 ($ million)
- Exhibits87: Chart on Middle East and Africa - Year-over-year growth 2024-2029 (%)
- Exhibits88: Data Table on Middle East and Africa - Year-over-year growth 2024-2029 (%)
- Exhibits89: Chart on China - Market size and forecast 2024-2029 ($ million)
- Exhibits90: Data Table on China - Market size and forecast 2024-2029 ($ million)
- Exhibits91: Chart on China - Year-over-year growth 2024-2029 (%)
- Exhibits92: Data Table on China - Year-over-year growth 2024-2029 (%)
- Exhibits93: Chart on US - Market size and forecast 2024-2029 ($ million)
- Exhibits94: Data Table on US - Market size and forecast 2024-2029 ($ million)
- Exhibits95: Chart on US - Year-over-year growth 2024-2029 (%)
- Exhibits96: Data Table on US - Year-over-year growth 2024-2029 (%)
- Exhibits97: Chart on Japan - Market size and forecast 2024-2029 ($ million)
- Exhibits98: Data Table on Japan - Market size and forecast 2024-2029 ($ million)
- Exhibits99: Chart on Japan - Year-over-year growth 2024-2029 (%)
- Exhibits100: Data Table on Japan - Year-over-year growth 2024-2029 (%)
- Exhibits101: Chart on India - Market size and forecast 2024-2029 ($ million)
- Exhibits102: Data Table on India - Market size and forecast 2024-2029 ($ million)
- Exhibits103: Chart on India - Year-over-year growth 2024-2029 (%)
- Exhibits104: Data Table on India - Year-over-year growth 2024-2029 (%)
- Exhibits105: Chart on Canada - Market size and forecast 2024-2029 ($ million)
- Exhibits106: Data Table on Canada - Market size and forecast 2024-2029 ($ million)
- Exhibits107: Chart on Canada - Year-over-year growth 2024-2029 (%)
- Exhibits108: Data Table on Canada - Year-over-year growth 2024-2029 (%)
- Exhibits109: Chart on UK - Market size and forecast 2024-2029 ($ million)
- Exhibits110: Data Table on UK - Market size and forecast 2024-2029 ($ million)
- Exhibits111: Chart on UK - Year-over-year growth 2024-2029 (%)
- Exhibits112: Data Table on UK - Year-over-year growth 2024-2029 (%)
- Exhibits113: Chart on Germany - Market size and forecast 2024-2029 ($ million)
- Exhibits114: Data Table on Germany - Market size and forecast 2024-2029 ($ million)
- Exhibits115: Chart on Germany - Year-over-year growth 2024-2029 (%)
- Exhibits116: Data Table on Germany - Year-over-year growth 2024-2029 (%)
- Exhibits117: Chart on France - Market size and forecast 2024-2029 ($ million)
- Exhibits118: Data Table on France - Market size and forecast 2024-2029 ($ million)
- Exhibits119: Chart on France - Year-over-year growth 2024-2029 (%)
- Exhibits120: Data Table on France - Year-over-year growth 2024-2029 (%)
- Exhibits121: Chart on Brazil - Market size and forecast 2024-2029 ($ million)
- Exhibits122: Data Table on Brazil - Market size and forecast 2024-2029 ($ million)
- Exhibits123: Chart on Brazil - Year-over-year growth 2024-2029 (%)
- Exhibits124: Data Table on Brazil - Year-over-year growth 2024-2029 (%)
- Exhibits125: Chart on Spain - Market size and forecast 2024-2029 ($ million)
- Exhibits126: Data Table on Spain - Market size and forecast 2024-2029 ($ million)
- Exhibits127: Chart on Spain - Year-over-year growth 2024-2029 (%)
- Exhibits128: Data Table on Spain - Year-over-year growth 2024-2029 (%)
- Exhibits129: Market opportunity By Geographical Landscape ($ million)
- Exhibits130: Data Tables on Market opportunity By Geographical Landscape ($ million)
- Exhibits131: Impact of drivers and challenges in 2024 and 2029
- Exhibits132: Overview on criticality of inputs and factors of differentiation
- Exhibits133: Overview on factors of disruption
- Exhibits134: Impact of key risks on business
- Exhibits135: Companies covered
- Exhibits136: Company ranking index
- Exhibits137: Matrix on companies position and classification
- Exhibits138: ABB Ltd. - Overview
- Exhibits139: ABB Ltd. - Business segments
- Exhibits140: ABB Ltd. - Key news
- Exhibits141: ABB Ltd. - Key offerings
- Exhibits142: ABB Ltd. - Segment focus
- Exhibits143: SWOT
- Exhibits144: Alfen NV - Overview
- Exhibits145: Alfen NV - Product / Service
- Exhibits146: Alfen NV - Key offerings
- Exhibits147: SWOT
- Exhibits148: BYD Co. Ltd. - Overview
- Exhibits149: BYD Co. Ltd. - Business segments
- Exhibits150: BYD Co. Ltd. - Key news
- Exhibits151: BYD Co. Ltd. - Key offerings
- Exhibits152: BYD Co. Ltd. - Segment focus
- Exhibits153: SWOT
- Exhibits154: Eaton Corp plc - Overview
- Exhibits155: Eaton Corp plc - Business segments
- Exhibits156: Eaton Corp plc - Key news
- Exhibits157: Eaton Corp plc - Key offerings
- Exhibits158: Eaton Corp plc - Segment focus
- Exhibits159: SWOT
- Exhibits160: General Electric Co. - Overview
- Exhibits161: General Electric Co. - Business segments
- Exhibits162: General Electric Co. - Key news
- Exhibits163: General Electric Co. - Key offerings
- Exhibits164: General Electric Co. - Segment focus
- Exhibits165: SWOT
- Exhibits166: Infineon Technologies AG - Overview
- Exhibits167: Infineon Technologies AG - Business segments
- Exhibits168: Infineon Technologies AG - Key news
- Exhibits169: Infineon Technologies AG - Key offerings
- Exhibits170: Infineon Technologies AG - Segment focus
- Exhibits171: SWOT
- Exhibits172: LS Power Development LLC - Overview
- Exhibits173: LS Power Development LLC - Product / Service
- Exhibits174: LS Power Development LLC - Key offerings
- Exhibits175: SWOT
- Exhibits176: Phihong USA Corp. - Overview
- Exhibits177: Phihong USA Corp. - Product / Service
- Exhibits178: Phihong USA Corp. - Key offerings
- Exhibits179: SWOT
- Exhibits180: Schneider Electric SE - Overview
- Exhibits181: Schneider Electric SE - Business segments
- Exhibits182: Schneider Electric SE - Key news
- Exhibits183: Schneider Electric SE - Key offerings
- Exhibits184: Schneider Electric SE - Segment focus
- Exhibits185: SWOT
- Exhibits186: Shell plc - Overview
- Exhibits187: Shell plc - Business segments
- Exhibits188: Shell plc - Key news
- Exhibits189: Shell plc - Key offerings
- Exhibits190: Shell plc - Segment focus
- Exhibits191: SWOT
- Exhibits192: Siemens AG - Overview
- Exhibits193: Siemens AG - Business segments
- Exhibits194: Siemens AG - Key news
- Exhibits195: Siemens AG - Key offerings
- Exhibits196: Siemens AG - Segment focus
- Exhibits197: SWOT
- Exhibits198: Tesla Inc. - Overview
- Exhibits199: Tesla Inc. - Business segments
- Exhibits200: Tesla Inc. - Key news
- Exhibits201: Tesla Inc. - Key offerings
- Exhibits202: Tesla Inc. - Segment focus
- Exhibits203: SWOT
- Exhibits204: The Mobility House GmbH - Overview
- Exhibits205: The Mobility House GmbH - Product / Service
- Exhibits206: The Mobility House GmbH - Key offerings
- Exhibits207: SWOT
- Exhibits208: TotalEnergies SE - Overview
- Exhibits209: TotalEnergies SE - Business segments
- Exhibits210: TotalEnergies SE - Key news
- Exhibits211: TotalEnergies SE - Key offerings
- Exhibits212: TotalEnergies SE - Segment focus
- Exhibits213: SWOT
- Exhibits214: Webasto SE - Overview
- Exhibits215: Webasto SE - Product / Service
- Exhibits216: Webasto SE - Key news
- Exhibits217: Webasto SE - Key offerings
- Exhibits218: SWOT
- Exhibits219: Inclusions checklist
- Exhibits220: Exclusions checklist
- Exhibits221: Currency conversion rates for US$
- Exhibits222: Research methodology
- Exhibits223: Information sources
- Exhibits224: Data validation
- Exhibits225: Validation techniques employed for market sizing
- Exhibits226: Data synthesis
- Exhibits227: 360 degree market analysis
- Exhibits228: List of abbreviations
Electric Vehicle Charging Infrastructure Market 2025-2029
The electric vehicle charging infrastructure market is forecasted to grow by USD 196654 mn during 2024-2029, accelerating at a CAGR of 44.8% during the forecast period. The report on the electric vehicle charging infrastructure market provides a holistic analysis, market size and forecast, trends, growth drivers, and challenges, as well as vendor analysis covering around 25 vendors.
The report offers an up-to-date analysis regarding the current market scenario, the latest trends and drivers, and the overall market environment. The market is driven by rise in government initiatives that support installation of EV charging stations, increasing EV sales through tax incentives push demand for well-built EV charging infrastructure, and growing production of EVs.
| Market Scope | |
|---|---|
| Base Year | 2025 |
| End Year | 2029 |
| Series Year | 2025-2029 |
| Growth Momentum | Accelerate |
| YOY 2025 | 32.2% |
| CAGR | 44.8% |
| Incremental Value | $196654 mn |
Technavio's electric vehicle charging infrastructure market is segmented as below:
By Method
- Fast charger
- Slow charger
By Type
- AC
- DC
By Geographical Landscape
- APAC
- North America
- Europe
- South America
- Middle East and Africa
This study identifies the powering EV charging stations through renewable energy as one of the prime reasons driving the electric vehicle charging infrastructure market growth during the next few years. Also, emergence of wireless charging of EVs and proliferation of vehicle to grid (V2G) energy transfer will lead to sizable demand in the market.
The report on the electric vehicle charging infrastructure market covers the following areas:
- Electric Vehicle Charging Infrastructure Market sizing
- Electric Vehicle Charging Infrastructure Market forecast
- Electric Vehicle Charging Infrastructure Market industry analysis
The robust vendor analysis is designed to help clients improve their market position, and in line with this, this report provides a detailed analysis of several leading electric vehicle charging infrastructure market vendors that include ABB Ltd., AeroVironment Inc., Alfen NV, BYD Co. Ltd., ChargePoint Holdings Inc., Eaton Corp PLC, General Electric Co., Infineon Technologies AG, LS Power Development LLC, PG and E Corp., Phihong USA Corp., Polarium Energy Solutions AB, Schneider Electric SE, Shell PLC, Shenzhen ATESS Power, Siemens AG, Tesla Inc., The Mobility House GmbH, TotalEnergies SE, and Webasto SE. Also, the electric vehicle charging infrastructure market analysis report includes information on upcoming trends and challenges that will influence market growth. This is to help companies strategize and leverage all forthcoming growth opportunities.
The study was conducted using an objective combination of primary and secondary information including inputs from key participants in the industry. The report contains a comprehensive market and vendor landscape in addition to an analysis of the key vendors.
The publisher presents a detailed picture of the market by the way of study, synthesis, and summation of data from multiple sources by an analysis of key parameters such as profit, pricing, competition, and promotions. It presents various market facets by identifying the key industry influencers. The data presented is comprehensive, reliable, and a result of extensive primary and secondary research. The market research reports provide a complete competitive landscape and an in-depth vendor selection methodology and analysis using qualitative and quantitative research to forecast accurate market growth.
Table of Contents
1 Executive Summary
- 1.1 Market overview
- Executive Summary - Chart on Market Overview
- Executive Summary - Data Table on Market Overview
- Executive Summary - Chart on Global Market Characteristics
- Executive Summary - Chart on Market By Geographical Landscape
- Executive Summary - Chart on Market Segmentation by Method
- Executive Summary - Chart on Market Segmentation by Type
- Executive Summary - Chart on Incremental Growth
- Executive Summary - Data Table on Incremental Growth
- Executive Summary - Chart on Company Market Positioning
2 Technavio Analysis
- 2.1 Analysis of price sensitivity, lifecycle, customer purchase basket, adoption rates, and purchase criteria
- Analysis of price sensitivity, lifecycle, customer purchase basket, adoption rates, and purchase criteria
- 2.2 Criticality of inputs and Factors of differentiation
- Overview on criticality of inputs and factors of differentiation
- 2.3 Factors of disruption
- Overview on factors of disruption
- 2.4 Impact of drivers and challenges
- Impact of drivers and challenges in 2024 and 2029
3 Market Landscape
- 3.1 Market ecosystem
- Parent Market
- Data Table on - Parent Market
- 3.2 Market characteristics
- Market characteristics analysis
- 3.3 Value chain analysis
- Value chain analysis
4 Market Sizing
- 4.1 Market definition
- Offerings of companies included in the market definition
- 4.2 Market segment analysis
- Market segments
- 4.3 Market size 2024
- 4.4 Market outlook: Forecast for 2024-2029
- Chart on Global - Market size and forecast 2024-2029 ($ million)
- Data Table on Global - Market size and forecast 2024-2029 ($ million)
- Chart on Global Market: Year-over-year growth 2024-2029 (%)
- Data Table on Global Market: Year-over-year growth 2024-2029 (%)
5 Historic Market Size
- 5.1 Global Electric Vehicle Charging Infrastructure Market 2019 - 2023
- Historic Market Size - Data Table on Global Electric Vehicle Charging Infrastructure Market 2019 - 2023 ($ million)
- 5.2 Method segment analysis 2019 - 2023
- Historic Market Size - Method Segment 2019 - 2023 ($ million)
- 5.3 Type segment analysis 2019 - 2023
- Historic Market Size - Type Segment 2019 - 2023 ($ million)
- 5.4 Geography segment analysis 2019 - 2023
- Historic Market Size - Geography Segment 2019 - 2023 ($ million)
- 5.5 Country segment analysis 2019 - 2023
- Historic Market Size - Country Segment 2019 - 2023 ($ million)
6 Qualitative Analysis
- 6.1 The AI impact on Global Electric Vehicle Charging Infrastructure Market
7 Five Forces Analysis
- 7.1 Five forces summary
- Five forces analysis - Comparison between 2024 and 2029
- 7.2 Bargaining power of buyers
- Bargaining power of buyers - Impact of key factors 2024 and 2029
- 7.3 Bargaining power of suppliers
- Bargaining power of suppliers - Impact of key factors in 2024 and 2029
- 7.4 Threat of new entrants
- Threat of new entrants - Impact of key factors in 2024 and 2029
- 7.5 Threat of substitutes
- Threat of substitutes - Impact of key factors in 2024 and 2029
- 7.6 Threat of rivalry
- Threat of rivalry - Impact of key factors in 2024 and 2029
- 7.7 Market condition
- Chart on Market condition - Five forces 2024 and 2029
8 Market Segmentation by Method
- 8.1 Market segments
- Chart on Method - Market share 2024-2029 (%)
- Data Table on Method - Market share 2024-2029 (%)
- 8.2 Comparison by Method
- Chart on Comparison by Method
- Data Table on Comparison by Method
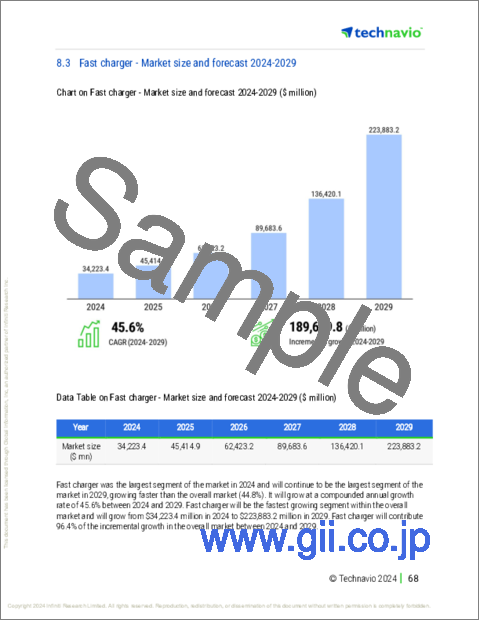
- 8.3 Fast charger - Market size and forecast 2024-2029
- Chart on Fast charger - Market size and forecast 2024-2029 ($ million)
- Data Table on Fast charger - Market size and forecast 2024-2029 ($ million)
- Chart on Fast charger - Year-over-year growth 2024-2029 (%)
- Data Table on Fast charger - Year-over-year growth 2024-2029 (%)
- 8.4 Slow charger - Market size and forecast 2024-2029
- Chart on Slow charger - Market size and forecast 2024-2029 ($ million)
- Data Table on Slow charger - Market size and forecast 2024-2029 ($ million)
- Chart on Slow charger - Year-over-year growth 2024-2029 (%)
- Data Table on Slow charger - Year-over-year growth 2024-2029 (%)
- 8.5 Market opportunity by Method
- Market opportunity by Method ($ million)
- Data Table on Market opportunity by Method ($ million)
9 Market Segmentation by Type
- 9.1 Market segments
- Chart on Type - Market share 2024-2029 (%)
- Data Table on Type - Market share 2024-2029 (%)
- 9.2 Comparison by Type
- Chart on Comparison by Type
- Data Table on Comparison by Type
- 9.3 AC - Market size and forecast 2024-2029
- Chart on AC - Market size and forecast 2024-2029 ($ million)
- Data Table on AC - Market size and forecast 2024-2029 ($ million)
- Chart on AC - Year-over-year growth 2024-2029 (%)
- Data Table on AC - Year-over-year growth 2024-2029 (%)
- 9.4 DC - Market size and forecast 2024-2029
- Chart on DC - Market size and forecast 2024-2029 ($ million)
- Data Table on DC - Market size and forecast 2024-2029 ($ million)
- Chart on DC - Year-over-year growth 2024-2029 (%)
- Data Table on DC - Year-over-year growth 2024-2029 (%)
- 9.5 Market opportunity by Type
- Market opportunity by Type ($ million)
- Data Table on Market opportunity by Type ($ million)
10 Customer Landscape
- 10.1 Customer landscape overview
- Analysis of price sensitivity, lifecycle, customer purchase basket, adoption rates, and purchase criteria
11 Geographic Landscape
- 11.1 Geographic segmentation
- Chart on Market share By Geographical Landscape 2024-2029 (%)
- Data Table on Market share By Geographical Landscape 2024-2029 (%)
- 11.2 Geographic comparison
- Chart on Geographic comparison
- Data Table on Geographic comparison
- 11.3 APAC - Market size and forecast 2024-2029
- Chart on APAC - Market size and forecast 2024-2029 ($ million)
- Data Table on APAC - Market size and forecast 2024-2029 ($ million)
- Chart on APAC - Year-over-year growth 2024-2029 (%)
- Data Table on APAC - Year-over-year growth 2024-2029 (%)
- 11.4 North America - Market size and forecast 2024-2029
- Chart on North America - Market size and forecast 2024-2029 ($ million)
- Data Table on North America - Market size and forecast 2024-2029 ($ million)
- Chart on North America - Year-over-year growth 2024-2029 (%)
- Data Table on North America - Year-over-year growth 2024-2029 (%)
- 11.5 Europe - Market size and forecast 2024-2029
- Chart on Europe - Market size and forecast 2024-2029 ($ million)
- Data Table on Europe - Market size and forecast 2024-2029 ($ million)
- Chart on Europe - Year-over-year growth 2024-2029 (%)
- Data Table on Europe - Year-over-year growth 2024-2029 (%)
- 11.6 South America - Market size and forecast 2024-2029
- Chart on South America - Market size and forecast 2024-2029 ($ million)
- Data Table on South America - Market size and forecast 2024-2029 ($ million)
- Chart on South America - Year-over-year growth 2024-2029 (%)
- Data Table on South America - Year-over-year growth 2024-2029 (%)
- 11.7 Middle East and Africa - Market size and forecast 2024-2029
- Chart on Middle East and Africa - Market size and forecast 2024-2029 ($ million)
- Data Table on Middle East and Africa - Market size and forecast 2024-2029 ($ million)
- Chart on Middle East and Africa - Year-over-year growth 2024-2029 (%)
- Data Table on Middle East and Africa - Year-over-year growth 2024-2029 (%)
- 11.8 China - Market size and forecast 2024-2029
- Chart on China - Market size and forecast 2024-2029 ($ million)
- Data Table on China - Market size and forecast 2024-2029 ($ million)
- Chart on China - Year-over-year growth 2024-2029 (%)
- Data Table on China - Year-over-year growth 2024-2029 (%)
- 11.9 US - Market size and forecast 2024-2029
- Chart on US - Market size and forecast 2024-2029 ($ million)
- Data Table on US - Market size and forecast 2024-2029 ($ million)
- Chart on US - Year-over-year growth 2024-2029 (%)
- Data Table on US - Year-over-year growth 2024-2029 (%)
- 11.10 Japan - Market size and forecast 2024-2029
- Chart on Japan - Market size and forecast 2024-2029 ($ million)
- Data Table on Japan - Market size and forecast 2024-2029 ($ million)
- Chart on Japan - Year-over-year growth 2024-2029 (%)
- Data Table on Japan - Year-over-year growth 2024-2029 (%)
- 11.11 India - Market size and forecast 2024-2029
- Chart on India - Market size and forecast 2024-2029 ($ million)
- Data Table on India - Market size and forecast 2024-2029 ($ million)
- Chart on India - Year-over-year growth 2024-2029 (%)
- Data Table on India - Year-over-year growth 2024-2029 (%)
- 11.12 Canada - Market size and forecast 2024-2029
- Chart on Canada - Market size and forecast 2024-2029 ($ million)
- Data Table on Canada - Market size and forecast 2024-2029 ($ million)
- Chart on Canada - Year-over-year growth 2024-2029 (%)
- Data Table on Canada - Year-over-year growth 2024-2029 (%)
- 11.13 UK - Market size and forecast 2024-2029
- Chart on UK - Market size and forecast 2024-2029 ($ million)
- Data Table on UK - Market size and forecast 2024-2029 ($ million)
- Chart on UK - Year-over-year growth 2024-2029 (%)
- Data Table on UK - Year-over-year growth 2024-2029 (%)
- 11.14 Germany - Market size and forecast 2024-2029
- Chart on Germany - Market size and forecast 2024-2029 ($ million)
- Data Table on Germany - Market size and forecast 2024-2029 ($ million)
- Chart on Germany - Year-over-year growth 2024-2029 (%)
- Data Table on Germany - Year-over-year growth 2024-2029 (%)
- 11.15 France - Market size and forecast 2024-2029
- Chart on France - Market size and forecast 2024-2029 ($ million)
- Data Table on France - Market size and forecast 2024-2029 ($ million)
- Chart on France - Year-over-year growth 2024-2029 (%)
- Data Table on France - Year-over-year growth 2024-2029 (%)
- 11.16 Brazil - Market size and forecast 2024-2029
- Chart on Brazil - Market size and forecast 2024-2029 ($ million)
- Data Table on Brazil - Market size and forecast 2024-2029 ($ million)
- Chart on Brazil - Year-over-year growth 2024-2029 (%)
- Data Table on Brazil - Year-over-year growth 2024-2029 (%)
- 11.17 Spain - Market size and forecast 2024-2029
- Chart on Spain - Market size and forecast 2024-2029 ($ million)
- Data Table on Spain - Market size and forecast 2024-2029 ($ million)
- Chart on Spain - Year-over-year growth 2024-2029 (%)
- Data Table on Spain - Year-over-year growth 2024-2029 (%)
- 11.18 Market opportunity By Geographical Landscape
- Market opportunity By Geographical Landscape ($ million)
- Data Tables on Market opportunity By Geographical Landscape ($ million)
12 Drivers, Challenges, and Opportunity/Restraints
- 12.1 Market drivers
- 12.2 Market challenges
- 12.3 Impact of drivers and challenges
- Impact of drivers and challenges in 2024 and 2029
- 12.4 Market opportunities/restraints
13 Competitive Landscape
- 13.1 Overview
- 13.2 Competitive Landscape
- Overview on criticality of inputs and factors of differentiation
- 13.3 Landscape disruption
- Overview on factors of disruption
- 13.4 Industry risks
- Impact of key risks on business
14 Competitive Analysis
- 14.1 Companies profiled
- Companies covered
- 14.2 Company ranking index
- Company ranking index
- 14.3 Market positioning of companies
- Matrix on companies position and classification
- 14.4 ABB Ltd.
- ABB Ltd. - Overview
- ABB Ltd. - Business segments
- ABB Ltd. - Key news
- ABB Ltd. - Key offerings
- ABB Ltd. - Segment focus
- SWOT
- 14.5 Alfen NV
- Alfen NV - Overview
- Alfen NV - Product / Service
- Alfen NV - Key offerings
- SWOT
- 14.6 BYD Co. Ltd.
ByD Co. Ltd. - Overview
ByD Co. Ltd. - Business segments
ByD Co. Ltd. - Key news
ByD Co. Ltd. - Key offerings
ByD Co. Ltd. - Segment focus
- SWOT
- 14.7 Eaton Corp plc
- Eaton Corp plc - Overview
- Eaton Corp plc - Business segments
- Eaton Corp plc - Key news
- Eaton Corp plc - Key offerings
- Eaton Corp plc - Segment focus
- SWOT
- 14.8 General Electric Co.
- General Electric Co. - Overview
- General Electric Co. - Business segments
- General Electric Co. - Key news
- General Electric Co. - Key offerings
- General Electric Co. - Segment focus
- SWOT
- 14.9 Infineon Technologies AG
- Infineon Technologies AG - Overview
- Infineon Technologies AG - Business segments
- Infineon Technologies AG - Key news
- Infineon Technologies AG - Key offerings
- Infineon Technologies AG - Segment focus
- SWOT
- 14.10 LS Power Development LLC
- LS Power Development LLC - Overview
- LS Power Development LLC - Product / Service
- LS Power Development LLC - Key offerings
- SWOT
- 14.11 Phihong USA Corp.
- Phihong USA Corp. - Overview
- Phihong USA Corp. - Product / Service
- Phihong USA Corp. - Key offerings
- SWOT
- 14.12 Schneider Electric SE
- Schneider Electric SE - Overview
- Schneider Electric SE - Business segments
- Schneider Electric SE - Key news
- Schneider Electric SE - Key offerings
- Schneider Electric SE - Segment focus
- SWOT
- 14.13 Shell plc
- Shell plc - Overview
- Shell plc - Business segments
- Shell plc - Key news
- Shell plc - Key offerings
- Shell plc - Segment focus
- SWOT
- 14.14 Siemens AG
- Siemens AG - Overview
- Siemens AG - Business segments
- Siemens AG - Key news
- Siemens AG - Key offerings
- Siemens AG - Segment focus
- SWOT
- 14.15 Tesla Inc.
- Tesla Inc. - Overview
- Tesla Inc. - Business segments
- Tesla Inc. - Key news
- Tesla Inc. - Key offerings
- Tesla Inc. - Segment focus
- SWOT
- 14.16 The Mobility House GmbH
- The Mobility House GmbH - Overview
- The Mobility House GmbH - Product / Service
- The Mobility House GmbH - Key offerings
- SWOT
- 14.17 TotalEnergies SE
- TotalEnergies SE - Overview
- TotalEnergies SE - Business segments
- TotalEnergies SE - Key news
- TotalEnergies SE - Key offerings
- TotalEnergies SE - Segment focus
- SWOT
- 14.18 Webasto SE
- Webasto SE - Overview
- Webasto SE - Product / Service
- Webasto SE - Key news
- Webasto SE - Key offerings
- SWOT
15 Appendix
- 15.1 Scope of the report
- 15.2 Inclusions and exclusions checklist
- Inclusions checklist
- Exclusions checklist
- 15.3 Currency conversion rates for US$
- Currency conversion rates for US$
- 15.4 Research methodology
- Research methodology
- 15.5 Data procurement
- Information sources
- 15.6 Data validation
- Data validation
- 15.7 Validation techniques employed for market sizing
- Validation techniques employed for market sizing
- 15.8 Data synthesis
- Data synthesis
- 15.9 360 degree market analysis
- 360 degree market analysis
- 15.10 List of abbreviations
- List of abbreviations

