|
|
市場調査レポート
商品コード
1859851
リチウムイオン電池リサイクルソリューションの世界市場、2025年~2029年Global Lithium-ion Battery Recycling Solution Market 2025-2029 |
||||||
|
|||||||
カスタマイズ可能
|
|||||||

| リチウムイオン電池リサイクルソリューションの世界市場、2025年~2029年 |
|
出版日: 2025年08月29日
発行: TechNavio
ページ情報: 英文 221 Pages
納期: 即納可能
|

概要
リチウムイオン電池リサイクルソリューション市場は2024-2029年に151億70万米ドル、予測期間中のCAGRは20.7%で成長すると予測されます。
当レポートでは、リチウムイオン電池リサイクルソリューション市場の全体的な分析、市場規模・予測、動向、成長促進要因、課題、約25のベンダーを網羅したベンダー分析などを掲載しています。
現在の市場シナリオ、最新動向と促進要因、市場環境全体に関する最新分析を提供しています。世界的なEVの普及拡大、リチウムイオンバッテリーのリサイクルに対する政府支援の拡大、リチウムイオンバッテリーに使用される材料の希少性の高まりなどが市場を牽引しています。
| 市場範囲 | |
|---|---|
| 基準年 | 2025 |
| 終了年 | 2029 |
| 予測期間 | 2025-2029 |
| 成長モメンタム | 加速 |
| 前年比 | 19.1% |
| CAGR | 20.7% |
| 増分額 | 151億70万米ドル |
本調査は、業界の主要参加者からのインプットを含め、一次情報と二次情報を客観的に組み合わせて実施しました。レポートには、主要企業の分析に加え、包括的な市場規模データ、地域別分析によるセグメント、ベンダー情勢が含まれています。レポートには過去データと予測データがあります。
本調査では、今後数年間のリチウムイオン電池リサイクルソリューション市場の成長を促進する主な要因の1つとして、新たなバッテリーリサイクル施設の開設を挙げています。また、電池リサイクルにおける独自のアプローチの採用や、企業による消費者向け電池リサイクルプログラムの開始は、市場の大きな需要につながります。
目次
第1章 エグゼクティブサマリー
- 市場概要
第2章 Technavio分析
- 価格・ライフサイクル・顧客購入バスケット・採用率・購入基準の分析
- インプットの重要性と差別化の要因
- 混乱の要因
- 促進要因と課題の影響
第3章 市場情勢
- 市場エコシステム
- 市場の特徴
- バリューチェーン分析
第4章 市場規模
- 市場の定義
- 市場セグメント分析
- 市場規模 2024
- 市場の見通し 2024-2029
第5章 市場規模実績
- リチウムイオン電池リサイクルソリューションの世界市場 2019-2023
- タイプセグメント分析 2019-2023
- 用途別セグメント分析 2019-2023
- 技術セグメント分析 2019-2023
- 地域別セグメント分析 2019-2023
- 国別セグメント分析 2019-2023
第6章 定性分析
- AIの影響:リチウムイオン電池リサイクルソリューションの世界市場
第7章 ファイブフォース分析
- ファイブフォースの要約
- 買い手の交渉力
- 供給企業の交渉力
- 新規参入業者の脅威
- 代替品の脅威
- 競争の脅威
- 市況
第8章 市場セグメンテーション:タイプ別
- 市場セグメント
- 比較:タイプ別
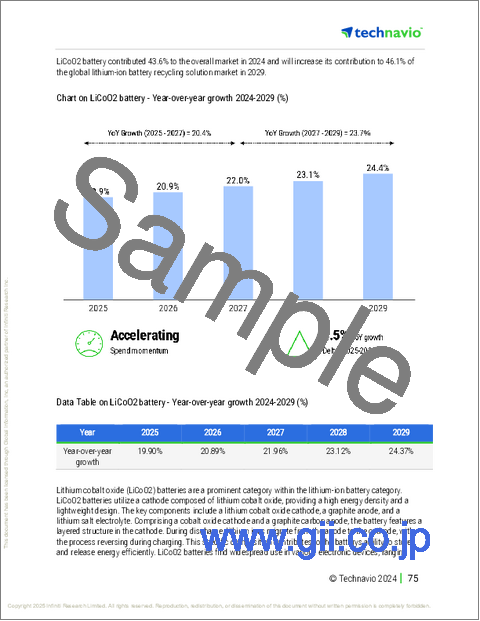
- LiCoO2電池:市場規模と予測 2024-2029
- NMC電池:市場規模と予測 2024-2029
- LiFePO4電池:市場規模と予測 2024-2029
- その他:市場規模と予測 2024-2029
- 市場機会:タイプ別
第9章 市場セグメンテーション:用途別
- 市場セグメント
- 比較:用途別
- 自動車:市場規模と予測 2024-2029
- 非自動車:市場規模と予測 2024-2029
- 市場機会:用途別
第10章 市場セグメンテーション:技術別
- 市場セグメント
- 比較:技術別
- 湿式冶金プロセス:市場規模と予測 2024-2029
- 乾式製錬プロセス:市場規模と予測 2024-2029
- 機械的分離:市場規模と予測 2024-2029
- 市場機会:技術別
第11章 顧客情勢
- 顧客情勢の概要
第12章 地域別情勢
- 地域別セグメンテーション
- 地域別比較
- アジア太平洋:市場規模と予測 2024-2029
- 欧州:市場規模と予測 2024-2029
- 北米:市場規模と予測 2024-2029
- 南米:市場規模と予測 2024-2029
- 中東・アフリカ:市場規模と予測 2024-2029
- 米国:市場規模と予測 2024-2029
- 日本:市場規模と予測 2024-2029
- ドイツ:市場規模と予測 2024-2029
- 中国:市場規模と予測 2024-2029
- インド:市場規模と予測 2024-2029
- 英国:市場規模と予測 2024-2029
- 韓国:市場規模と予測 2024-2029
- フランス:市場規模と予測 2024-2029
- カナダ:市場規模と予測 2024-2029
- イタリア:市場規模と予測 2024-2029
- 市場機会:地域情勢別
第13章 促進要因・課題・機会・抑制要因
- 市場促進要因
- 市場の課題
- 促進要因と課題の影響
- 市場の機会・抑制要因
第14章 競合情勢
- 概要
- 競合情勢
- 混乱の状況
- 業界のリスク
第15章 競合分析
- 企業プロファイル
- 企業ランキング
- 企業の市場ポジショニング
- Accurec Recycling GmbH
- ACE Green Recycling Inc.
- American Battery Technology Co.
- Ascend Elements Inc.
- Contemporary Amperex Technology Co. Ltd.
- Ecobat LLC
- Fortum Oyj
- Ganfeng Lithium Group Co. Ltd.
- GEM Co. Ltd.
- Glencore Plc
- Li Cycle Holdings Corp.
- RecycLiCo Battery Materials Inc.
- Redwood Materials Inc.
- Stena Metall Group
- Umicore SA

