|
|
市場調査レポート
商品コード
1660792
アルミ箔包装の世界市場(2025年~2029年)Global Aluminum Foil Packaging Market 2025-2029 |
||||||

|
|||||||
カスタマイズ可能
|
|||||||


| アルミ箔包装の世界市場(2025年~2029年) |
|
出版日: 2025年02月19日
発行: TechNavio
ページ情報: 英文 246 Pages
納期: 即納可能
|

全表示
- 概要
- 目次
世界のアルミ箔包装の市場規模は、2024年~2029年に70億5,220万米ドルに達し、予測期間中のCAGRは5.3%で成長すると予測されます。
当レポートでは、アルミ箔包装市場の全体的な分析、市場規模・予測、動向、成長促進要因、課題、約25のベンダーを網羅したベンダー分析などを掲載しています。
当レポートは、現在の市場シナリオ、最新動向と促進要因、市場環境全体に関する最新分析を提供しています。市場は、利便性の高い包装への需要の高まり、米国の医薬品ブリスター包装分野からの需要の高まり、フレキシブルな蓋付きストック包装への世界の需要の高まりによって牽引されています。
| 市場範囲 | |
|---|---|
| 基準年 | 2025年 |
| 終了年 | 2029年 |
| 予測期間 | 2025年~2029年 |
| 成長モメンタム | 加速 |
| 前年比2025年 | 4.8% |
| CAGR | 5.3% |
| 増分額 | 70億5,220万米ドル |
本調査は、業界の主要参入企業からのインプットを含め、一次情報と二次情報を客観的に組み合わせて実施しました。レポートには、主要企業の分析に加え、包括的な市場規模データ、地域分析によるセグメント、ベンダー情勢が含まれています。レポートには実績データと予測データがあります。
本調査では、アルミ箔包装の新たなリサイクル技術が、今後数年間のアルミ箔包装市場の成長を促進する主要な理由の1つであると特定しています。また、食品安全包装への需要の高まりと組織小売セクターの拡大は、市場の大きな需要につながる見込みです。
目次
第1章 エグゼクティブサマリー
- 市場概要
第2章 Technavioの分析
- 価格感度・ライフサイクル・顧客購入バスケット・採用率・購入基準の分析
- インプットの重要性と差別化の要因
- ディスラプションの要因
- 促進要因と課題の影響
第3章 市場情勢
- 市場エコシステム
- 市場の特徴
- バリューチェーン分析
第4章 市場規模
- 市場の定義
- 市場セグメント分析
- 市場規模(2024年)
- 市場の見通し(2024年~2029年)
第5章 市場規模実績
- アルミ箔包装の世界市場(2019年~2023年)
- 製品セグメント分析(2019年~2023年)
- 用途セグメント分析(2019年~2023年)
- 包装タイプセグメント分析(2019年~2023年)
- バリアントセグメント分析(2019年~2023年)
- 地域セグメント分析(2019年~2023年)
- 国セグメント分析(2019年~2023年)
第6章 定性分析
- AIの影響:アルミ箔包装の世界市場
第7章 ファイブフォース分析
- ファイブフォースの要約
- 買い手の交渉力
- 供給企業の交渉力
- 新規参入業者の脅威
- 代替品の脅威
- 競争の脅威
- 市況
第8章 市場セグメンテーション:製品別
- 市場セグメント
- 比較:製品別
- ラッピング用箔:市場規模と予測(2024年~2029年)
- 容器用箔:市場規模と予測(2024年~2029年)
- ブリスターパック:市場規模と予測(2024年~2029年)
- パウチ:市場規模と予測(2024年~2029年)
- その他:市場規模と予測(2024年~2029年)
- 市場機会:製品別
第9章 市場セグメンテーション:用途別
- 市場セグメント
- 比較:用途別
- 食品・飲料包装:市場規模と予測(2024年~2029年)
- 消費者向け包装:市場規模と予測(2024年~2029年)
- 医薬品包装:市場規模と予測(2024年~2029年)
- その他:市場規模と予測(2024年~2029年)
- 市場機会:用途別
第10章 市場セグメンテーション:包装タイプ別
- 市場セグメント
- 比較:包装タイプ別
- 印刷された箔:市場規模と予測(2024年~2029年)
- 印刷されていない箔:市場規模と予測(2024年~2029年)
- 市場機会:包装タイプ別
第11章 市場セグメンテーション:バリアント別
- 市場セグメント
- 比較:バリアント別
- 18ミクロン超:市場規模と予測(2024年~2029年)
- 市場機会:バリアント別
第12章 顧客情勢
- 顧客情勢の概要
第13章 地域別情勢
- 地域別セグメンテーション
- 地域別比較
- アジア太平洋:市場規模と予測(2024年~2029年)
- 欧州:市場規模と予測(2024年~2029年)
- 北米:市場規模と予測(2024年~2029年)
- 南米:市場規模と予測(2024年~2029年)
- 中東・アフリカ:市場規模と予測(2024年~2029年)
- 中国:市場規模と予測(2024年~2029年)
- 日本:市場規模と予測(2024年~2029年)
- 米国:市場規模と予測(2024年~2029年)
- インド:市場規模と予測(2024年~2029年)
- ドイツ:市場規模と予測(2024年~2029年)
- 韓国:市場規模と予測(2024年~2029年)
- オーストラリア:市場規模と予測(2024年~2029年)
- 英国:市場規模と予測(2024年~2029年)
- カナダ:市場規模と予測(2024年~2029年)
- フランス:市場規模と予測(2024年~2029年)
- 市場機会:地域情勢別
第14章 促進要因・課題・機会・抑制要因
- 市場促進要因
- 市場の課題
- 促進要因と課題の影響
- 市場の機会・抑制要因
第15章 競合情勢
- 概要
- 競合情勢
- ディスラプションの状況
- 業界のリスク
第16章 競合分析
- 企業プロファイル
- 企業ランキング指数
- 企業の市場ポジショニング
- ACG
- Aikou Packaging Co. Ltd.
- Aliberico SLU
- Aluflexpack AG
- Amcor Plc
- China Hongqiao Group Ltd.
- Constantia Flexibles Group GmbH
- Coppice Alupack Ltd.
- Eurofoil
- Gulf Aluminium Rolling Mill BSC
- Hindalco Industries Ltd.
- Hulamin Ltd.
- Kibar Holding AS
- Pactiv Evergreen Inc.
- United Co. RUSAL
第17章 付録
The aluminum foil packaging market is forecasted to grow by USD 7052.2 million during 2024-2029, accelerating at a CAGR of 5.3% during the forecast period. The report on the aluminum foil packaging market provides a holistic analysis, market size and forecast, trends, growth drivers, and challenges, as well as vendor analysis covering around 25 vendors.
The report offers an up-to-date analysis regarding the current market scenario, the latest trends and drivers, and the overall market environment. The market is driven by growing demand for convenient packaging, rising demand from pharmaceutical blister packaging sector in US, and growing global demand for flexible lid stock packaging.
| Market Scope | |
|---|---|
| Base Year | 2025 |
| End Year | 2029 |
| Series Year | 2025-2029 |
| Growth Momentum | Accelerate |
| YOY 2025 | 4.8% |
| CAGR | 5.3% |
| Incremental Value | $7052.2 mn |
The study was conducted using an objective combination of primary and secondary information including inputs from key participants in the industry. The report contains a comprehensive market size data, segment with regional analysis and vendor landscape in addition to an analysis of the key companies. Reports have historic and forecast data.
Technavio's aluminum foil packaging market is segmented as below:
By Product
- Wrapper foils
- Container foils
- Blister packs
- Pouches
- Others
By Application
- Food and beverage packaging
- Consumer packaging
- Pharmaceutical packaging
- Others
By Type Of Packaging
- Printed foil
- Unprinted foil
By Variant
- Above 18 microns
- 13 - 18 microns
- 6 - 8 microns
- 9 - 12 microns
By Geographical Landscape
- APAC
- Europe
- North America
- South America
- Middle East and Africa
This study identifies the emerging recycling techniques for aluminum foil packaging as one of the prime reasons driving the aluminum foil packaging market growth during the next few years. Also, growing demand for food safety packaging and expansion of organized retail sector will lead to sizable demand in the market.
The report on the aluminum foil packaging market covers the following areas:
- Aluminum Foil Packaging Market sizing
- Aluminum Foil Packaging Market forecast
- Aluminum Foil Packaging Market industry analysis
The robust vendor analysis is designed to help clients improve their market position, and in line with this, this report provides a detailed analysis of several leading aluminum foil packaging market vendors that include ACG, Aikou Packaging Co. Ltd., Aliberico SLU, Aluflexpack AG, Amcor PLC, China Hongqiao Group Ltd., Constantia Flexibles Group GmbH, Coppice Alupack Ltd., Eurofoil, Flexifoil Packaging Pvt. Ltd., Futuristic Packaging Pvt. Ltd., Gulf Aluminium Rolling Mill BSC, Hindalco Industries Ltd., Hulamin Ltd., i2r Packaging Solutions Ltd., Kibar Holding AS, Pactiv Evergreen Inc., Symetal SA, Tekni Plex Inc., and United Co. RUSAL. Also, the aluminum foil packaging market analysis report includes information on upcoming trends and challenges that will influence market growth. This is to help companies strategize and leverage all forthcoming growth opportunities.
The publisher presents a detailed picture of the market by the way of study, synthesis, and summation of data from multiple sources by an analysis of key parameters such as profit, pricing, competition, and promotions. It presents various market facets by identifying the key industry influencers. The data presented is comprehensive, reliable, and a result of extensive primary and secondary research. The market research reports provide a complete competitive landscape and an in-depth vendor selection methodology and analysis using qualitative and quantitative research to forecast accurate market growth.
Table of Contents
1 Executive Summary
- 1.1 Market overview
- Executive Summary - Chart on Market Overview
- Executive Summary - Data Table on Market Overview
- Executive Summary - Chart on Global Market Characteristics
- Executive Summary - Chart on Market By Geographical Landscape
- Executive Summary - Chart on Market Segmentation by Product
- Executive Summary - Chart on Market Segmentation by Application
- Executive Summary - Chart on Market Segmentation by Type of Packaging
- Executive Summary - Chart on Market Segmentation by Variant
- Executive Summary - Chart on Incremental Growth
- Executive Summary - Data Table on Incremental Growth
- Executive Summary - Chart on Company Market Positioning
2 Technavio Analysis
- 2.1 Analysis of price sensitivity, lifecycle, customer purchase basket, adoption rates, and purchase criteria
- Analysis of price sensitivity, lifecycle, customer purchase basket, adoption rates, and purchase criteria
- 2.2 Criticality of inputs and Factors of differentiation
- Overview on criticality of inputs and factors of differentiation
- 2.3 Factors of disruption
- Overview on factors of disruption
- 2.4 Impact of drivers and challenges
- Impact of drivers and challenges in 2024 and 2029
3 Market Landscape
- 3.1 Market ecosystem
- Parent Market
- Data Table on - Parent Market
- 3.2 Market characteristics
- Market characteristics analysis
- 3.3 Value chain analysis
- Value chain analysis
4 Market Sizing
- 4.1 Market definition
- Offerings of companies included in the market definition
- 4.2 Market segment analysis
- Market segments
- 4.3 Market size 2024
- 4.4 Market outlook: Forecast for 2024-2029
- Chart on Global - Market size and forecast 2024-2029 ($ million)
- Data Table on Global - Market size and forecast 2024-2029 ($ million)
- Chart on Global Market: Year-over-year growth 2024-2029 (%)
- Data Table on Global Market: Year-over-year growth 2024-2029 (%)
5 Historic Market Size
- 5.1 Global Aluminum Foil Packaging Market 2019 - 2023
- Historic Market Size - Data Table on Global Aluminum Foil Packaging Market 2019 - 2023 ($ million)
- 5.2 Product segment analysis 2019 - 2023
- Historic Market Size - Product Segment 2019 - 2023 ($ million)
- 5.3 Application segment analysis 2019 - 2023
- Historic Market Size - Application Segment 2019 - 2023 ($ million)
- 5.4 Type of Packaging segment analysis 2019 - 2023
- Historic Market Size - Type of Packaging Segment 2019 - 2023 ($ million)
- 5.5 Variant segment analysis 2019 - 2023
- Historic Market Size - Variant Segment 2019 - 2023 ($ million)
- 5.6 Geography segment analysis 2019 - 2023
- Historic Market Size - Geography Segment 2019 - 2023 ($ million)
- 5.7 Country segment analysis 2019 - 2023
- Historic Market Size - Country Segment 2019 - 2023 ($ million)
6 Qualitative Analysis
- 6.1 Impact of AI on Global Aluminum Foil Packaging Market
7 Five Forces Analysis
- 7.1 Five forces summary
- Five forces analysis - Comparison between 2024 and 2029
- 7.2 Bargaining power of buyers
- Bargaining power of buyers - Impact of key factors 2024 and 2029
- 7.3 Bargaining power of suppliers
- Bargaining power of suppliers - Impact of key factors in 2024 and 2029
- 7.4 Threat of new entrants
- Threat of new entrants - Impact of key factors in 2024 and 2029
- 7.5 Threat of substitutes
- Threat of substitutes - Impact of key factors in 2024 and 2029
- 7.6 Threat of rivalry
- Threat of rivalry - Impact of key factors in 2024 and 2029
- 7.7 Market condition
- Chart on Market condition - Five forces 2024 and 2029
8 Market Segmentation by Product
- 8.1 Market segments
- Chart on Product - Market share 2024-2029 (%)
- Data Table on Product - Market share 2024-2029 (%)
- 8.2 Comparison by Product
- Chart on Comparison by Product
- Data Table on Comparison by Product
- 8.3 Wrapper foils - Market size and forecast 2024-2029
- Chart on Wrapper foils - Market size and forecast 2024-2029 ($ million)
- Data Table on Wrapper foils - Market size and forecast 2024-2029 ($ million)
- Chart on Wrapper foils - Year-over-year growth 2024-2029 (%)
- Data Table on Wrapper foils - Year-over-year growth 2024-2029 (%)
- 8.4 Container foils - Market size and forecast 2024-2029
- Chart on Container foils - Market size and forecast 2024-2029 ($ million)
- Data Table on Container foils - Market size and forecast 2024-2029 ($ million)
- Chart on Container foils - Year-over-year growth 2024-2029 (%)
- Data Table on Container foils - Year-over-year growth 2024-2029 (%)
- 8.5 Blister packs - Market size and forecast 2024-2029
- Chart on Blister packs - Market size and forecast 2024-2029 ($ million)
- Data Table on Blister packs - Market size and forecast 2024-2029 ($ million)
- Chart on Blister packs - Year-over-year growth 2024-2029 (%)
- Data Table on Blister packs - Year-over-year growth 2024-2029 (%)
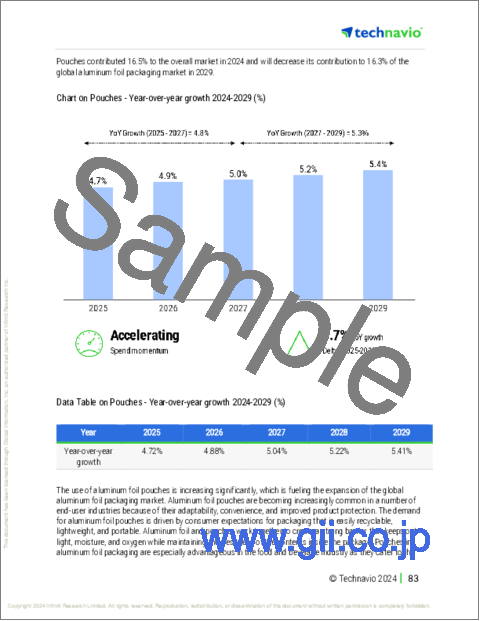
- 8.6 Pouches - Market size and forecast 2024-2029
- Chart on Pouches - Market size and forecast 2024-2029 ($ million)
- Data Table on Pouches - Market size and forecast 2024-2029 ($ million)
- Chart on Pouches - Year-over-year growth 2024-2029 (%)
- Data Table on Pouches - Year-over-year growth 2024-2029 (%)
- 8.7 Others - Market size and forecast 2024-2029
- Chart on Others - Market size and forecast 2024-2029 ($ million)
- Data Table on Others - Market size and forecast 2024-2029 ($ million)
- Chart on Others - Year-over-year growth 2024-2029 (%)
- Data Table on Others - Year-over-year growth 2024-2029 (%)
- 8.8 Market opportunity by Product
- Market opportunity by Product ($ million)
- Data Table on Market opportunity by Product ($ million)
9 Market Segmentation by Application
- 9.1 Market segments
- Chart on Application - Market share 2024-2029 (%)
- Data Table on Application - Market share 2024-2029 (%)
- 9.2 Comparison by Application
- Chart on Comparison by Application
- Data Table on Comparison by Application
- 9.3 Food and beverage packaging - Market size and forecast 2024-2029
- Chart on Food and beverage packaging - Market size and forecast 2024-2029 ($ million)
- Data Table on Food and beverage packaging - Market size and forecast 2024-2029 ($ million)
- Chart on Food and beverage packaging - Year-over-year growth 2024-2029 (%)
- Data Table on Food and beverage packaging - Year-over-year growth 2024-2029 (%)
- 9.4 Consumer packaging - Market size and forecast 2024-2029
- Chart on Consumer packaging - Market size and forecast 2024-2029 ($ million)
- Data Table on Consumer packaging - Market size and forecast 2024-2029 ($ million)
- Chart on Consumer packaging - Year-over-year growth 2024-2029 (%)
- Data Table on Consumer packaging - Year-over-year growth 2024-2029 (%)
- 9.5 Pharmaceutical packaging - Market size and forecast 2024-2029
- Chart on Pharmaceutical packaging - Market size and forecast 2024-2029 ($ million)
- Data Table on Pharmaceutical packaging - Market size and forecast 2024-2029 ($ million)
- Chart on Pharmaceutical packaging - Year-over-year growth 2024-2029 (%)
- Data Table on Pharmaceutical packaging - Year-over-year growth 2024-2029 (%)
- 9.6 Others - Market size and forecast 2024-2029
- Chart on Others - Market size and forecast 2024-2029 ($ million)
- Data Table on Others - Market size and forecast 2024-2029 ($ million)
- Chart on Others - Year-over-year growth 2024-2029 (%)
- Data Table on Others - Year-over-year growth 2024-2029 (%)
- 9.7 Market opportunity by Application
- Market opportunity by Application ($ million)
- Data Table on Market opportunity by Application ($ million)
10 Market Segmentation by Type of Packaging
- 10.1 Market segments
- Chart on Type of Packaging - Market share 2024-2029 (%)
- Data Table on Type of Packaging - Market share 2024-2029 (%)
- 10.2 Comparison by Type of Packaging
- Chart on Comparison by Type of Packaging
- Data Table on Comparison by Type of Packaging
- 10.3 Printed foil - Market size and forecast 2024-2029
- Chart on Printed foil - Market size and forecast 2024-2029 ($ million)
- Data Table on Printed foil - Market size and forecast 2024-2029 ($ million)
- Chart on Printed foil - Year-over-year growth 2024-2029 (%)
- Data Table on Printed foil - Year-over-year growth 2024-2029 (%)
- 10.4 Unprinted foil - Market size and forecast 2024-2029
- Chart on Unprinted foil - Market size and forecast 2024-2029 ($ million)
- Data Table on Unprinted foil - Market size and forecast 2024-2029 ($ million)
- Chart on Unprinted foil - Year-over-year growth 2024-2029 (%)
- Data Table on Unprinted foil - Year-over-year growth 2024-2029 (%)
- 10.5 Market opportunity by Type of Packaging
- Market opportunity by Type of Packaging ($ million)
- Data Table on Market opportunity by Type of Packaging ($ million)
11 Market Segmentation by Variant
- 11.1 Market segments
- Chart on Variant - Market share 2024-2029 (%)
- Data Table on Variant - Market share 2024-2029 (%)
- 11.2 Comparison by Variant
- Chart on Comparison by Variant
- Data Table on Comparison by Variant
- 11.3 Above 18 microns - Market size and forecast 2024-2029
- Chart on Above 18 microns - Market size and forecast 2024-2029 ($ million)
- Data Table on Above 18 microns - Market size and forecast 2024-2029 ($ million)
- Chart on Above 18 microns - Year-over-year growth 2024-2029 (%)
- Data Table on Above 18 microns - Year-over-year growth 2024-2029 (%)
- 13 - 18 microns - Market size and forecast 2024-2029
- Chart on 13 - 18 microns - Market size and forecast 2024-2029 ($ million)
- Data Table on 13 - 18 microns - Market size and forecast 2024-2029 ($ million)
- Chart on 13 - 18 microns - Year-over-year growth 2024-2029 (%)
- Data Table on 13 - 18 microns - Year-over-year growth 2024-2029 (%)
- 6 - 8 microns - Market size and forecast 2024-2029
- Chart on 6 - 8 microns - Market size and forecast 2024-2029 ($ million)
- Data Table on 6 - 8 microns - Market size and forecast 2024-2029 ($ million)
- Chart on 6 - 8 microns - Year-over-year growth 2024-2029 (%)
- Data Table on 6 - 8 microns - Year-over-year growth 2024-2029 (%)
- 9 - 12 microns - Market size and forecast 2024-2029
- Chart on 9 - 12 microns - Market size and forecast 2024-2029 ($ million)
- Data Table on 9 - 12 microns - Market size and forecast 2024-2029 ($ million)
- Chart on 9 - 12 microns - Year-over-year growth 2024-2029 (%)
- Data Table on 9 - 12 microns - Year-over-year growth 2024-2029 (%)
- 11.7 Market opportunity by Variant
- Market opportunity by Variant ($ million)
- Data Table on Market opportunity by Variant ($ million)
12 Customer Landscape
- 12.1 Customer landscape overview
- Analysis of price sensitivity, lifecycle, customer purchase basket, adoption rates, and purchase criteria
13 Geographic Landscape
- 13.1 Geographic segmentation
- Chart on Market share By Geographical Landscape 2024-2029 (%)
- Data Table on Market share By Geographical Landscape 2024-2029 (%)
- 13.2 Geographic comparison
- Chart on Geographic comparison
- Data Table on Geographic comparison
- 13.3 APAC - Market size and forecast 2024-2029
- Chart on APAC - Market size and forecast 2024-2029 ($ million)
- Data Table on APAC - Market size and forecast 2024-2029 ($ million)
- Chart on APAC - Year-over-year growth 2024-2029 (%)
- Data Table on APAC - Year-over-year growth 2024-2029 (%)
- 13.4 Europe - Market size and forecast 2024-2029
- Chart on Europe - Market size and forecast 2024-2029 ($ million)
- Data Table on Europe - Market size and forecast 2024-2029 ($ million)
- Chart on Europe - Year-over-year growth 2024-2029 (%)
- Data Table on Europe - Year-over-year growth 2024-2029 (%)
- 13.5 North America - Market size and forecast 2024-2029
- Chart on North America - Market size and forecast 2024-2029 ($ million)
- Data Table on North America - Market size and forecast 2024-2029 ($ million)
- Chart on North America - Year-over-year growth 2024-2029 (%)
- Data Table on North America - Year-over-year growth 2024-2029 (%)
- 13.6 South America - Market size and forecast 2024-2029
- Chart on South America - Market size and forecast 2024-2029 ($ million)
- Data Table on South America - Market size and forecast 2024-2029 ($ million)
- Chart on South America - Year-over-year growth 2024-2029 (%)
- Data Table on South America - Year-over-year growth 2024-2029 (%)
- 13.7 Middle East and Africa - Market size and forecast 2024-2029
- Chart on Middle East and Africa - Market size and forecast 2024-2029 ($ million)
- Data Table on Middle East and Africa - Market size and forecast 2024-2029 ($ million)
- Chart on Middle East and Africa - Year-over-year growth 2024-2029 (%)
- Data Table on Middle East and Africa - Year-over-year growth 2024-2029 (%)
- 13.8 China - Market size and forecast 2024-2029
- Chart on China - Market size and forecast 2024-2029 ($ million)
- Data Table on China - Market size and forecast 2024-2029 ($ million)
- Chart on China - Year-over-year growth 2024-2029 (%)
- Data Table on China - Year-over-year growth 2024-2029 (%)
- 13.9 Japan - Market size and forecast 2024-2029
- Chart on Japan - Market size and forecast 2024-2029 ($ million)
- Data Table on Japan - Market size and forecast 2024-2029 ($ million)
- Chart on Japan - Year-over-year growth 2024-2029 (%)
- Data Table on Japan - Year-over-year growth 2024-2029 (%)
- 13.10 US - Market size and forecast 2024-2029
- Chart on US - Market size and forecast 2024-2029 ($ million)
- Data Table on US - Market size and forecast 2024-2029 ($ million)
- Chart on US - Year-over-year growth 2024-2029 (%)
- Data Table on US - Year-over-year growth 2024-2029 (%)
- 13.11 India - Market size and forecast 2024-2029
- Chart on India - Market size and forecast 2024-2029 ($ million)
- Data Table on India - Market size and forecast 2024-2029 ($ million)
- Chart on India - Year-over-year growth 2024-2029 (%)
- Data Table on India - Year-over-year growth 2024-2029 (%)
- 13.12 Germany - Market size and forecast 2024-2029
- Chart on Germany - Market size and forecast 2024-2029 ($ million)
- Data Table on Germany - Market size and forecast 2024-2029 ($ million)
- Chart on Germany - Year-over-year growth 2024-2029 (%)
- Data Table on Germany - Year-over-year growth 2024-2029 (%)
- 13.13 South Korea - Market size and forecast 2024-2029
- Chart on South Korea - Market size and forecast 2024-2029 ($ million)
- Data Table on South Korea - Market size and forecast 2024-2029 ($ million)
- Chart on South Korea - Year-over-year growth 2024-2029 (%)
- Data Table on South Korea - Year-over-year growth 2024-2029 (%)
- 13.14 Australia - Market size and forecast 2024-2029
- Chart on Australia - Market size and forecast 2024-2029 ($ million)
- Data Table on Australia - Market size and forecast 2024-2029 ($ million)
- Chart on Australia - Year-over-year growth 2024-2029 (%)
- Data Table on Australia - Year-over-year growth 2024-2029 (%)
- 13.15 UK - Market size and forecast 2024-2029
- Chart on UK - Market size and forecast 2024-2029 ($ million)
- Data Table on UK - Market size and forecast 2024-2029 ($ million)
- Chart on UK - Year-over-year growth 2024-2029 (%)
- Data Table on UK - Year-over-year growth 2024-2029 (%)
- 13.16 Canada - Market size and forecast 2024-2029
- Chart on Canada - Market size and forecast 2024-2029 ($ million)
- Data Table on Canada - Market size and forecast 2024-2029 ($ million)
- Chart on Canada - Year-over-year growth 2024-2029 (%)
- Data Table on Canada - Year-over-year growth 2024-2029 (%)
- 13.17 France - Market size and forecast 2024-2029
- Chart on France - Market size and forecast 2024-2029 ($ million)
- Data Table on France - Market size and forecast 2024-2029 ($ million)
- Chart on France - Year-over-year growth 2024-2029 (%)
- Data Table on France - Year-over-year growth 2024-2029 (%)
- 13.18 Market opportunity By Geographical Landscape
- Market opportunity By Geographical Landscape ($ million)
- Data Tables on Market opportunity By Geographical Landscape ($ million)
14 Drivers, Challenges, and Opportunity/Restraints
- 14.1 Market drivers
- 14.2 Market challenges
- 14.3 Impact of drivers and challenges
- Impact of drivers and challenges in 2024 and 2029
- 14.4 Market opportunities/restraints
15 Competitive Landscape
- 15.1 Overview
- 15.2 Competitive Landscape
- Overview on criticality of inputs and factors of differentiation
- 15.3 Landscape disruption
- Overview on factors of disruption
- 15.4 Industry risks
- Impact of key risks on business
16 Competitive Analysis
- 16.1 Companies profiled
- Companies covered
- 16.2 Company ranking index
- Company ranking index
- 16.3 Market positioning of companies
- Matrix on companies position and classification
- 16.4 ACG
- ACG - Overview
- ACG - Product / Service
- ACG - Key offerings
- SWOT
- 16.5 Aikou Packaging Co. Ltd.
- Aikou Packaging Co. Ltd. - Overview
- Aikou Packaging Co. Ltd. - Product / Service
- Aikou Packaging Co. Ltd. - Key offerings
- SWOT
- 16.6 Aliberico SLU
- Aliberico SLU - Overview
- Aliberico SLU - Product / Service
- Aliberico SLU - Key offerings
- SWOT
- 16.7 Aluflexpack AG
- Aluflexpack AG - Overview
- Aluflexpack AG - Product / Service
- Aluflexpack AG - Key news
- Aluflexpack AG - Key offerings
- SWOT
- 16.8 Amcor Plc
- Amcor Plc - Overview
- Amcor Plc - Business segments
- Amcor Plc - Key news
- Amcor Plc - Key offerings
- Amcor Plc - Segment focus
- SWOT
- 16.9 China Hongqiao Group Ltd.
- China Hongqiao Group Ltd. - Overview
- China Hongqiao Group Ltd. - Product / Service
- China Hongqiao Group Ltd. - Key offerings
- SWOT
- 16.10 Constantia Flexibles Group GmbH
- Constantia Flexibles Group GmbH - Overview
- Constantia Flexibles Group GmbH - Product / Service
- Constantia Flexibles Group GmbH - Key offerings
- SWOT
- 16.11 Coppice Alupack Ltd.
- Coppice Alupack Ltd. - Overview
- Coppice Alupack Ltd. - Product / Service
- Coppice Alupack Ltd. - Key offerings
- SWOT
- 16.12 Eurofoil
- Eurofoil - Overview
- Eurofoil - Product / Service
- Eurofoil - Key offerings
- SWOT
- 16.13 Gulf Aluminium Rolling Mill BSC
- Gulf Aluminium Rolling Mill BSC - Overview
- Gulf Aluminium Rolling Mill BSC - Product / Service
- Gulf Aluminium Rolling Mill BSC - Key offerings
- SWOT
- 16.14 Hindalco Industries Ltd.
- Hindalco Industries Ltd. - Overview
- Hindalco Industries Ltd. - Business segments
- Hindalco Industries Ltd. - Key offerings
- Hindalco Industries Ltd. - Segment focus
- SWOT
- 16.15 Hulamin Ltd.
- Hulamin Ltd. - Overview
- Hulamin Ltd. - Business segments
- Hulamin Ltd. - Key offerings
- Hulamin Ltd. - Segment focus
- SWOT
- 16.16 Kibar Holding AS
- Kibar Holding AS - Overview
- Kibar Holding AS - Product / Service
- Kibar Holding AS - Key offerings
- SWOT
- 16.17 Pactiv Evergreen Inc.
- Pactiv Evergreen Inc. - Overview
- Pactiv Evergreen Inc. - Business segments
- Pactiv Evergreen Inc. - Key offerings
- Pactiv Evergreen Inc. - Segment focus
- SWOT
- 16.18 United Co. RUSAL
- United Co. RUSAL - Overview
- United Co. RUSAL - Business segments
- United Co. RUSAL - Key news
- United Co. RUSAL - Key offerings
- United Co. RUSAL - Segment focus
- SWOT
17 Appendix
- 17.1 Scope of the report
- 17.2 Inclusions and exclusions checklist
- Inclusions checklist
- Exclusions checklist
- 17.3 Currency conversion rates for US$
- Currency conversion rates for US$
- 17.4 Research methodology
- Research methodology
- 17.5 Data procurement
- Information sources
- 17.6 Data validation
- Data validation
- 17.7 Validation techniques employed for market sizing
- Validation techniques employed for market sizing
- 17.8 Data synthesis
- Data synthesis
- 17.9 360 degree market analysis
- 360 degree market analysis
- 17.10 List of abbreviations
- List of abbreviations

