|
|
市場調査レポート
商品コード
1681279
メンズ下着の世界市場、2025-2029年Global Mens Underwear Market 2025-2029 |
||||||

|
|||||||
カスタマイズ可能
|
|||||||


| メンズ下着の世界市場、2025-2029年 |
|
出版日: 2025年03月01日
発行: TechNavio
ページ情報: 英文 232 Pages
納期: 即納可能
|

全表示
- 概要
- 目次
メンズ下着市場は2024-2029年に130億米ドル、予測期間中のCAGRは5.7%で成長すると予測されます。
当レポートでは、メンズ下着市場の全体的な分析、市場規模・予測、動向、成長促進要因、課題、約25のベンダーを網羅したベンダー分析などを掲載しています。
現在の市場シナリオ、最新動向と促進要因、市場環境全体に関する最新分析を提供しています。市場は、健康と衛生に関する意識の高まり、綿ベースの下着需要の増加、男性用インナーウェアの自然で良質なものを使用する傾向の高まりによって牽引されています。
| 市場範囲 | |
|---|---|
| 基準年 | 2025 |
| 終了年 | 2029 |
| 予測期間 | 2025-2029 |
| 成長モメンタム | 加速 |
| 前年比2025年 | 5.2% |
| CAGR | 5.7% |
| 増分額 | 130億米ドル |
本調査は、業界の主要参加者からのインプットを含め、一次情報と二次情報を客観的に組み合わせて実施しました。本レポートには、主要企業の分析に加え、包括的な市場規模データ、地域分析によるセグメント、ベンダー情勢が含まれています。レポートには過去データと予測データがあります。
本調査では、今後数年間のメンズ下着市場の成長を促進する主な要因の一つとして、市場ベンダーによる投資や製品投入の増加を挙げています。また、メンズ下着を製造する新規ベンダーの参入や、快適性やフィット感に関する意識の高まりは、市場の大きな需要につながるでしょう。
目次
第1章 エグゼクティブサマリー
- 市場概要
第2章 Technavio分析
- 価格・ライフサイクル・顧客購入バスケット・採用率・購入基準の分析
- インプットの重要性と差別化の要因
- 混乱の要因
- 促進要因と課題の影響
第3章 市場情勢
- 市場エコシステム
- 市場の特徴
- バリューチェーン分析
第4章 市場規模
- 市場の定義
- 市場セグメント分析
- 市場規模 2024
- 市場の見通し 2024-2029
第5章 市場規模実績
- メンズ下着の世界市場 2019-2023
- タイプセグメント分析 2019-2023
- 材料セグメント分析 2019-2023
- 流通チャネルセグメント分析 2019-2023
- 年齢層セグメント分析 2019-2023
- 地域別セグメント分析 2019-2023
- 国別セグメント分析 2019-2023
第6章 定性分析
- AIの影響:メンズ下着の世界市場
第7章 ファイブフォース分析
- ファイブフォースの要約
- 買い手の交渉力
- 供給企業の交渉力
- 新規参入業者の脅威
- 代替品の脅威
- 競争の脅威
- 市況
第8章 市場セグメンテーション:タイプ別
- 市場セグメント
- 比較:タイプ別
- ボクサーブリーフ:市場規模と予測 2024-2029
- ブリーフ:市場規模と予測 2024-2029
- トランクス:市場規模と予測 2024-2029
- ボクサー:市場規模と予測 2024-2029
- その他:市場規模と予測 2024-2029
- 市場機会:タイプ別
第9章 市場セグメンテーション:素材別
- 市場セグメント
- 比較:素材別
- コットン:市場規模と予測 2024-2029
- ポリエステル:市場規模と予測 2024-2029
- モーダル:市場規模と予測 2024-2029
- ナイロン:市場規模と予測 2024-2029
- その他:市場規模と予測 2024-2029
- 市場機会:素材別
第10章 市場セグメンテーション:流通チャネル別
- 市場セグメント
- 比較:流通チャネル別
- オフライン:市場規模と予測 2024-2029
- オンライン:市場規模と予測 2024-2029
- 市場機会:流通チャネル別
第11章 市場セグメンテーション:年齢層別
- 市場セグメント
- 比較:年齢層別
- 26-35歳:市場規模と予測 2024-2029
- 36-45歳:市場規模と予測 2024-2029
- 15-25歳:市場規模と予測 2024-2029
- 45歳以上:市場規模と予測 2024-2029
- 市場機会:年齢層別
第12章 顧客情勢
- 顧客情勢の概要
第13章 地域別情勢
- 地域別セグメンテーション
- 地域別比較
- アジア太平洋:市場規模と予測 2024-2029
- 北米:市場規模と予測 2024-2029
- 欧州:市場規模と予測 2024-2029
- 中東・アフリカ:市場規模と予測 2024-2029
- 南米:市場規模と予測 2024-2029
- 米国:市場規模と予測 2024-2029
- インド:市場規模と予測 2024-2029
- 中国:市場規模と予測 2024-2029
- 日本:市場規模と予測 2024-2029
- 韓国:市場規模と予測 2024-2029
- 英国:市場規模と予測 2024-2029
- カナダ:市場規模と予測 2024-2029
- オーストラリア:市場規模と予測 2024-2029
- ドイツ:市場規模と予測 2024-2029
- メキシコ:市場規模と予測 2024-2029
- 市場機会:地域情勢別
第14章 促進要因・課題・機会・抑制要因
- 市場促進要因
- 市場の課題
- 促進要因と課題の影響
- 市場の機会・抑制要因
第15章 競合情勢
- 概要
- 競合情勢
- 混乱の状況
- 業界のリスク
第16章 競合分析
- 企業プロファイル
- 企業ランキング指数
- 企業の市場ポジショニング
- American Eagle Outfitters Inc.
- Duluth Holdings Inc.
- Hanesbrands Inc.
- Huber Holding AG
- Iconix International
- Jockey International Inc.
- Levi Strauss and Co.
- Newell Brands Inc.
- Penney IP LLC
- Perry Ellis International Inc.
- PVH Corp.
- Ralph Lauren Corp.
- RibbedTee
- Under Armour Inc.
- UNIQLO Co. Ltd.
第17章 付録
The mens underwear market is forecasted to grow by USD 13.00 billion during 2024-2029, accelerating at a CAGR of 5.7% during the forecast period. The report on the mens underwear market provides a holistic analysis, market size and forecast, trends, growth drivers, and challenges, as well as vendor analysis covering around 25 vendors.
The report offers an up-to-date analysis regarding the current market scenario, the latest trends and drivers, and the overall market environment. The market is driven by rising consciousness regarding health and hygiene, rise in demand for cotton-based underwear, and increasing tendency of using natural and good quality innerwear for men.
| Market Scope | |
|---|---|
| Base Year | 2025 |
| End Year | 2029 |
| Series Year | 2025-2029 |
| Growth Momentum | Accelerate |
| YOY 2025 | 5.2% |
| CAGR | 5.7% |
| Incremental Value | $13.00 bn |
The study was conducted using an objective combination of primary and secondary information including inputs from key participants in the industry. The report contains a comprehensive market size data, segment with regional analysis and vendor landscape in addition to an analysis of the key companies. Reports have historic and forecast data.
Technavio's mens underwear market is segmented as below:
By Type
- Boxer brief
- Briefs
- Trunks
- Boxers
- Others
By Material
- Cotton
- Polyester
- Modal
- Nylon
- Others
By Distribution Channel
- Offline
- Online
By Age Group
- 26-35 year
- 36-45 year
- 15-25 year
- Above 45
By Geographical Landscape
- APAC
- North America
- Europe
- Middle East and Africa
- South America
This study identifies the growing investments and product launches by market vendors as one of the prime reasons driving the mens underwear market growth during the next few years. Also, introduction of new vendors producing mens underwear and rising awareness regarding comfort and fit will lead to sizable demand in the market.
The report on the mens underwear market covers the following areas:
- Mens Underwear Market sizing
- Mens Underwear Market forecast
- Mens Underwear Market industry analysis
The robust vendor analysis is designed to help clients improve their market position, and in line with this, this report provides a detailed analysis of several leading mens underwear market vendors that include American Eagle Outfitters Inc., Derek Rose Ltd., Dolce and Gabbana Srl, Duluth Holdings Inc., Farfetch Ltd., Hanesbrands Inc., Huber Holding AG, Hugo Boss AG, Iconix International, Jockey International Inc., Levi Strauss and Co., Newell Brands Inc., OTB Spa, Penney IP LLC, Perry Ellis International Inc., PVH Corp., Ralph Lauren Corp., RibbedTee, Under Armour Inc., and UNIQLO Co. Ltd.. Also, the mens underwear market analysis report includes information on upcoming trends and challenges that will influence market growth. This is to help companies strategize and leverage all forthcoming growth opportunities.
The publisher presents a detailed picture of the market by the way of study, synthesis, and summation of data from multiple sources by an analysis of key parameters such as profit, pricing, competition, and promotions. It presents various market facets by identifying the key industry influencers. The data presented is comprehensive, reliable, and a result of extensive primary and secondary research. The market research reports provide a complete competitive landscape and an in-depth vendor selection methodology and analysis using qualitative and quantitative research to forecast accurate market growth.
Table of Contents
1 Executive Summary
- 1.1 Market overview
- Executive Summary - Chart on Market Overview
- Executive Summary - Data Table on Market Overview
- Executive Summary - Chart on Global Market Characteristics
- Executive Summary - Chart on Market By Geographical Landscape
- Executive Summary - Chart on Market Segmentation by Type
- Executive Summary - Chart on Market Segmentation by Material
- Executive Summary - Chart on Market Segmentation by Distribution Channel
- Executive Summary - Chart on Market Segmentation by Age Group
- Executive Summary - Chart on Incremental Growth
- Executive Summary - Data Table on Incremental Growth
- Executive Summary - Chart on Company Market Positioning
2 Technavio Analysis
- 2.1 Analysis of price sensitivity, lifecycle, customer purchase basket, adoption rates, and purchase criteria
- Analysis of price sensitivity, lifecycle, customer purchase basket, adoption rates, and purchase criteria
- 2.2 Criticality of inputs and Factors of differentiation
- Overview on criticality of inputs and factors of differentiation
- 2.3 Factors of disruption
- Overview on factors of disruption
- 2.4 Impact of drivers and challenges
- Impact of drivers and challenges in 2024 and 2029
3 Market Landscape
- 3.1 Market ecosystem
- Parent Market
- Data Table on - Parent Market
- 3.2 Market characteristics
- Market characteristics analysis
- 3.3 Value chain analysis
- Value chain analysis
4 Market Sizing
- 4.1 Market definition
- Offerings of companies included in the market definition
- 4.2 Market segment analysis
- Market segments
- 4.3 Market size 2024
- 4.4 Market outlook: Forecast for 2024-2029
- Chart on Global - Market size and forecast 2024-2029 ($ billion)
- Data Table on Global - Market size and forecast 2024-2029 ($ billion)
- Chart on Global Market: Year-over-year growth 2024-2029 (%)
- Data Table on Global Market: Year-over-year growth 2024-2029 (%)
5 Historic Market Size
- 5.1 Global Mens Underwear Market 2019 - 2023
- Historic Market Size - Data Table on Global Mens Underwear Market 2019 - 2023 ($ billion)
- 5.2 Type segment analysis 2019 - 2023
- Historic Market Size - Type Segment 2019 - 2023 ($ billion)
- 5.3 Material segment analysis 2019 - 2023
- Historic Market Size - Material Segment 2019 - 2023 ($ billion)
- 5.4 Distribution Channel segment analysis 2019 - 2023
- Historic Market Size - Distribution Channel Segment 2019 - 2023 ($ billion)
- 5.5 Age Group segment analysis 2019 - 2023
- Historic Market Size - Age Group Segment 2019 - 2023 ($ billion)
- 5.6 Geography segment analysis 2019 - 2023
- Historic Market Size - Geography Segment 2019 - 2023 ($ billion)
- 5.7 Country segment analysis 2019 - 2023
- Historic Market Size - Country Segment 2019 - 2023 ($ billion)
6 Qualitative Analysis
- 6.1 Impact of AI on global mens underwear market
7 Five Forces Analysis
- 7.1 Five forces summary
- Five forces analysis - Comparison between 2024 and 2029
- 7.2 Bargaining power of buyers
- Bargaining power of buyers - Impact of key factors 2024 and 2029
- 7.3 Bargaining power of suppliers
- Bargaining power of suppliers - Impact of key factors in 2024 and 2029
- 7.4 Threat of new entrants
- Threat of new entrants - Impact of key factors in 2024 and 2029
- 7.5 Threat of substitutes
- Threat of substitutes - Impact of key factors in 2024 and 2029
- 7.6 Threat of rivalry
- Threat of rivalry - Impact of key factors in 2024 and 2029
- 7.7 Market condition
- Chart on Market condition - Five forces 2024 and 2029
8 Market Segmentation by Type
- 8.1 Market segments
- Chart on Type - Market share 2024-2029 (%)
- Data Table on Type - Market share 2024-2029 (%)
- 8.2 Comparison by Type
- Chart on Comparison by Type
- Data Table on Comparison by Type
- 8.3 Boxer brief - Market size and forecast 2024-2029
- Chart on Boxer brief - Market size and forecast 2024-2029 ($ billion)
- Data Table on Boxer brief - Market size and forecast 2024-2029 ($ billion)
- Chart on Boxer brief - Year-over-year growth 2024-2029 (%)
- Data Table on Boxer brief - Year-over-year growth 2024-2029 (%)
- 8.4 Briefs - Market size and forecast 2024-2029
- Chart on Briefs - Market size and forecast 2024-2029 ($ billion)
- Data Table on Briefs - Market size and forecast 2024-2029 ($ billion)
- Chart on Briefs - Year-over-year growth 2024-2029 (%)
- Data Table on Briefs - Year-over-year growth 2024-2029 (%)
- 8.5 Trunks - Market size and forecast 2024-2029
- Chart on Trunks - Market size and forecast 2024-2029 ($ billion)
- Data Table on Trunks - Market size and forecast 2024-2029 ($ billion)
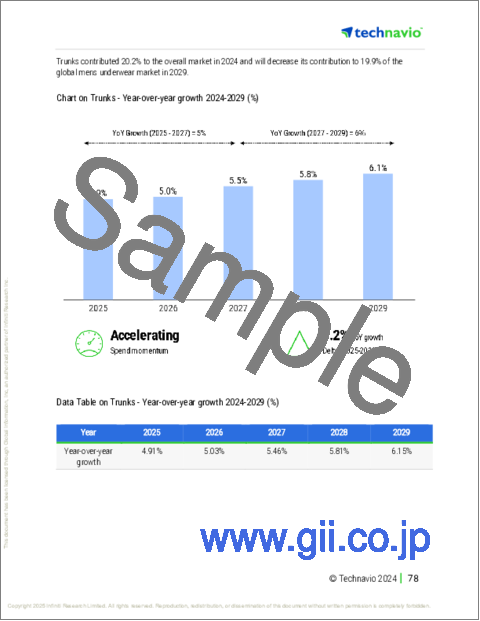
- Chart on Trunks - Year-over-year growth 2024-2029 (%)
- Data Table on Trunks - Year-over-year growth 2024-2029 (%)
- 8.6 Boxers - Market size and forecast 2024-2029
- Chart on Boxers - Market size and forecast 2024-2029 ($ billion)
- Data Table on Boxers - Market size and forecast 2024-2029 ($ billion)
- Chart on Boxers - Year-over-year growth 2024-2029 (%)
- Data Table on Boxers - Year-over-year growth 2024-2029 (%)
- 8.7 Others - Market size and forecast 2024-2029
- Chart on Others - Market size and forecast 2024-2029 ($ billion)
- Data Table on Others - Market size and forecast 2024-2029 ($ billion)
- Chart on Others - Year-over-year growth 2024-2029 (%)
- Data Table on Others - Year-over-year growth 2024-2029 (%)
- 8.8 Market opportunity by Type
- Market opportunity by Type ($ billion)
- Data Table on Market opportunity by Type ($ billion)
9 Market Segmentation by Material
- 9.1 Market segments
- Chart on Material - Market share 2024-2029 (%)
- Data Table on Material - Market share 2024-2029 (%)
- 9.2 Comparison by Material
- Chart on Comparison by Material
- Data Table on Comparison by Material
- 9.3 Cotton - Market size and forecast 2024-2029
- Chart on Cotton - Market size and forecast 2024-2029 ($ billion)
- Data Table on Cotton - Market size and forecast 2024-2029 ($ billion)
- Chart on Cotton - Year-over-year growth 2024-2029 (%)
- Data Table on Cotton - Year-over-year growth 2024-2029 (%)
- 9.4 Polyester - Market size and forecast 2024-2029
- Chart on Polyester - Market size and forecast 2024-2029 ($ billion)
- Data Table on Polyester - Market size and forecast 2024-2029 ($ billion)
- Chart on Polyester - Year-over-year growth 2024-2029 (%)
- Data Table on Polyester - Year-over-year growth 2024-2029 (%)
- 9.5 Modal - Market size and forecast 2024-2029
- Chart on Modal - Market size and forecast 2024-2029 ($ billion)
- Data Table on Modal - Market size and forecast 2024-2029 ($ billion)
- Chart on Modal - Year-over-year growth 2024-2029 (%)
- Data Table on Modal - Year-over-year growth 2024-2029 (%)
- 9.6 Nylon - Market size and forecast 2024-2029
- Chart on Nylon - Market size and forecast 2024-2029 ($ billion)
- Data Table on Nylon - Market size and forecast 2024-2029 ($ billion)
- Chart on Nylon - Year-over-year growth 2024-2029 (%)
- Data Table on Nylon - Year-over-year growth 2024-2029 (%)
- 9.7 Others - Market size and forecast 2024-2029
- Chart on Others - Market size and forecast 2024-2029 ($ billion)
- Data Table on Others - Market size and forecast 2024-2029 ($ billion)
- Chart on Others - Year-over-year growth 2024-2029 (%)
- Data Table on Others - Year-over-year growth 2024-2029 (%)
- 9.8 Market opportunity by Material
- Market opportunity by Material ($ billion)
- Data Table on Market opportunity by Material ($ billion)
10 Market Segmentation by Distribution Channel
- 10.1 Market segments
- Chart on Distribution Channel - Market share 2024-2029 (%)
- Data Table on Distribution Channel - Market share 2024-2029 (%)
- 10.2 Comparison by Distribution Channel
- Chart on Comparison by Distribution Channel
- Data Table on Comparison by Distribution Channel
- 10.3 Offline - Market size and forecast 2024-2029
- Chart on Offline - Market size and forecast 2024-2029 ($ billion)
- Data Table on Offline - Market size and forecast 2024-2029 ($ billion)
- Chart on Offline - Year-over-year growth 2024-2029 (%)
- Data Table on Offline - Year-over-year growth 2024-2029 (%)
- 10.4 Online - Market size and forecast 2024-2029
- Chart on Online - Market size and forecast 2024-2029 ($ billion)
- Data Table on Online - Market size and forecast 2024-2029 ($ billion)
- Chart on Online - Year-over-year growth 2024-2029 (%)
- Data Table on Online - Year-over-year growth 2024-2029 (%)
- 10.5 Market opportunity by Distribution Channel
- Market opportunity by Distribution Channel ($ billion)
- Data Table on Market opportunity by Distribution Channel ($ billion)
11 Market Segmentation by Age Group
- 11.1 Market segments
- Chart on Age Group - Market share 2024-2029 (%)
- Data Table on Age Group - Market share 2024-2029 (%)
- 11.2 Comparison by Age Group
- Chart on Comparison by Age Group
- Data Table on Comparison by Age Group
- 11.3 26-35 year - Market size and forecast 2024-2029
- Chart on 26-35 year - Market size and forecast 2024-2029 ($ billion)
- Data Table on 26-35 year - Market size and forecast 2024-2029 ($ billion)
- Chart on 26-35 year - Year-over-year growth 2024-2029 (%)
- Data Table on 26-35 year - Year-over-year growth 2024-2029 (%)
- 11.4 36-45 year - Market size and forecast 2024-2029
- Chart on 36-45 year - Market size and forecast 2024-2029 ($ billion)
- Data Table on 36-45 year - Market size and forecast 2024-2029 ($ billion)
- Chart on 36-45 year - Year-over-year growth 2024-2029 (%)
- Data Table on 36-45 year - Year-over-year growth 2024-2029 (%)
- 11.5 15-25 year - Market size and forecast 2024-2029
- Chart on 15-25 year - Market size and forecast 2024-2029 ($ billion)
- Data Table on 15-25 year - Market size and forecast 2024-2029 ($ billion)
- Chart on 15-25 year - Year-over-year growth 2024-2029 (%)
- Data Table on 15-25 year - Year-over-year growth 2024-2029 (%)
- 11.6 Above 45 - Market size and forecast 2024-2029
- Chart on Above 45 - Market size and forecast 2024-2029 ($ billion)
- Data Table on Above 45 - Market size and forecast 2024-2029 ($ billion)
- Chart on Above 45 - Year-over-year growth 2024-2029 (%)
- Data Table on Above 45 - Year-over-year growth 2024-2029 (%)
- 11.7 Market opportunity by Age Group
- Market opportunity by Age Group ($ billion)
- Data Table on Market opportunity by Age Group ($ billion)
12 Customer Landscape
- 12.1 Customer landscape overview
- Analysis of price sensitivity, lifecycle, customer purchase basket, adoption rates, and purchase criteria
13 Geographic Landscape
- 13.1 Geographic segmentation
- Chart on Market share By Geographical Landscape 2024-2029 (%)
- Data Table on Market share By Geographical Landscape 2024-2029 (%)
- 13.2 Geographic comparison
- Chart on Geographic comparison
- Data Table on Geographic comparison
- 13.3 APAC - Market size and forecast 2024-2029
- Chart on APAC - Market size and forecast 2024-2029 ($ billion)
- Data Table on APAC - Market size and forecast 2024-2029 ($ billion)
- Chart on APAC - Year-over-year growth 2024-2029 (%)
- Data Table on APAC - Year-over-year growth 2024-2029 (%)
- 13.4 North America - Market size and forecast 2024-2029
- Chart on North America - Market size and forecast 2024-2029 ($ billion)
- Data Table on North America - Market size and forecast 2024-2029 ($ billion)
- Chart on North America - Year-over-year growth 2024-2029 (%)
- Data Table on North America - Year-over-year growth 2024-2029 (%)
- 13.5 Europe - Market size and forecast 2024-2029
- Chart on Europe - Market size and forecast 2024-2029 ($ billion)
- Data Table on Europe - Market size and forecast 2024-2029 ($ billion)
- Chart on Europe - Year-over-year growth 2024-2029 (%)
- Data Table on Europe - Year-over-year growth 2024-2029 (%)
- 13.6 Middle East and Africa - Market size and forecast 2024-2029
- Chart on Middle East and Africa - Market size and forecast 2024-2029 ($ billion)
- Data Table on Middle East and Africa - Market size and forecast 2024-2029 ($ billion)
- Chart on Middle East and Africa - Year-over-year growth 2024-2029 (%)
- Data Table on Middle East and Africa - Year-over-year growth 2024-2029 (%)
- 13.7 South America - Market size and forecast 2024-2029
- Chart on South America - Market size and forecast 2024-2029 ($ billion)
- Data Table on South America - Market size and forecast 2024-2029 ($ billion)
- Chart on South America - Year-over-year growth 2024-2029 (%)
- Data Table on South America - Year-over-year growth 2024-2029 (%)
- 13.8 US - Market size and forecast 2024-2029
- Chart on US - Market size and forecast 2024-2029 ($ billion)
- Data Table on US - Market size and forecast 2024-2029 ($ billion)
- Chart on US - Year-over-year growth 2024-2029 (%)
- Data Table on US - Year-over-year growth 2024-2029 (%)
- 13.9 India - Market size and forecast 2024-2029
- Chart on India - Market size and forecast 2024-2029 ($ billion)
- Data Table on India - Market size and forecast 2024-2029 ($ billion)
- Chart on India - Year-over-year growth 2024-2029 (%)
- Data Table on India - Year-over-year growth 2024-2029 (%)
- 13.10 China - Market size and forecast 2024-2029
- Chart on China - Market size and forecast 2024-2029 ($ billion)
- Data Table on China - Market size and forecast 2024-2029 ($ billion)
- Chart on China - Year-over-year growth 2024-2029 (%)
- Data Table on China - Year-over-year growth 2024-2029 (%)
- 13.11 Japan - Market size and forecast 2024-2029
- Chart on Japan - Market size and forecast 2024-2029 ($ billion)
- Data Table on Japan - Market size and forecast 2024-2029 ($ billion)
- Chart on Japan - Year-over-year growth 2024-2029 (%)
- Data Table on Japan - Year-over-year growth 2024-2029 (%)
- 13.12 South Korea - Market size and forecast 2024-2029
- Chart on South Korea - Market size and forecast 2024-2029 ($ billion)
- Data Table on South Korea - Market size and forecast 2024-2029 ($ billion)
- Chart on South Korea - Year-over-year growth 2024-2029 (%)
- Data Table on South Korea - Year-over-year growth 2024-2029 (%)
- 13.13 UK - Market size and forecast 2024-2029
- Chart on UK - Market size and forecast 2024-2029 ($ billion)
- Data Table on UK - Market size and forecast 2024-2029 ($ billion)
- Chart on UK - Year-over-year growth 2024-2029 (%)
- Data Table on UK - Year-over-year growth 2024-2029 (%)
- 13.14 Canada - Market size and forecast 2024-2029
- Chart on Canada - Market size and forecast 2024-2029 ($ billion)
- Data Table on Canada - Market size and forecast 2024-2029 ($ billion)
- Chart on Canada - Year-over-year growth 2024-2029 (%)
- Data Table on Canada - Year-over-year growth 2024-2029 (%)
- 13.15 Australia - Market size and forecast 2024-2029
- Chart on Australia - Market size and forecast 2024-2029 ($ billion)
- Data Table on Australia - Market size and forecast 2024-2029 ($ billion)
- Chart on Australia - Year-over-year growth 2024-2029 (%)
- Data Table on Australia - Year-over-year growth 2024-2029 (%)
- 13.16 Germany - Market size and forecast 2024-2029
- Chart on Germany - Market size and forecast 2024-2029 ($ billion)
- Data Table on Germany - Market size and forecast 2024-2029 ($ billion)
- Chart on Germany - Year-over-year growth 2024-2029 (%)
- Data Table on Germany - Year-over-year growth 2024-2029 (%)
- 13.17 Mexico - Market size and forecast 2024-2029
- Chart on Mexico - Market size and forecast 2024-2029 ($ billion)
- Data Table on Mexico - Market size and forecast 2024-2029 ($ billion)
- Chart on Mexico - Year-over-year growth 2024-2029 (%)
- Data Table on Mexico - Year-over-year growth 2024-2029 (%)
- 13.18 Market opportunity By Geographical Landscape
- Market opportunity By Geographical Landscape ($ billion)
- Data Tables on Market opportunity By Geographical Landscape ($ billion)
14 Drivers, Challenges, and Opportunity/Restraints
- 14.1 Market drivers
- 14.2 Market challenges
- 14.3 Impact of drivers and challenges
- Impact of drivers and challenges in 2024 and 2029
- 14.4 Market opportunities/restraints
15 Competitive Landscape
- 15.1 Overview
- 15.2 Competitive Landscape
- Overview on criticality of inputs and factors of differentiation
- 15.3 Landscape disruption
- Overview on factors of disruption
- 15.4 Industry risks
- Impact of key risks on business
16 Competitive Analysis
- 16.1 Companies profiled
- Companies covered
- 16.2 Company ranking index
- Company ranking index
- 16.3 Market positioning of companies
- Matrix on companies position and classification
- 16.4 American Eagle Outfitters Inc.
- American Eagle Outfitters Inc. - Overview
- American Eagle Outfitters Inc. - Business segments
- American Eagle Outfitters Inc. - Key offerings
- American Eagle Outfitters Inc. - Segment focus
- SWOT
- 16.5 Duluth Holdings Inc.
- Duluth Holdings Inc. - Overview
- Duluth Holdings Inc. - Product / Service
- Duluth Holdings Inc. - Key offerings
- SWOT
- 16.6 Hanesbrands Inc.
- Hanesbrands Inc. - Overview
- Hanesbrands Inc. - Business segments
- Hanesbrands Inc. - Key news
- Hanesbrands Inc. - Key offerings
- Hanesbrands Inc. - Segment focus
- SWOT
- 16.7 Huber Holding AG
- Huber Holding AG - Overview
- Huber Holding AG - Product / Service
- Huber Holding AG - Key offerings
- SWOT
- 16.8 Iconix International
- Iconix International - Overview
- Iconix International - Product / Service
- Iconix International - Key offerings
- SWOT
- 16.9 Jockey International Inc.
- Jockey International Inc. - Overview
- Jockey International Inc. - Product / Service
- Jockey International Inc. - Key offerings
- SWOT
- 16.10 Levi Strauss and Co.
- Levi Strauss and Co. - Overview
- Levi Strauss and Co. - Business segments
- Levi Strauss and Co. - Key news
- Levi Strauss and Co. - Key offerings
- Levi Strauss and Co. - Segment focus
- SWOT
- 16.11 Newell Brands Inc.
- Newell Brands Inc. - Overview
- Newell Brands Inc. - Business segments
- Newell Brands Inc. - Key news
- Newell Brands Inc. - Key offerings
- Newell Brands Inc. - Segment focus
- SWOT
- 16.12 Penney IP LLC
- Penney IP LLC - Overview
- Penney IP LLC - Product / Service
- Penney IP LLC - Key offerings
- SWOT
- 16.13 Perry Ellis International Inc.
- Perry Ellis International Inc. - Overview
- Perry Ellis International Inc. - Product / Service
- Perry Ellis International Inc. - Key offerings
- SWOT
- 16.14 PVH Corp.
- PVH Corp. - Overview
- PVH Corp. - Business segments
- PVH Corp. - Key offerings
- PVH Corp. - Segment focus
- SWOT
- 16.15 Ralph Lauren Corp.
- Ralph Lauren Corp. - Overview
- Ralph Lauren Corp. - Business segments
- Ralph Lauren Corp. - Key news
- Ralph Lauren Corp. - Key offerings
- Ralph Lauren Corp. - Segment focus
- SWOT
- 16.16 RibbedTee
- RibbedTee - Overview
- RibbedTee - Product / Service
- RibbedTee - Key offerings
- SWOT
- 16.17 Under Armour Inc.
- Under Armour Inc. - Overview
- Under Armour Inc. - Business segments
- Under Armour Inc. - Key news
- Under Armour Inc. - Key offerings
- Under Armour Inc. - Segment focus
- SWOT
- 16.18 UNIQLO Co. Ltd.
- UNIQLO Co. Ltd. - Overview
- UNIQLO Co. Ltd. - Product / Service
- UNIQLO Co. Ltd. - Key offerings
- SWOT
17 Appendix
- 17.1 Scope of the report
- 17.2 Inclusions and exclusions checklist
- Inclusions checklist
- Exclusions checklist
- 17.3 Currency conversion rates for US$
- Currency conversion rates for US$
- 17.4 Research methodology
- Research methodology
- 17.5 Data procurement
- Information sources
- 17.6 Data validation
- Data validation
- 17.7 Validation techniques employed for market sizing
- Validation techniques employed for market sizing
- 17.8 Data synthesis
- Data synthesis
- 17.9 360 degree market analysis
- 360 degree market analysis
- 17.10 List of abbreviations
- List of abbreviations
