|
|
市場調査レポート
商品コード
1626447
オンライン治療サービスの世界市場、2025~2029年Global Online Therapy Services Market 2025-2029 |
||||||

|
|||||||
カスタマイズ可能
|
|||||||

| オンライン治療サービスの世界市場、2025~2029年 |
|
出版日: 2024年12月20日
発行: TechNavio
ページ情報: 英文 193 Pages
納期: 即納可能
|

全表示
- 概要
- 図表
- 目次
オンライン治療サービス市場、2025~2029年
オンライン治療サービス市場は2024~2029年に640億8,590万米ドル、予測期間中のCAGRは53.9%で成長すると予測されます。当レポートでは、オンライン治療サービス市場の全体的な分析、市場規模・予測、動向、成長促進要因、課題、約25のベンダーを網羅したベンダー分析などを掲載しています。
現在の市場シナリオ、最新動向と促進要因、市場環境全体に関する最新分析を提供しています。市場は、スマートフォンの急速な普及とオンラインサービスへの嗜好の高まり、市場ベンダーによる戦略的イニシアティブ、メンタルヘルス疾患の有病率の上昇などが牽引しています。
| 市場範囲 | |
|---|---|
| 基準年 | 2025年 |
| 終了年 | 2029年 |
| 予測期間 | 2025~2029年 |
| 成長モメンタム | 加速 |
| 前年比[2025年] | 32.3% |
| CAGR | 53.9% |
| 増分額 | 640億8,590万米ドル |
本調査では、今後数年間のオンライン治療サービス市場の成長を促進する主要要因の1つとして、オンライン健康サービスの人気の高まりを挙げています。また、オンライン治療サービスを支援する政府のイニシアチブの高まりや、メンタルヘルスに関する広告やマーケティングキャンペーンの増加が、市場の大きな需要につながります。
目次
第1章 エグゼクティブサマリー
- 市場概要
第2章 Technavio分析
- 価格・ライフサイクル・顧客購入バスケット・採用率・購入基準の分析
- インプットの重要性と差別化の要因
- 混乱の要因
- 促進要因と課題の影響
第3章 市場情勢
- 市場エコシステム
- 市場の特徴
- バリューチェーン分析
第4章 市場規模
- 市場の定義
- 市場セグメント分析
- 市場規模 2024年
- 市場の展望 2024~2029年
第5章 市場規模実績
- オンライン治療サービスの世界市場 2019~2023年
- タイプ別セグメント分析 2019~2023年
- 用途別セグメント分析 2019~2023年
- 地域別セグメント分析 2019~2023年
- 国別セグメント分析 2019~2023年
第6章 定性分析
- AIの影響:オンライン治療サービスの世界市場
第7章 ファイブフォース分析
- ファイブフォースの要約
- 買い手の交渉力
- 供給企業の交渉力
- 新規参入業者の脅威
- 代替品の脅威
- 競争の脅威
- 市況
第8章 市場セグメンテーション:タイプ別
- 市場セグメント
- 比較:タイプ別
- 認知行動療法:市場規模と予測 2024~2029年
- 精神力動的療法:市場規模と予測 2024~2029年
- 個人中心療法:市場規模と予測 2024~2029年
- 市場機会:タイプ別
第9章 市場セグメンテーション:用途別
- 市場セグメント
- 比較:用途別
- 住宅用:市場規模と予測 2024~2029年
- 商業用:市場規模と予測 2024~2029年
- 市場機会:用途別
第10章 顧客情勢
- 顧客情勢概要
第11章 地域別情勢
- 地域別セグメンテーション
- 比較:地域別
- 北米:市場規模と予測 2024~2029年
- 欧州:市場規模と予測 2024~2029年
- アジア:市場規模と予測 2024~2029年
- その他:市場規模と予測 2024~2029年
- 米国:市場規模と予測 2024~2029年
- 英国:市場規模と予測 2024~2029年
- ドイツ:市場規模と予測 2024~2029年
- 中国:市場規模と予測 2024~2029年
- インド:市場規模と予測 2024~2029年
- カナダ:市場規模と予測 2024~2029年
- フランス:市場規模と予測 2024~2029年
- 日本:市場規模と予測 2024~2029年
- 韓国:市場規模と予測 2024~2029年
- イタリア:市場規模と予測 2024~2029年
- 地域情勢による市場機会
第12章 促進要因・課題・機会・抑制要因
- 市場促進要因
- 市場課題
- 促進要因と課題の影響
- 市場機会・抑制要因
第13章 競合情勢
- 概要
- 競合情勢
- 混乱の状況
- 産業のリスク
第14章 競合分析
- 企業プロファイル
- 企業ランキング指数
- 企業の市場ポジショニング
- American Well Corp.
- BreakThrough Counseling Services
- Calmerry
- Cerebral Inc.
- Doctor On Demand Inc.
- HopeQure Wellness Solutions Pvt. Ltd.
- Manastha
- MDLIVE Inc.
- Mental Fuel Inc.
- ReGain
- TALKSPACE INC.
- Teladoc Health Inc.
- ThriveTalk
- Thriveworks Counseling
第15章 付録
Exhibits:
- Exhibits1: Executive Summary - Chart on Market Overview
- Exhibits2: Executive Summary - Data Table on Market Overview
- Exhibits3: Executive Summary - Chart on Global Market Characteristics
- Exhibits4: Executive Summary - Chart on Market By Geographical Landscape
- Exhibits5: Executive Summary - Chart on Market Segmentation by Type
- Exhibits6: Executive Summary - Chart on Market Segmentation by Application
- Exhibits7: Executive Summary - Chart on Incremental Growth
- Exhibits8: Executive Summary - Data Table on Incremental Growth
- Exhibits9: Executive Summary - Chart on Company Market Positioning
- Exhibits10: Analysis of price sensitivity, lifecycle, customer purchase basket, adoption rates, and purchase criteria
- Exhibits11: Overview on criticality of inputs and factors of differentiation
- Exhibits12: Overview on factors of disruption
- Exhibits13: Impact of drivers and challenges in 2024 and 2029
- Exhibits14: Parent Market
- Exhibits15: Data Table on - Parent Market
- Exhibits16: Market characteristics analysis
- Exhibits17: Value chain analysis
- Exhibits18: Offerings of companies included in the market definition
- Exhibits19: Market segments
- Exhibits20: Chart on Global - Market size and forecast 2024-2029 ($ million)
- Exhibits21: Data Table on Global - Market size and forecast 2024-2029 ($ million)
- Exhibits22: Chart on Global Market: Year-over-year growth 2024-2029 (%)
- Exhibits23: Data Table on Global Market: Year-over-year growth 2024-2029 (%)
- Exhibits24: Historic Market Size - Data Table on Global Online Therapy Services Market 2019 - 2023 ($ million)
- Exhibits25: Historic Market Size - Type Segment 2019 - 2023 ($ million)
- Exhibits26: Historic Market Size - Application Segment 2019 - 2023 ($ million)
- Exhibits27: Historic Market Size - Geography Segment 2019 - 2023 ($ million)
- Exhibits28: Historic Market Size - Country Segment 2019 - 2023 ($ million)
- Exhibits29: Five forces analysis - Comparison between 2024 and 2029
- Exhibits30: Bargaining power of buyers - Impact of key factors 2024 and 2029
- Exhibits31: Bargaining power of suppliers - Impact of key factors in 2024 and 2029
- Exhibits32: Threat of new entrants - Impact of key factors in 2024 and 2029
- Exhibits33: Threat of substitutes - Impact of key factors in 2024 and 2029
- Exhibits34: Threat of rivalry - Impact of key factors in 2024 and 2029
- Exhibits35: Chart on Market condition - Five forces 2024 and 2029
- Exhibits36: Chart on Type - Market share 2024-2029 (%)
- Exhibits37: Data Table on Type - Market share 2024-2029 (%)
- Exhibits38: Chart on Comparison by Type
- Exhibits39: Data Table on Comparison by Type
- Exhibits40: Chart on Cognitive behavioral therapy - Market size and forecast 2024-2029 ($ million)
- Exhibits41: Data Table on Cognitive behavioral therapy - Market size and forecast 2024-2029 ($ million)
- Exhibits42: Chart on Cognitive behavioral therapy - Year-over-year growth 2024-2029 (%)
- Exhibits43: Data Table on Cognitive behavioral therapy - Year-over-year growth 2024-2029 (%)
- Exhibits44: Chart on Psychodynamic therapy - Market size and forecast 2024-2029 ($ million)
- Exhibits45: Data Table on Psychodynamic therapy - Market size and forecast 2024-2029 ($ million)
- Exhibits46: Chart on Psychodynamic therapy - Year-over-year growth 2024-2029 (%)
- Exhibits47: Data Table on Psychodynamic therapy - Year-over-year growth 2024-2029 (%)
- Exhibits48: Chart on Personal centered therapy - Market size and forecast 2024-2029 ($ million)
- Exhibits49: Data Table on Personal centered therapy - Market size and forecast 2024-2029 ($ million)
- Exhibits50: Chart on Personal centered therapy - Year-over-year growth 2024-2029 (%)
- Exhibits51: Data Table on Personal centered therapy - Year-over-year growth 2024-2029 (%)
- Exhibits52: Market opportunity by Type ($ million)
- Exhibits53: Data Table on Market opportunity by Type ($ million)
- Exhibits54: Chart on Application - Market share 2024-2029 (%)
- Exhibits55: Data Table on Application - Market share 2024-2029 (%)
- Exhibits56: Chart on Comparison by Application
- Exhibits57: Data Table on Comparison by Application
- Exhibits58: Chart on Residential use - Market size and forecast 2024-2029 ($ million)
- Exhibits59: Data Table on Residential use - Market size and forecast 2024-2029 ($ million)
- Exhibits60: Chart on Residential use - Year-over-year growth 2024-2029 (%)
- Exhibits61: Data Table on Residential use - Year-over-year growth 2024-2029 (%)
- Exhibits62: Chart on Commercial - Market size and forecast 2024-2029 ($ million)
- Exhibits63: Data Table on Commercial - Market size and forecast 2024-2029 ($ million)
- Exhibits64: Chart on Commercial - Year-over-year growth 2024-2029 (%)
- Exhibits65: Data Table on Commercial - Year-over-year growth 2024-2029 (%)
- Exhibits66: Market opportunity by Application ($ million)
- Exhibits67: Data Table on Market opportunity by Application ($ million)
- Exhibits68: Analysis of price sensitivity, lifecycle, customer purchase basket, adoption rates, and purchase criteria
- Exhibits69: Chart on Market share By Geographical Landscape 2024-2029 (%)
- Exhibits70: Data Table on Market share By Geographical Landscape 2024-2029 (%)
- Exhibits71: Chart on Geographic comparison
- Exhibits72: Data Table on Geographic comparison
- Exhibits73: Chart on North America - Market size and forecast 2024-2029 ($ million)
- Exhibits74: Data Table on North America - Market size and forecast 2024-2029 ($ million)
- Exhibits75: Chart on North America - Year-over-year growth 2024-2029 (%)
- Exhibits76: Data Table on North America - Year-over-year growth 2024-2029 (%)
- Exhibits77: Chart on Europe - Market size and forecast 2024-2029 ($ million)
- Exhibits78: Data Table on Europe - Market size and forecast 2024-2029 ($ million)
- Exhibits79: Chart on Europe - Year-over-year growth 2024-2029 (%)
- Exhibits80: Data Table on Europe - Year-over-year growth 2024-2029 (%)
- Exhibits81: Chart on Asia - Market size and forecast 2024-2029 ($ million)
- Exhibits82: Data Table on Asia - Market size and forecast 2024-2029 ($ million)
- Exhibits83: Chart on Asia - Year-over-year growth 2024-2029 (%)
- Exhibits84: Data Table on Asia - Year-over-year growth 2024-2029 (%)
- Exhibits85: Chart on Rest of World (ROW) - Market size and forecast 2024-2029 ($ million)
- Exhibits86: Data Table on Rest of World (ROW) - Market size and forecast 2024-2029 ($ million)
- Exhibits87: Chart on Rest of World (ROW) - Year-over-year growth 2024-2029 (%)
- Exhibits88: Data Table on Rest of World (ROW) - Year-over-year growth 2024-2029 (%)
- Exhibits89: Chart on US - Market size and forecast 2024-2029 ($ million)
- Exhibits90: Data Table on US - Market size and forecast 2024-2029 ($ million)
- Exhibits91: Chart on US - Year-over-year growth 2024-2029 (%)
- Exhibits92: Data Table on US - Year-over-year growth 2024-2029 (%)
- Exhibits93: Chart on UK - Market size and forecast 2024-2029 ($ million)
- Exhibits94: Data Table on UK - Market size and forecast 2024-2029 ($ million)
- Exhibits95: Chart on UK - Year-over-year growth 2024-2029 (%)
- Exhibits96: Data Table on UK - Year-over-year growth 2024-2029 (%)
- Exhibits97: Chart on Germany - Market size and forecast 2024-2029 ($ million)
- Exhibits98: Data Table on Germany - Market size and forecast 2024-2029 ($ million)
- Exhibits99: Chart on Germany - Year-over-year growth 2024-2029 (%)
- Exhibits100: Data Table on Germany - Year-over-year growth 2024-2029 (%)
- Exhibits101: Chart on China - Market size and forecast 2024-2029 ($ million)
- Exhibits102: Data Table on China - Market size and forecast 2024-2029 ($ million)
- Exhibits103: Chart on China - Year-over-year growth 2024-2029 (%)
- Exhibits104: Data Table on China - Year-over-year growth 2024-2029 (%)
- Exhibits105: Chart on India - Market size and forecast 2024-2029 ($ million)
- Exhibits106: Data Table on India - Market size and forecast 2024-2029 ($ million)
- Exhibits107: Chart on India - Year-over-year growth 2024-2029 (%)
- Exhibits108: Data Table on India - Year-over-year growth 2024-2029 (%)
- Exhibits109: Chart on Canada - Market size and forecast 2024-2029 ($ million)
- Exhibits110: Data Table on Canada - Market size and forecast 2024-2029 ($ million)
- Exhibits111: Chart on Canada - Year-over-year growth 2024-2029 (%)
- Exhibits112: Data Table on Canada - Year-over-year growth 2024-2029 (%)
- Exhibits113: Chart on France - Market size and forecast 2024-2029 ($ million)
- Exhibits114: Data Table on France - Market size and forecast 2024-2029 ($ million)
- Exhibits115: Chart on France - Year-over-year growth 2024-2029 (%)
- Exhibits116: Data Table on France - Year-over-year growth 2024-2029 (%)
- Exhibits117: Chart on Japan - Market size and forecast 2024-2029 ($ million)
- Exhibits118: Data Table on Japan - Market size and forecast 2024-2029 ($ million)
- Exhibits119: Chart on Japan - Year-over-year growth 2024-2029 (%)
- Exhibits120: Data Table on Japan - Year-over-year growth 2024-2029 (%)
- Exhibits121: Chart on South Korea - Market size and forecast 2024-2029 ($ million)
- Exhibits122: Data Table on South Korea - Market size and forecast 2024-2029 ($ million)
- Exhibits123: Chart on South Korea - Year-over-year growth 2024-2029 (%)
- Exhibits124: Data Table on South Korea - Year-over-year growth 2024-2029 (%)
- Exhibits125: Chart on Italy - Market size and forecast 2024-2029 ($ million)
- Exhibits126: Data Table on Italy - Market size and forecast 2024-2029 ($ million)
- Exhibits127: Chart on Italy - Year-over-year growth 2024-2029 (%)
- Exhibits128: Data Table on Italy - Year-over-year growth 2024-2029 (%)
- Exhibits129: Market opportunity By Geographical Landscape ($ million)
- Exhibits130: Data Tables on Market opportunity By Geographical Landscape ($ million)
- Exhibits131: Impact of drivers and challenges in 2024 and 2029
- Exhibits132: Overview on criticality of inputs and factors of differentiation
- Exhibits133: Overview on factors of disruption
- Exhibits134: Impact of key risks on business
- Exhibits135: Companies covered
- Exhibits136: Company ranking index
- Exhibits137: Matrix on companies position and classification
- Exhibits138: 7 Cups of Tea Co. - Overview
- Exhibits139: 7 Cups of Tea Co. - Product / Service
- Exhibits140: 7 Cups of Tea Co. - Key offerings
- Exhibits141: SWOT
- Exhibits142: American Well Corp. - Overview
- Exhibits143: American Well Corp. - Product / Service
- Exhibits144: American Well Corp. - Key offerings
- Exhibits145: SWOT
- Exhibits146: BreakThrough Counseling Services - Overview
- Exhibits147: BreakThrough Counseling Services - Product / Service
- Exhibits148: BreakThrough Counseling Services - Key offerings
- Exhibits149: SWOT
- Exhibits150: Calmerry - Overview
- Exhibits151: Calmerry - Product / Service
- Exhibits152: Calmerry - Key offerings
- Exhibits153: SWOT
- Exhibits154: Cerebral Inc. - Overview
- Exhibits155: Cerebral Inc. - Product / Service
- Exhibits156: Cerebral Inc. - Key offerings
- Exhibits157: SWOT
- Exhibits158: Doctor On Demand Inc. - Overview
- Exhibits159: Doctor On Demand Inc. - Product / Service
- Exhibits160: Doctor On Demand Inc. - Key offerings
- Exhibits161: SWOT
- Exhibits162: HopeQure Wellness Solutions Pvt. Ltd. - Overview
- Exhibits163: HopeQure Wellness Solutions Pvt. Ltd. - Product / Service
- Exhibits164: HopeQure Wellness Solutions Pvt. Ltd. - Key offerings
- Exhibits165: SWOT
- Exhibits166: Manastha - Overview
- Exhibits167: Manastha - Product / Service
- Exhibits168: Manastha - Key offerings
- Exhibits169: SWOT
- Exhibits170: MDLIVE Inc. - Overview
- Exhibits171: MDLIVE Inc. - Product / Service
- Exhibits172: MDLIVE Inc. - Key offerings
- Exhibits173: SWOT
- Exhibits174: Mental Fuel Inc. - Overview
- Exhibits175: Mental Fuel Inc. - Product / Service
- Exhibits176: Mental Fuel Inc. - Key offerings
- Exhibits177: SWOT
- Exhibits178: ReGain - Overview
- Exhibits179: ReGain - Product / Service
- Exhibits180: ReGain - Key offerings
- Exhibits181: SWOT
- Exhibits182: TALKSPACE INC. - Overview
- Exhibits183: TALKSPACE INC. - Product / Service
- Exhibits184: TALKSPACE INC. - Key offerings
- Exhibits185: SWOT
- Exhibits186: Teladoc Health Inc. - Overview
- Exhibits187: Teladoc Health Inc. - Product / Service
- Exhibits188: Teladoc Health Inc. - Key offerings
- Exhibits189: SWOT
- Exhibits190: ThriveTalk - Overview
- Exhibits191: ThriveTalk - Product / Service
- Exhibits192: ThriveTalk - Key offerings
- Exhibits193: SWOT
- Exhibits194: Thriveworks Counseling - Overview
- Exhibits195: Thriveworks Counseling - Product / Service
- Exhibits196: Thriveworks Counseling - Key offerings
- Exhibits197: SWOT
- Exhibits198: Inclusions checklist
- Exhibits199: Exclusions checklist
- Exhibits200: Currency conversion rates for US$
- Exhibits201: Research methodology
- Exhibits202: Information sources
- Exhibits203: Data validation
- Exhibits204: Validation techniques employed for market sizing
- Exhibits205: Data synthesis
- Exhibits206: 360 degree market analysis
- Exhibits207: List of abbreviations
Online Therapy Services Market 2025-2029
The online therapy services market is forecasted to grow by USD 64085.9 mn during 2024-2029, accelerating at a CAGR of 53.9% during the forecast period. The report on the online therapy services market provides a holistic analysis, market size and forecast, trends, growth drivers, and challenges, as well as vendor analysis covering around 25 vendors.
The report offers an up-to-date analysis regarding the current market scenario, the latest trends and drivers, and the overall market environment. The market is driven by surging adoption of smartphones coupled with increased preference for online services, strategic initiatives by market vendors, and rising prevalence of mental health disorders.
| Market Scope | |
|---|---|
| Base Year | 2025 |
| End Year | 2029 |
| Series Year | 2025-2029 |
| Growth Momentum | Accelerate |
| YOY 2025 | 32.3% |
| CAGR | 53.9% |
| Incremental Value | $64085.9 mn |
Technavio's online therapy services market is segmented as below:
By Type
- Cognitive behavioral therapy
- Psychodynamic therapy
- Personal centered therapy
By Application
- Residential use
- Commercial
By Geographical Landscape
- North America
- Europe
- Asia
- Rest of World (ROW)
This study identifies the growing popularity of online health services as one of the prime reasons driving the online therapy services market growth during the next few years. Also, growing government initiatives to support online health services and rising number of advertising and marketing campaigns regarding mental health will lead to sizable demand in the market.
The report on the online therapy services market covers the following areas:
- Online Therapy Services Market sizing
- Online Therapy Services Market forecast
- Online Therapy Services Market industry analysis
The robust vendor analysis is designed to help clients improve their market position, and in line with this, this report provides a detailed analysis of several leading online therapy services market vendors that include 7 Cups of Tea Co., American Well Corp., BreakThrough Counseling Services, Calmerry, CareMe Health, Cerebral Inc., Doctor On Demand Inc., DocVita Inc., Felicity, Heart it out, HopeQure Wellness Solutions Pvt. Ltd., Manastha, MDLIVE Inc., Mental Fuel Inc., Mind Voyage, ReGain, TALKSPACE INC., Teladoc Health Inc., ThriveTalk, and Thriveworks Counseling. Also, the online therapy services market analysis report includes information on upcoming trends and challenges that will influence market growth. This is to help companies strategize and leverage all forthcoming growth opportunities.
The study was conducted using an objective combination of primary and secondary information including inputs from key participants in the industry. The report contains a comprehensive market and vendor landscape in addition to an analysis of the key vendors.
The publisher presents a detailed picture of the market by the way of study, synthesis, and summation of data from multiple sources by an analysis of key parameters such as profit, pricing, competition, and promotions. It presents various market facets by identifying the key industry influencers. The data presented is comprehensive, reliable, and a result of extensive primary and secondary research. The market research reports provide a complete competitive landscape and an in-depth vendor selection methodology and analysis using qualitative and quantitative research to forecast accurate market growth.
Table of Contents
1 Executive Summary
- 1.1 Market overview
- Executive Summary - Chart on Market Overview
- Executive Summary - Data Table on Market Overview
- Executive Summary - Chart on Global Market Characteristics
- Executive Summary - Chart on Market By Geographical Landscape
- Executive Summary - Chart on Market Segmentation by Type
- Executive Summary - Chart on Market Segmentation by Application
- Executive Summary - Chart on Incremental Growth
- Executive Summary - Data Table on Incremental Growth
- Executive Summary - Chart on Company Market Positioning
2 Technavio Analysis
- 2.1 Analysis of price sensitivity, lifecycle, customer purchase basket, adoption rates, and purchase criteria
- Analysis of price sensitivity, lifecycle, customer purchase basket, adoption rates, and purchase criteria
- 2.2 Criticality of inputs and Factors of differentiation
- Overview on criticality of inputs and factors of differentiation
- 2.3 Factors of disruption
- Overview on factors of disruption
- 2.4 Impact of drivers and challenges
- Impact of drivers and challenges in 2024 and 2029
3 Market Landscape
- 3.1 Market ecosystem
- Parent Market
- Data Table on - Parent Market
- 3.2 Market characteristics
- Market characteristics analysis
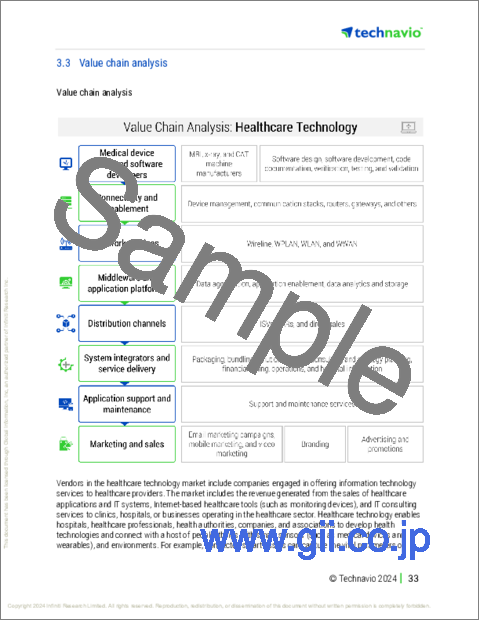
- 3.3 Value chain analysis
- Value chain analysis
4 Market Sizing
- 4.1 Market definition
- Offerings of companies included in the market definition
- 4.2 Market segment analysis
- Market segments
- 4.3 Market size 2024
- 4.4 Market outlook: Forecast for 2024-2029
- Chart on Global - Market size and forecast 2024-2029 ($ million)
- Data Table on Global - Market size and forecast 2024-2029 ($ million)
- Chart on Global Market: Year-over-year growth 2024-2029 (%)
- Data Table on Global Market: Year-over-year growth 2024-2029 (%)
5 Historic Market Size
- 5.1 Global Online Therapy Services Market 2019 - 2023
- Historic Market Size - Data Table on Global Online Therapy Services Market 2019 - 2023 ($ million)
- 5.2 Type segment analysis 2019 - 2023
- Historic Market Size - Type Segment 2019 - 2023 ($ million)
- 5.3 Application segment analysis 2019 - 2023
- Historic Market Size - Application Segment 2019 - 2023 ($ million)
- 5.4 Geography segment analysis 2019 - 2023
- Historic Market Size - Geography Segment 2019 - 2023 ($ million)
- 5.5 Country segment analysis 2019 - 2023
- Historic Market Size - Country Segment 2019 - 2023 ($ million)
6 Qualitative Analysis
- 6.1 Impact of AI on the global online therapy services market
7 Five Forces Analysis
- 7.1 Five forces summary
- Five forces analysis - Comparison between 2024 and 2029
- 7.2 Bargaining power of buyers
- Bargaining power of buyers - Impact of key factors 2024 and 2029
- 7.3 Bargaining power of suppliers
- Bargaining power of suppliers - Impact of key factors in 2024 and 2029
- 7.4 Threat of new entrants
- Threat of new entrants - Impact of key factors in 2024 and 2029
- 7.5 Threat of substitutes
- Threat of substitutes - Impact of key factors in 2024 and 2029
- 7.6 Threat of rivalry
- Threat of rivalry - Impact of key factors in 2024 and 2029
- 7.7 Market condition
- Chart on Market condition - Five forces 2024 and 2029
8 Market Segmentation by Type
- 8.1 Market segments
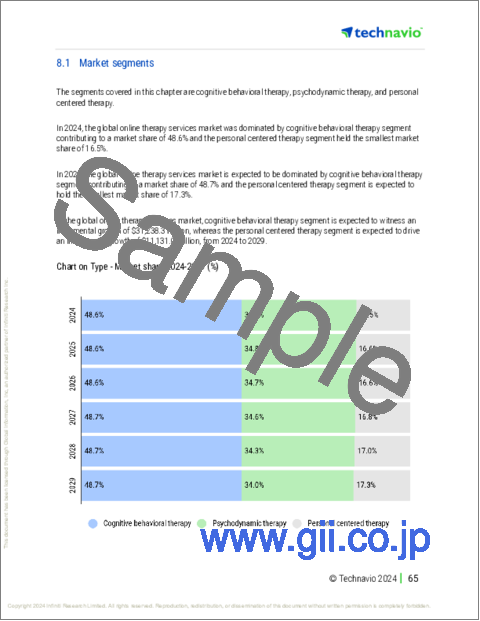
- Chart on Type - Market share 2024-2029 (%)
- Data Table on Type - Market share 2024-2029 (%)
- 8.2 Comparison by Type
- Chart on Comparison by Type
- Data Table on Comparison by Type
- 8.3 Cognitive behavioral therapy - Market size and forecast 2024-2029
- Chart on Cognitive behavioral therapy - Market size and forecast 2024-2029 ($ million)
- Data Table on Cognitive behavioral therapy - Market size and forecast 2024-2029 ($ million)
- Chart on Cognitive behavioral therapy - Year-over-year growth 2024-2029 (%)
- Data Table on Cognitive behavioral therapy - Year-over-year growth 2024-2029 (%)
- 8.4 Psychodynamic therapy - Market size and forecast 2024-2029
- Chart on Psychodynamic therapy - Market size and forecast 2024-2029 ($ million)
- Data Table on Psychodynamic therapy - Market size and forecast 2024-2029 ($ million)
- Chart on Psychodynamic therapy - Year-over-year growth 2024-2029 (%)
- Data Table on Psychodynamic therapy - Year-over-year growth 2024-2029 (%)
- 8.5 Personal centered therapy - Market size and forecast 2024-2029
- Chart on Personal centered therapy - Market size and forecast 2024-2029 ($ million)
- Data Table on Personal centered therapy - Market size and forecast 2024-2029 ($ million)
- Chart on Personal centered therapy - Year-over-year growth 2024-2029 (%)
- Data Table on Personal centered therapy - Year-over-year growth 2024-2029 (%)
- 8.6 Market opportunity by Type
- Market opportunity by Type ($ million)
- Data Table on Market opportunity by Type ($ million)
9 Market Segmentation by Application
- 9.1 Market segments
- Chart on Application - Market share 2024-2029 (%)
- Data Table on Application - Market share 2024-2029 (%)
- 9.2 Comparison by Application
- Chart on Comparison by Application
- Data Table on Comparison by Application
- 9.3 Residential use - Market size and forecast 2024-2029
- Chart on Residential use - Market size and forecast 2024-2029 ($ million)
- Data Table on Residential use - Market size and forecast 2024-2029 ($ million)
- Chart on Residential use - Year-over-year growth 2024-2029 (%)
- Data Table on Residential use - Year-over-year growth 2024-2029 (%)
- 9.4 Commercial - Market size and forecast 2024-2029
- Chart on Commercial - Market size and forecast 2024-2029 ($ million)
- Data Table on Commercial - Market size and forecast 2024-2029 ($ million)
- Chart on Commercial - Year-over-year growth 2024-2029 (%)
- Data Table on Commercial - Year-over-year growth 2024-2029 (%)
- 9.5 Market opportunity by Application
- Market opportunity by Application ($ million)
- Data Table on Market opportunity by Application ($ million)
10 Customer Landscape
- 10.1 Customer landscape overview
- Analysis of price sensitivity, lifecycle, customer purchase basket, adoption rates, and purchase criteria
11 Geographic Landscape
- 11.1 Geographic segmentation
- Chart on Market share By Geographical Landscape 2024-2029 (%)
- Data Table on Market share By Geographical Landscape 2024-2029 (%)
- 11.2 Geographic comparison
- Chart on Geographic comparison
- Data Table on Geographic comparison
- 11.3 North America - Market size and forecast 2024-2029
- Chart on North America - Market size and forecast 2024-2029 ($ million)
- Data Table on North America - Market size and forecast 2024-2029 ($ million)
- Chart on North America - Year-over-year growth 2024-2029 (%)
- Data Table on North America - Year-over-year growth 2024-2029 (%)
- 11.4 Europe - Market size and forecast 2024-2029
- Chart on Europe - Market size and forecast 2024-2029 ($ million)
- Data Table on Europe - Market size and forecast 2024-2029 ($ million)
- Chart on Europe - Year-over-year growth 2024-2029 (%)
- Data Table on Europe - Year-over-year growth 2024-2029 (%)
- 11.5 Asia - Market size and forecast 2024-2029
- Chart on Asia - Market size and forecast 2024-2029 ($ million)
- Data Table on Asia - Market size and forecast 2024-2029 ($ million)
- Chart on Asia - Year-over-year growth 2024-2029 (%)
- Data Table on Asia - Year-over-year growth 2024-2029 (%)
- 11.6 Rest of World (ROW) - Market size and forecast 2024-2029
- Chart on Rest of World (ROW) - Market size and forecast 2024-2029 ($ million)
- Data Table on Rest of World (ROW) - Market size and forecast 2024-2029 ($ million)
- Chart on Rest of World (ROW) - Year-over-year growth 2024-2029 (%)
- Data Table on Rest of World (ROW) - Year-over-year growth 2024-2029 (%)
- 11.7 US - Market size and forecast 2024-2029
- Chart on US - Market size and forecast 2024-2029 ($ million)
- Data Table on US - Market size and forecast 2024-2029 ($ million)
- Chart on US - Year-over-year growth 2024-2029 (%)
- Data Table on US - Year-over-year growth 2024-2029 (%)
- 11.8 UK - Market size and forecast 2024-2029
- Chart on UK - Market size and forecast 2024-2029 ($ million)
- Data Table on UK - Market size and forecast 2024-2029 ($ million)
- Chart on UK - Year-over-year growth 2024-2029 (%)
- Data Table on UK - Year-over-year growth 2024-2029 (%)
- 11.9 Germany - Market size and forecast 2024-2029
- Chart on Germany - Market size and forecast 2024-2029 ($ million)
- Data Table on Germany - Market size and forecast 2024-2029 ($ million)
- Chart on Germany - Year-over-year growth 2024-2029 (%)
- Data Table on Germany - Year-over-year growth 2024-2029 (%)
- 11.10 China - Market size and forecast 2024-2029
- Chart on China - Market size and forecast 2024-2029 ($ million)
- Data Table on China - Market size and forecast 2024-2029 ($ million)
- Chart on China - Year-over-year growth 2024-2029 (%)
- Data Table on China - Year-over-year growth 2024-2029 (%)
- 11.11 India - Market size and forecast 2024-2029
- Chart on India - Market size and forecast 2024-2029 ($ million)
- Data Table on India - Market size and forecast 2024-2029 ($ million)
- Chart on India - Year-over-year growth 2024-2029 (%)
- Data Table on India - Year-over-year growth 2024-2029 (%)
- 11.12 Canada - Market size and forecast 2024-2029
- Chart on Canada - Market size and forecast 2024-2029 ($ million)
- Data Table on Canada - Market size and forecast 2024-2029 ($ million)
- Chart on Canada - Year-over-year growth 2024-2029 (%)
- Data Table on Canada - Year-over-year growth 2024-2029 (%)
- 11.13 France - Market size and forecast 2024-2029
- Chart on France - Market size and forecast 2024-2029 ($ million)
- Data Table on France - Market size and forecast 2024-2029 ($ million)
- Chart on France - Year-over-year growth 2024-2029 (%)
- Data Table on France - Year-over-year growth 2024-2029 (%)
- 11.14 Japan - Market size and forecast 2024-2029
- Chart on Japan - Market size and forecast 2024-2029 ($ million)
- Data Table on Japan - Market size and forecast 2024-2029 ($ million)
- Chart on Japan - Year-over-year growth 2024-2029 (%)
- Data Table on Japan - Year-over-year growth 2024-2029 (%)
- 11.15 South Korea - Market size and forecast 2024-2029
- Chart on South Korea - Market size and forecast 2024-2029 ($ million)
- Data Table on South Korea - Market size and forecast 2024-2029 ($ million)
- Chart on South Korea - Year-over-year growth 2024-2029 (%)
- Data Table on South Korea - Year-over-year growth 2024-2029 (%)
- 11.16 Italy - Market size and forecast 2024-2029
- Chart on Italy - Market size and forecast 2024-2029 ($ million)
- Data Table on Italy - Market size and forecast 2024-2029 ($ million)
- Chart on Italy - Year-over-year growth 2024-2029 (%)
- Data Table on Italy - Year-over-year growth 2024-2029 (%)
- 11.17 Market opportunity By Geographical Landscape
- Market opportunity By Geographical Landscape ($ million)
- Data Tables on Market opportunity By Geographical Landscape ($ million)
12 Drivers, Challenges, and Opportunity/Restraints
- 12.1 Market drivers
- 12.2 Market challenges
- 12.3 Impact of drivers and challenges
- Impact of drivers and challenges in 2024 and 2029
- 12.4 Market opportunities/restraints
13 Competitive Landscape
- 13.1 Overview
- 13.2 Competitive Landscape
- Overview on criticality of inputs and factors of differentiation
- 13.3 Landscape disruption
- Overview on factors of disruption
- 13.4 Industry risks
- Impact of key risks on business
14 Competitive Analysis
- 14.1 Companies profiled
- Companies covered
- 14.2 Company ranking index
- Company ranking index
- 14.3 Market positioning of companies
- Matrix on companies position and classification
- 7 Cups of Tea Co.
- 7 Cups of Tea Co. - Overview
- 7 Cups of Tea Co. - Product / Service
- 7 Cups of Tea Co. - Key offerings
- SWOT
- 14.5 American Well Corp.
- American Well Corp. - Overview
- American Well Corp. - Product / Service
- American Well Corp. - Key offerings
- SWOT
- 14.6 BreakThrough Counseling Services
- BreakThrough Counseling Services - Overview
- BreakThrough Counseling Services - Product / Service
- BreakThrough Counseling Services - Key offerings
- SWOT
- 14.7 Calmerry
- Calmerry - Overview
- Calmerry - Product / Service
- Calmerry - Key offerings
- SWOT
- 14.8 Cerebral Inc.
- Cerebral Inc. - Overview
- Cerebral Inc. - Product / Service
- Cerebral Inc. - Key offerings
- SWOT
- 14.9 Doctor On Demand Inc.
- Doctor On Demand Inc. - Overview
- Doctor On Demand Inc. - Product / Service
- Doctor On Demand Inc. - Key offerings
- SWOT
- 14.10 HopeQure Wellness Solutions Pvt. Ltd.
- HopeQure Wellness Solutions Pvt. Ltd. - Overview
- HopeQure Wellness Solutions Pvt. Ltd. - Product / Service
- HopeQure Wellness Solutions Pvt. Ltd. - Key offerings
- SWOT
- 14.11 Manastha
- Manastha - Overview
- Manastha - Product / Service
- Manastha - Key offerings
- SWOT
- 14.12 MDLIVE Inc.
- MDLIVE Inc. - Overview
- MDLIVE Inc. - Product / Service
- MDLIVE Inc. - Key offerings
- SWOT
- 14.13 Mental Fuel Inc.
- Mental Fuel Inc. - Overview
- Mental Fuel Inc. - Product / Service
- Mental Fuel Inc. - Key offerings
- SWOT
- 14.14 ReGain
- ReGain - Overview
- ReGain - Product / Service
- ReGain - Key offerings
- SWOT
- 14.15 TALKSPACE INC.
- TALKSPACE INC. - Overview
- TALKSPACE INC. - Product / Service
- TALKSPACE INC. - Key offerings
- SWOT
- 14.16 Teladoc Health Inc.
- Teladoc Health Inc. - Overview
- Teladoc Health Inc. - Product / Service
- Teladoc Health Inc. - Key offerings
- SWOT
- 14.17 ThriveTalk
- ThriveTalk - Overview
- ThriveTalk - Product / Service
- ThriveTalk - Key offerings
- SWOT
- 14.18 Thriveworks Counseling
- Thriveworks Counseling - Overview
- Thriveworks Counseling - Product / Service
- Thriveworks Counseling - Key offerings
- SWOT
15 Appendix
- 15.1 Scope of the report
- 15.2 Inclusions and exclusions checklist
- Inclusions checklist
- Exclusions checklist
- 15.3 Currency conversion rates for US$
- Currency conversion rates for US$
- 15.4 Research methodology
- Research methodology
- 15.5 Data procurement
- Information sources
- 15.6 Data validation
- Data validation
- 15.7 Validation techniques employed for market sizing
- Validation techniques employed for market sizing
- 15.8 Data synthesis
- Data synthesis
- 15.9 360 degree market analysis
- 360 degree market analysis
- 15.10 List of abbreviations
- List of abbreviations
