|
|
市場調査レポート
商品コード
1681275
保護リレーの世界市場、2025-2029年Global Protective Relay Market 2025-2029 |
||||||

|
|||||||
カスタマイズ可能
|
|||||||


| 保護リレーの世界市場、2025-2029年 |
|
出版日: 2025年02月27日
発行: TechNavio
ページ情報: 英文 250 Pages
納期: 即納可能
|

全表示
- 概要
- 目次
保護リレー市場は2024-2029年に8億1,160万米ドル、予測期間中のCAGRは5.6%で成長すると予測されます。
当レポートでは、保護リレー市場の全体的な分析、市場規模・予測、動向、成長促進要因、課題、約25のベンダーを網羅したベンダー分析などを掲載しています。
現在の市場シナリオ、最新動向と促進要因、市場環境全体に関する最新分析を提供しています。市場は、電力需要の増加、送電網の近代化への関心の高まり、住宅・商業ビルプロジェクトの増加によって牽引されています。
| 市場範囲 | |
|---|---|
| 基準年 | 2025 |
| 終了年 | 2029 |
| 予測期間 | 2025-2029 |
| 成長モメンタム | 加速 |
| 前年比2025年 | 4.9% |
| CAGR | 5.6% |
| 増分額 | 8億1,160万米ドル |
本調査は、業界の主要参加者からのインプットを含め、一次情報と二次情報を客観的に組み合わせて実施しました。レポートには、主要企業の分析に加え、包括的な市場規模データ、地域分析によるセグメント、ベンダー情勢が含まれています。レポートには過去データと予測データがあります。
本調査では、今後数年間の保護リレー市場の成長を促進する主な要因の1つとして、保護リレーにおける技術進歩の拡大を挙げています。また、保護リレーに関連する新製品の開発や、保護リレーに関連する改造やアップグレードサービスへの注目の高まりは、市場の大きな需要につながります。
目次
第1章 エグゼクティブサマリー
- 市場概要
第2章 Technavio分析
- 価格・ライフサイクル・顧客購入バスケット・採用率・購入基準の分析
- インプットの重要性と差別化の要因
- 混乱の要因
- 促進要因と課題の影響
第3章 市場情勢
- 市場エコシステム
- 市場の特徴
- バリューチェーン分析
第4章 市場規模
- 市場の定義
- 市場セグメント分析
- 市場規模 2024
- 市場の見通し 2024-2029
第5章 市場規模実績
- 保護リレーの世界市場 2019-2023
- タイプセグメント分析 2019-2023
- 用途別セグメント分析 2019-2023
- 変異セグメント分析 2019-2023
- エンドユーザーセグメント分析 2019-2023
- 地域別セグメント分析 2019-2023
- 国別セグメント分析 2019-2023
第6章 定性分析
- AIの影響:保護リレーの世界市場
第7章 ファイブフォース分析
- ファイブフォースの要約
- 買い手の交渉力
- 供給企業の交渉力
- 新規参入業者の脅威
- 代替品の脅威
- 競争の脅威
- 市況
第8章 市場セグメンテーション:タイプ別
- 市場セグメント
- 比較:タイプ別
- デジタルおよび数値リレー:市場規模と予測 2024-2029
- 電気機械式および静的リレー:市場規模と予測 2024-2029
- 市場機会:タイプ別
第9章 市場セグメンテーション:用途別
- 市場セグメント
- 比較:用途別
- フィーダー:市場規模と予測 2024-2029
- 送電線:市場規模と予測 2024-2029
- 発電機:市場規模と予測 2024-2029
- モーター:市場規模と予測 2024-2029
- その他:市場規模と予測 2024-2029
- 市場機会:用途別
第10章 市場セグメンテーションバリアント別
- 市場セグメント
- 比較:バリアント別
- 低電圧:市場規模と予測 2024-2029
- 中電圧:市場規模と予測 2024-2029
- 高電圧:市場規模と予測 2024-2029
- 市場機会:バリアント別
第11章 市場セグメンテーション:エンドユーザー別
- 市場セグメント
- 比較:エンドユーザー別
- 公共事業:市場規模と予測 2024-2029
- 産業:市場規模と予測 2024-2029
- 商業用:市場規模と予測 2024-2029
- 市場機会:エンドユーザー別
第12章 顧客情勢
- 顧客情勢の概要
第13章 地域別情勢
- 地域別セグメンテーション
- 地域別比較
- アジア太平洋:市場規模と予測 2024-2029
- 北米:市場規模と予測 2024-2029
- 欧州:市場規模と予測 2024-2029
- 中東・アフリカ:市場規模と予測 2024-2029
- 南米:市場規模と予測 2024-2029
- 米国:市場規模と予測 2024-2029
- 中国:市場規模と予測 2024-2029
- 日本:市場規模と予測 2024-2029
- インド:市場規模と予測 2024-2029
- 韓国:市場規模と予測 2024-2029
- カナダ:市場規模と予測 2024-2029
- 英国:市場規模と予測 2024-2029
- オーストラリア:市場規模と予測 2024-2029
- ドイツ:市場規模と予測 2024-2029
- フランス:市場規模と予測 2024-2029
- 市場機会:地域情勢別
第14章 促進要因・課題・機会・抑制要因
- 市場促進要因
- 市場の課題
- 促進要因と課題の影響
- 市場の機会・抑制要因
第15章 競合情勢
- 概要
- 競合情勢
- 混乱の状況
- 業界のリスク
第16章 競合分析
- 企業プロファイル
- 企業ランキング指数
- 企業の市場ポジショニング
- ABB Ltd.
- ALSTOM SA
- Chongqing Blue Jay Technology Co. Ltd.
- Contrel elettronica S.r.l.
- Eaton Corp. plc
- Fanox Electronic SL
- General Electric Co.
- HNAC Technology Co. Ltd.
- Larsen and Toubro Ltd.
- Littelfuse Inc.
- Mitsubishi Electric Corp.
- Rockwell Automation Inc.
- Schneider Electric SE
- Siemens AG
- Solcon IGEL Group
第17章 付録
The protective relay market is forecasted to grow by USD 811.6 million during 2024-2029, accelerating at a CAGR of 5.6% during the forecast period. The report on the protective relay market provides a holistic analysis, market size and forecast, trends, growth drivers, and challenges, as well as vendor analysis covering around 25 vendors.
The report offers an up-to-date analysis regarding the current market scenario, the latest trends and drivers, and the overall market environment. The market is driven by increasing demand for power, growing focus on grid modernization, and increase in number of residential and commercial building projects.
| Market Scope | |
|---|---|
| Base Year | 2025 |
| End Year | 2029 |
| Series Year | 2025-2029 |
| Growth Momentum | Accelerate |
| YOY 2025 | 4.9% |
| CAGR | 5.6% |
| Incremental Value | $811.6 mn |
The study was conducted using an objective combination of primary and secondary information including inputs from key participants in the industry. The report contains a comprehensive market size data, segment with regional analysis and vendor landscape in addition to an analysis of the key companies. Reports have historic and forecast data.
Technavio's protective relay market is segmented as below:
By Type
- Digital and numeric relay
- Electromechanical and static relay
By Application
- Feeder
- Transmission line
- Generator
- Motor
- Others
By Variant
- Low voltage
- Medium voltage
- High voltage
By End-user
- Utilities
- Industrial
- Commercial
By Geographical Landscape
- APAC
- North America
- Europe
- Middle East and Africa
- South America
This study identifies the growing technological advancements in protective relays as one of the prime reasons driving the protective relay market growth during the next few years. Also, new product development related to protective relays and increasing focus on modification and upgrade services related to protective relays will lead to sizable demand in the market.
The report on the protective relay market covers the following areas:
- Protective Relay Market sizing
- Protective Relay Market forecast
- Protective Relay Market industry analysis
The robust vendor analysis is designed to help clients improve their market position, and in line with this, this report provides a detailed analysis of several leading protective relay market vendors that include ABB Ltd., ALSTOM SA, Chongqing Blue Jay Technology Co. Ltd., Contrel elettronica S.R.l., Eaton Corp. PLC, ERLPhase Power Technologies Ltd., ETA Elektrotechnische Apparate GmbH, Fanox Electronic SL, General Electric Co., HNAC Technology Co. Ltd., ISKRA elektro in sistemske resitve d.o.o, Larsen and Toubro Ltd., Littelfuse Inc., Mitsubishi Electric Corp., Rockwell Automation Inc., Schneider Electric SE, Siemens AG, Solcon IGEL Group, TERASAKI ELECTRIC CO. LTD., and ZIV Automation. Also, the protective relay market analysis report includes information on upcoming trends and challenges that will influence market growth. This is to help companies strategize and leverage all forthcoming growth opportunities.
The publisher presents a detailed picture of the market by the way of study, synthesis, and summation of data from multiple sources by an analysis of key parameters such as profit, pricing, competition, and promotions. It presents various market facets by identifying the key industry influencers. The data presented is comprehensive, reliable, and a result of extensive primary and secondary research. The market research reports provide a complete competitive landscape and an in-depth vendor selection methodology and analysis using qualitative and quantitative research to forecast accurate market growth.
Table of Contents
1 Executive Summary
- 1.1 Market overview
- Executive Summary - Chart on Market Overview
- Executive Summary - Data Table on Market Overview
- Executive Summary - Chart on Global Market Characteristics
- Executive Summary - Chart on Market By Geographical Landscape
- Executive Summary - Chart on Market Segmentation by Type
- Executive Summary - Chart on Market Segmentation by Application
- Executive Summary - Chart on Market Segmentation by Variant
- Executive Summary - Chart on Market Segmentation by End-user
- Executive Summary - Chart on Incremental Growth
- Executive Summary - Data Table on Incremental Growth
- Executive Summary - Chart on Company Market Positioning
2 Technavio Analysis
- 2.1 Analysis of price sensitivity, lifecycle, customer purchase basket, adoption rates, and purchase criteria
- Analysis of price sensitivity, lifecycle, customer purchase basket, adoption rates, and purchase criteria
- 2.2 Criticality of inputs and Factors of differentiation
- Overview on criticality of inputs and factors of differentiation
- 2.3 Factors of disruption
- Overview on factors of disruption
- 2.4 Impact of drivers and challenges
- Impact of drivers and challenges in 2024 and 2029
3 Market Landscape
- 3.1 Market ecosystem
- Parent Market
- Data Table on - Parent Market
- 3.2 Market characteristics
- Market characteristics analysis
- 3.3 Value chain analysis
- Value chain analysis
4 Market Sizing
- 4.1 Market definition
- Offerings of companies included in the market definition
- 4.2 Market segment analysis
- Market segments
- 4.3 Market size 2024
- 4.4 Market outlook: Forecast for 2024-2029
- Chart on Global - Market size and forecast 2024-2029 ($ million)
- Data Table on Global - Market size and forecast 2024-2029 ($ million)
- Chart on Global Market: Year-over-year growth 2024-2029 (%)
- Data Table on Global Market: Year-over-year growth 2024-2029 (%)
5 Historic Market Size
- 5.1 Global Protective Relay Market 2019 - 2023
- Historic Market Size - Data Table on Global Protective Relay Market 2019 - 2023 ($ million)
- 5.2 Type segment analysis 2019 - 2023
- Historic Market Size - Type Segment 2019 - 2023 ($ million)
- 5.3 Application segment analysis 2019 - 2023
- Historic Market Size - Application Segment 2019 - 2023 ($ million)
- 5.4 Variant segment analysis 2019 - 2023
- Historic Market Size - Variant Segment 2019 - 2023 ($ million)
- 5.5 End-user segment analysis 2019 - 2023
- Historic Market Size - End-user Segment 2019 - 2023 ($ million)
- 5.6 Geography segment analysis 2019 - 2023
- Historic Market Size - Geography Segment 2019 - 2023 ($ million)
- 5.7 Country segment analysis 2019 - 2023
- Historic Market Size - Country Segment 2019 - 2023 ($ million)
6 Qualitative Analysis
- 6.1 Impact of AI on the Global Protective Relay Market
7 Five Forces Analysis
- 7.1 Five forces summary
- Five forces analysis - Comparison between 2024 and 2029
- 7.2 Bargaining power of buyers
- Bargaining power of buyers - Impact of key factors 2024 and 2029
- 7.3 Bargaining power of suppliers
- Bargaining power of suppliers - Impact of key factors in 2024 and 2029
- 7.4 Threat of new entrants
- Threat of new entrants - Impact of key factors in 2024 and 2029
- 7.5 Threat of substitutes
- Threat of substitutes - Impact of key factors in 2024 and 2029
- 7.6 Threat of rivalry
- Threat of rivalry - Impact of key factors in 2024 and 2029
- 7.7 Market condition
- Chart on Market condition - Five forces 2024 and 2029
8 Market Segmentation by Type
- 8.1 Market segments
- Chart on Type - Market share 2024-2029 (%)
- Data Table on Type - Market share 2024-2029 (%)
- 8.2 Comparison by Type
- Chart on Comparison by Type
- Data Table on Comparison by Type
- 8.3 Digital and numeric relay - Market size and forecast 2024-2029
- Chart on Digital and numeric relay - Market size and forecast 2024-2029 ($ million)
- Data Table on Digital and numeric relay - Market size and forecast 2024-2029 ($ million)
- Chart on Digital and numeric relay - Year-over-year growth 2024-2029 (%)
- Data Table on Digital and numeric relay - Year-over-year growth 2024-2029 (%)
- 8.4 Electromechanical and static relay - Market size and forecast 2024-2029
- Chart on Electromechanical and static relay - Market size and forecast 2024-2029 ($ million)
- Data Table on Electromechanical and static relay - Market size and forecast 2024-2029 ($ million)
- Chart on Electromechanical and static relay - Year-over-year growth 2024-2029 (%)
- Data Table on Electromechanical and static relay - Year-over-year growth 2024-2029 (%)
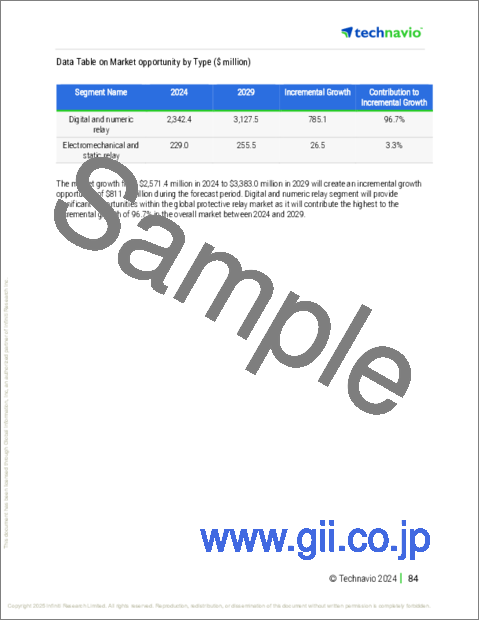
- 8.5 Market opportunity by Type
- Market opportunity by Type ($ million)
- Data Table on Market opportunity by Type ($ million)
9 Market Segmentation by Application
- 9.1 Market segments
- Chart on Application - Market share 2024-2029 (%)
- Data Table on Application - Market share 2024-2029 (%)
- 9.2 Comparison by Application
- Chart on Comparison by Application
- Data Table on Comparison by Application
- 9.3 Feeder - Market size and forecast 2024-2029
- Chart on Feeder - Market size and forecast 2024-2029 ($ million)
- Data Table on Feeder - Market size and forecast 2024-2029 ($ million)
- Chart on Feeder - Year-over-year growth 2024-2029 (%)
- Data Table on Feeder - Year-over-year growth 2024-2029 (%)
- 9.4 Transmission line - Market size and forecast 2024-2029
- Chart on Transmission line - Market size and forecast 2024-2029 ($ million)
- Data Table on Transmission line - Market size and forecast 2024-2029 ($ million)
- Chart on Transmission line - Year-over-year growth 2024-2029 (%)
- Data Table on Transmission line - Year-over-year growth 2024-2029 (%)
- 9.5 Generator - Market size and forecast 2024-2029
- Chart on Generator - Market size and forecast 2024-2029 ($ million)
- Data Table on Generator - Market size and forecast 2024-2029 ($ million)
- Chart on Generator - Year-over-year growth 2024-2029 (%)
- Data Table on Generator - Year-over-year growth 2024-2029 (%)
- 9.6 Motor - Market size and forecast 2024-2029
- Chart on Motor - Market size and forecast 2024-2029 ($ million)
- Data Table on Motor - Market size and forecast 2024-2029 ($ million)
- Chart on Motor - Year-over-year growth 2024-2029 (%)
- Data Table on Motor - Year-over-year growth 2024-2029 (%)
- 9.7 Others - Market size and forecast 2024-2029
- Chart on Others - Market size and forecast 2024-2029 ($ million)
- Data Table on Others - Market size and forecast 2024-2029 ($ million)
- Chart on Others - Year-over-year growth 2024-2029 (%)
- Data Table on Others - Year-over-year growth 2024-2029 (%)
- 9.8 Market opportunity by Application
- Market opportunity by Application ($ million)
- Data Table on Market opportunity by Application ($ million)
10 Market Segmentation by Variant
- 10.1 Market segments
- Chart on Variant - Market share 2024-2029 (%)
- Data Table on Variant - Market share 2024-2029 (%)
- 10.2 Comparison by Variant
- Chart on Comparison by Variant
- Data Table on Comparison by Variant
- 10.3 Low voltage - Market size and forecast 2024-2029
- Chart on Low voltage - Market size and forecast 2024-2029 ($ million)
- Data Table on Low voltage - Market size and forecast 2024-2029 ($ million)
- Chart on Low voltage - Year-over-year growth 2024-2029 (%)
- Data Table on Low voltage - Year-over-year growth 2024-2029 (%)
- 10.4 Medium voltage - Market size and forecast 2024-2029
- Chart on Medium voltage - Market size and forecast 2024-2029 ($ million)
- Data Table on Medium voltage - Market size and forecast 2024-2029 ($ million)
- Chart on Medium voltage - Year-over-year growth 2024-2029 (%)
- Data Table on Medium voltage - Year-over-year growth 2024-2029 (%)
- 10.5 High voltage - Market size and forecast 2024-2029
- Chart on High voltage - Market size and forecast 2024-2029 ($ million)
- Data Table on High voltage - Market size and forecast 2024-2029 ($ million)
- Chart on High voltage - Year-over-year growth 2024-2029 (%)
- Data Table on High voltage - Year-over-year growth 2024-2029 (%)
- 10.6 Market opportunity by Variant
- Market opportunity by Variant ($ million)
- Data Table on Market opportunity by Variant ($ million)
11 Market Segmentation by End-user
- 11.1 Market segments
- Chart on End-user - Market share 2024-2029 (%)
- Data Table on End-user - Market share 2024-2029 (%)
- 11.2 Comparison by End-user
- Chart on Comparison by End-user
- Data Table on Comparison by End-user
- 11.3 Utilities - Market size and forecast 2024-2029
- Chart on Utilities - Market size and forecast 2024-2029 ($ million)
- Data Table on Utilities - Market size and forecast 2024-2029 ($ million)
- Chart on Utilities - Year-over-year growth 2024-2029 (%)
- Data Table on Utilities - Year-over-year growth 2024-2029 (%)
- 11.4 Industrial - Market size and forecast 2024-2029
- Chart on Industrial - Market size and forecast 2024-2029 ($ million)
- Data Table on Industrial - Market size and forecast 2024-2029 ($ million)
- Chart on Industrial - Year-over-year growth 2024-2029 (%)
- Data Table on Industrial - Year-over-year growth 2024-2029 (%)
- 11.5 Commercial - Market size and forecast 2024-2029
- Chart on Commercial - Market size and forecast 2024-2029 ($ million)
- Data Table on Commercial - Market size and forecast 2024-2029 ($ million)
- Chart on Commercial - Year-over-year growth 2024-2029 (%)
- Data Table on Commercial - Year-over-year growth 2024-2029 (%)
- 11.6 Market opportunity by End-user
- Market opportunity by End-user ($ million)
- Data Table on Market opportunity by End-user ($ million)
12 Customer Landscape
- 12.1 Customer landscape overview
- Analysis of price sensitivity, lifecycle, customer purchase basket, adoption rates, and purchase criteria
13 Geographic Landscape
- 13.1 Geographic segmentation
- Chart on Market share By Geographical Landscape 2024-2029 (%)
- Data Table on Market share By Geographical Landscape 2024-2029 (%)
- 13.2 Geographic comparison
- Chart on Geographic comparison
- Data Table on Geographic comparison
- 13.3 APAC - Market size and forecast 2024-2029
- Chart on APAC - Market size and forecast 2024-2029 ($ million)
- Data Table on APAC - Market size and forecast 2024-2029 ($ million)
- Chart on APAC - Year-over-year growth 2024-2029 (%)
- Data Table on APAC - Year-over-year growth 2024-2029 (%)
- 13.4 North America - Market size and forecast 2024-2029
- Chart on North America - Market size and forecast 2024-2029 ($ million)
- Data Table on North America - Market size and forecast 2024-2029 ($ million)
- Chart on North America - Year-over-year growth 2024-2029 (%)
- Data Table on North America - Year-over-year growth 2024-2029 (%)
- 13.5 Europe - Market size and forecast 2024-2029
- Chart on Europe - Market size and forecast 2024-2029 ($ million)
- Data Table on Europe - Market size and forecast 2024-2029 ($ million)
- Chart on Europe - Year-over-year growth 2024-2029 (%)
- Data Table on Europe - Year-over-year growth 2024-2029 (%)
- 13.6 Middle East and Africa - Market size and forecast 2024-2029
- Chart on Middle East and Africa - Market size and forecast 2024-2029 ($ million)
- Data Table on Middle East and Africa - Market size and forecast 2024-2029 ($ million)
- Chart on Middle East and Africa - Year-over-year growth 2024-2029 (%)
- Data Table on Middle East and Africa - Year-over-year growth 2024-2029 (%)
- 13.7 South America - Market size and forecast 2024-2029
- Chart on South America - Market size and forecast 2024-2029 ($ million)
- Data Table on South America - Market size and forecast 2024-2029 ($ million)
- Chart on South America - Year-over-year growth 2024-2029 (%)
- Data Table on South America - Year-over-year growth 2024-2029 (%)
- 13.8 US - Market size and forecast 2024-2029
- Chart on US - Market size and forecast 2024-2029 ($ million)
- Data Table on US - Market size and forecast 2024-2029 ($ million)
- Chart on US - Year-over-year growth 2024-2029 (%)
- Data Table on US - Year-over-year growth 2024-2029 (%)
- 13.9 China - Market size and forecast 2024-2029
- Chart on China - Market size and forecast 2024-2029 ($ million)
- Data Table on China - Market size and forecast 2024-2029 ($ million)
- Chart on China - Year-over-year growth 2024-2029 (%)
- Data Table on China - Year-over-year growth 2024-2029 (%)
- 13.10 Japan - Market size and forecast 2024-2029
- Chart on Japan - Market size and forecast 2024-2029 ($ million)
- Data Table on Japan - Market size and forecast 2024-2029 ($ million)
- Chart on Japan - Year-over-year growth 2024-2029 (%)
- Data Table on Japan - Year-over-year growth 2024-2029 (%)
- 13.11 India - Market size and forecast 2024-2029
- Chart on India - Market size and forecast 2024-2029 ($ million)
- Data Table on India - Market size and forecast 2024-2029 ($ million)
- Chart on India - Year-over-year growth 2024-2029 (%)
- Data Table on India - Year-over-year growth 2024-2029 (%)
- 13.12 South Korea - Market size and forecast 2024-2029
- Chart on South Korea - Market size and forecast 2024-2029 ($ million)
- Data Table on South Korea - Market size and forecast 2024-2029 ($ million)
- Chart on South Korea - Year-over-year growth 2024-2029 (%)
- Data Table on South Korea - Year-over-year growth 2024-2029 (%)
- 13.13 Canada - Market size and forecast 2024-2029
- Chart on Canada - Market size and forecast 2024-2029 ($ million)
- Data Table on Canada - Market size and forecast 2024-2029 ($ million)
- Chart on Canada - Year-over-year growth 2024-2029 (%)
- Data Table on Canada - Year-over-year growth 2024-2029 (%)
- 13.14 UK - Market size and forecast 2024-2029
- Chart on UK - Market size and forecast 2024-2029 ($ million)
- Data Table on UK - Market size and forecast 2024-2029 ($ million)
- Chart on UK - Year-over-year growth 2024-2029 (%)
- Data Table on UK - Year-over-year growth 2024-2029 (%)
- 13.15 Australia - Market size and forecast 2024-2029
- Chart on Australia - Market size and forecast 2024-2029 ($ million)
- Data Table on Australia - Market size and forecast 2024-2029 ($ million)
- Chart on Australia - Year-over-year growth 2024-2029 (%)
- Data Table on Australia - Year-over-year growth 2024-2029 (%)
- 13.16 Germany - Market size and forecast 2024-2029
- Chart on Germany - Market size and forecast 2024-2029 ($ million)
- Data Table on Germany - Market size and forecast 2024-2029 ($ million)
- Chart on Germany - Year-over-year growth 2024-2029 (%)
- Data Table on Germany - Year-over-year growth 2024-2029 (%)
- 13.17 France - Market size and forecast 2024-2029
- Chart on France - Market size and forecast 2024-2029 ($ million)
- Data Table on France - Market size and forecast 2024-2029 ($ million)
- Chart on France - Year-over-year growth 2024-2029 (%)
- Data Table on France - Year-over-year growth 2024-2029 (%)
- 13.18 Market opportunity By Geographical Landscape
- Market opportunity By Geographical Landscape ($ million)
- Data Tables on Market opportunity By Geographical Landscape ($ million)
14 Drivers, Challenges, and Opportunity/Restraints
- 14.1 Market drivers
- 14.2 Market challenges
- 14.3 Impact of drivers and challenges
- Impact of drivers and challenges in 2024 and 2029
- 14.4 Market opportunities/restraints
15 Competitive Landscape
- 15.1 Overview
- 15.2 Competitive Landscape
- Overview on criticality of inputs and factors of differentiation
- 15.3 Landscape disruption
- Overview on factors of disruption
- 15.4 Industry risks
- Impact of key risks on business
16 Competitive Analysis
- 16.1 Companies profiled
- Companies covered
- 16.2 Company ranking index
- Company ranking index
- 16.3 Market positioning of companies
- Matrix on companies position and classification
- 16.4 ABB Ltd.
- ABB Ltd. - Overview
- ABB Ltd. - Business segments
- ABB Ltd. - Key news
- ABB Ltd. - Key offerings
- ABB Ltd. - Segment focus
- SWOT
- 16.5 ALSTOM SA
- ALSTOM SA - Overview
- ALSTOM SA - Business segments
- ALSTOM SA - Key offerings
- ALSTOM SA - Segment focus
- SWOT
- 16.6 Chongqing Blue Jay Technology Co. Ltd.
- Chongqing Blue Jay Technology Co. Ltd. - Overview
- Chongqing Blue Jay Technology Co. Ltd. - Product / Service
- Chongqing Blue Jay Technology Co. Ltd. - Key offerings
- SWOT
- 16.7 Contrel elettronica S.r.l.
- Contrel elettronica S.r.l. - Overview
- Contrel elettronica S.r.l. - Product / Service
- Contrel elettronica S.r.l. - Key offerings
- SWOT
- 16.8 Eaton Corp. plc
- Eaton Corp. plc - Overview
- Eaton Corp. plc - Business segments
- Eaton Corp. plc - Key news
- Eaton Corp. plc - Key offerings
- Eaton Corp. plc - Segment focus
- SWOT
- 16.9 Fanox Electronic SL
- Fanox Electronic SL - Overview
- Fanox Electronic SL - Product / Service
- Fanox Electronic SL - Key offerings
- SWOT
- 16.10 General Electric Co.
- General Electric Co. - Overview
- General Electric Co. - Business segments
- General Electric Co. - Key news
- General Electric Co. - Key offerings
- General Electric Co. - Segment focus
- SWOT
- 16.11 HNAC Technology Co. Ltd.
- HNAC Technology Co. Ltd. - Overview
- HNAC Technology Co. Ltd. - Product / Service
- HNAC Technology Co. Ltd. - Key offerings
- SWOT
- 16.12 Larsen and Toubro Ltd.
- Larsen and Toubro Ltd. - Overview
- Larsen and Toubro Ltd. - Business segments
- Larsen and Toubro Ltd. - Key news
- Larsen and Toubro Ltd. - Key offerings
- Larsen and Toubro Ltd. - Segment focus
- SWOT
- 16.13 Littelfuse Inc.
- Littelfuse Inc. - Overview
- Littelfuse Inc. - Business segments
- Littelfuse Inc. - Key news
- Littelfuse Inc. - Key offerings
- Littelfuse Inc. - Segment focus
- SWOT
- 16.14 Mitsubishi Electric Corp.
- Mitsubishi Electric Corp. - Overview
- Mitsubishi Electric Corp. - Business segments
- Mitsubishi Electric Corp. - Key offerings
- Mitsubishi Electric Corp. - Segment focus
- SWOT
- 16.15 Rockwell Automation Inc.
- Rockwell Automation Inc. - Overview
- Rockwell Automation Inc. - Business segments
- Rockwell Automation Inc. - Key news
- Rockwell Automation Inc. - Key offerings
- Rockwell Automation Inc. - Segment focus
- SWOT
- 16.16 Schneider Electric SE
- Schneider Electric SE - Overview
- Schneider Electric SE - Business segments
- Schneider Electric SE - Key news
- Schneider Electric SE - Key offerings
- Schneider Electric SE - Segment focus
- SWOT
- 16.17 Siemens AG
- Siemens AG - Overview
- Siemens AG - Business segments
- Siemens AG - Key news
- Siemens AG - Key offerings
- Siemens AG - Segment focus
- SWOT
- 16.18 Solcon IGEL Group
- Solcon IGEL Group - Overview
- Solcon IGEL Group - Product / Service
- Solcon IGEL Group - Key offerings
- SWOT
17 Appendix
- 17.1 Scope of the report
- 17.2 Inclusions and exclusions checklist
- Inclusions checklist
- Exclusions checklist
- 17.3 Currency conversion rates for US$
- Currency conversion rates for US$
- 17.4 Research methodology
- Research methodology
- 17.5 Data procurement
- Information sources
- 17.6 Data validation
- Data validation
- 17.7 Validation techniques employed for market sizing
- Validation techniques employed for market sizing
- 17.8 Data synthesis
- Data synthesis
- 17.9 360 degree market analysis
- 360 degree market analysis
- 17.10 List of abbreviations
- List of abbreviations

