|
|
市場調査レポート
商品コード
1681193
コンパニオンアニマル用特殊医薬品の世界市場、2025-2029年Global Companion Animal Specialty Drugs Market 2025-2029 |
||||||
|
|||||||
カスタマイズ可能
|
|||||||


| コンパニオンアニマル用特殊医薬品の世界市場、2025-2029年 |
|
出版日: 2025年03月01日
発行: TechNavio
ページ情報: 英文 237 Pages
納期: 即納可能
|

全表示
- 概要
- 目次
コンパニオンアニマル用特殊医薬品市場は、2024年から2029年にかけて65億4,120万米ドル、予測期間中のCAGRは7.4%で成長すると予測されています。
当レポートでは、コンパニオンアニマル用特殊医薬品市場の全体的な分析、市場規模・予測、動向、成長促進要因、課題、約25のベンダーを網羅したベンダー分析などを掲載しています。
現在の市場シナリオ、最新動向と促進要因、市場環境全体に関する最新分析を提供しています。市場は、ペットの人間化の進展、疾病予防やペット保険に対する意識の高まり、コンパニオンアニマルの高齢化などが牽引しています。
| 市場範囲 | |
|---|---|
| 基準年 | 2025 |
| 終了年 | 2029 |
| 予測期間 | 2025-2029 |
| 成長モメンタム | 加速 |
| 前年比2025年 | 6.8% |
| CAGR | 7.4% |
| 増分額 | 65億4,120万米ドル |
本調査は、業界の主要参加者からのインプットを含め、一次情報と二次情報を客観的に組み合わせて実施しました。レポートには、主要企業の分析に加え、包括的な市場規模データ、地域分析によるセグメント、ベンダー情勢が含まれています。レポートには過去データと予測データがあります。
本調査では、コンパニオンアニマル向け特殊医薬品の充実が、今後数年間のコンパニオンアニマル用特殊医薬品市場の成長を促進する主要因の一つであると指摘しています。また、コンパニオンアニマル向け特殊医薬品市場における合併・買収の増加、コンパニオンアニマルにおける肥満の増加は、同市場における大きな需要につながるでしょう。
目次
第1章 エグゼクティブサマリー
- 市場概要
第2章 Technavio分析
- 価格・ライフサイクル・顧客購入バスケット・採用率・購入基準の分析
- インプットの重要性と差別化の要因
- 混乱の要因
- 促進要因と課題の影響
第3章 市場情勢
- 市場エコシステム
- 市場の特徴
- バリューチェーン分析
第4章 市場規模
- 市場の定義
- 市場セグメント分析
- 市場規模 2024
- 市場の見通し 2024-2029
第5章 市場規模実績
- コンパニオンアニマル用医薬品の世界市場 2019-2023
- 流通チャネルセグメント分析 2019-2023
- 製品セグメント分析 2019-2023
- 投与経路セグメント分析 2019-2023
- 動物タイプセグメント分析 2019-2023
- 地域別セグメント分析 2019-2023
- 国別セグメント分析 2019-2023
第6章 定性分析
- AIがコンパニオンアニマル用医薬品市場に与える影響
第7章 ファイブフォース分析
- ファイブフォースの要約
- 買い手の交渉力
- 供給企業の交渉力
- 新規参入業者の脅威
- 代替品の脅威
- 競争の脅威
- 市況
第8章 市場セグメンテーション:流通チャネル別
- 市場セグメント
- 比較:流通チャネル別
- 動物病院:市場規模と予測 2024-2029
- ペットケアクリニック:市場規模と予測 2024-2029
- 薬局:市場規模と予測 2024-2029
- 市場機会:流通チャネル別
第9章 市場セグメンテーション:製品別
- 市場セグメント
- 比較:製品別
- ワクチン:市場規模と予測 2024-2029
- 抗生物質:市場規模と予測 2024-2029
- 寄生虫駆除剤:市場規模と予測 2024-2029
- 飼料添加物:市場規模と予測 2024-2029
- その他:市場規模と予測 2024-2029
- 市場機会:製品別
第10章 市場セグメンテーション:投与経路別
- 市場セグメント
- 比較:投与経路別
- オーラル:市場規模と予測 2024-2029
- 注射:市場規模と予測 2024-2029
- 市場機会:投与経路別
第11章 市場セグメンテーション動物の種類別
- 市場セグメント
- 比較:動物の種類別
- 猫:市場規模と予測 2024-2029
- 犬:市場規模と予測 2024-2029
- 馬:市場規模と予測 2024-2029
- その他:市場規模と予測 2024-2029
- 市場機会:動物の種類別
第12章 顧客情勢
- 顧客情勢の概要
第13章 地域別情勢
- 地域別セグメンテーション
- 地域別比較
- 北米:市場規模と予測 2024-2029
- 欧州:市場規模と予測 2024-2029
- アジア:市場規模と予測 2024-2029
- 世界のその他の地域:市場規模と予測 2024-2029
- 米国:市場規模と予測 2024-2029
- ドイツ:市場規模と予測 2024-2029
- 中国:市場規模と予測 2024-2029
- カナダ:市場規模と予測 2024-2029
- フランス:市場規模と予測 2024-2029
- 日本:市場規模と予測 2024-2029
- 英国:市場規模と予測 2024-2029
- インド:市場規模と予測 2024-2029
- 韓国:市場規模と予測 2024-2029
- イタリア:市場規模と予測 2024-2029
- 市場機会:地域情勢別
第14章 促進要因・課題・機会・抑制要因
- 市場促進要因
- 市場の課題
- 促進要因と課題の影響
- 市場の機会・抑制要因
第15章 競合情勢
- 概要
- 競合情勢
- 混乱の状況
- 業界のリスク
第16章 競合分析
- 企業プロファイル
- 企業ランキング指数
- 企業の市場ポジショニング
- Bayer AG
- Beaphar Beheer BV
- Bimeda Holdings Ltd.
- Boehringer Ingelheim International GmbH
- Ceva Sante Animale
- Dechra Pharmaceuticals Plc
- Elanco Animal Health Inc.
- LABORATORIOS CALIER S.A
- Mars Inc.
- Merck and Co. Inc.
- Neogen Corp.
- Norbrook Laboratories Ltd.
- Vetoquinol SA
- Virbac Group
- Zoetis Inc.
第17章 付録
The companion animal specialty drugs market is forecasted to grow by USD 6541.2 million during 2024-2029, accelerating at a CAGR of 7.4% during the forecast period. The report on the companion animal specialty drugs market provides a holistic analysis, market size and forecast, trends, growth drivers, and challenges, as well as vendor analysis covering around 25 vendors.
The report offers an up-to-date analysis regarding the current market scenario, the latest trends and drivers, and the overall market environment. The market is driven by increase in pet humanization, rising awareness about disease prevention and pet insurance, and rise in aging companion animal population.
| Market Scope | |
|---|---|
| Base Year | 2025 |
| End Year | 2029 |
| Series Year | 2025-2029 |
| Growth Momentum | Accelerate |
| YOY 2025 | 6.8% |
| CAGR | 7.4% |
| Incremental Value | $6541.2 mn |
The study was conducted using an objective combination of primary and secondary information including inputs from key participants in the industry. The report contains a comprehensive market size data, segment with regional analysis and vendor landscape in addition to an analysis of the key companies. Reports have historic and forecast data.
Technavio's companion animal specialty drugs market is segmented as below:
By Distribution Channel
- Veterinary hospitals
- Pet care clinics
- Pharmacy stores
By Product
- Vaccines
- Antibiotics
- Parasiticides
- Feed additives
- Others
By Route Of Administration
- Oral
- Injectable
By Animal Type
- Cats
- Dogs
- Horses
- Others
By Geographical Landscape
- North America
- Europe
- Asia
- Rest of World (ROW)
This study identifies the enhanced companion animal specialty drug offerings as one of the prime reasons driving the companion animal specialty drugs market growth during the next few years. Also, increase in merger and acquisition in animal companion specialty drugs market and rising obesity in companion animals will lead to sizable demand in the market.
The report on the companion animal specialty drugs market covers the following areas:
- Companion Animal Specialty Drugs Market sizing
- Companion Animal Specialty Drugs Market forecast
- Companion Animal Specialty Drugs Market industry analysis
The robust vendor analysis is designed to help clients improve their market position, and in line with this, this report provides a detailed analysis of several leading companion animal specialty drugs market vendors that include Bayer AG, Beaphar Beheer BV, Bimeda Holdings Ltd., Boehringer Ingelheim International GmbH, Ceva Sante Animale, Chanelle Pharma Group, Dechra Pharmaceuticals PLC, Elanco Animal Health Inc., Kyoritsuseiyaku Corp., LABORATORIOS CALIER S.A, Mars Inc., Merck and Co. Inc., Neogen Corp., Norbrook Laboratories Ltd., Orion Corp., Tianjin ringpu bio-technology Co. Ltd., Vetoquinol SA, Virbac Group, Zenex Animal Health India Private Ltd., and Zoetis Inc.. Also, the companion animal specialty drugs market analysis report includes information on upcoming trends and challenges that will influence market growth. This is to help companies strategize and leverage all forthcoming growth opportunities.
The publisher presents a detailed picture of the market by the way of study, synthesis, and summation of data from multiple sources by an analysis of key parameters such as profit, pricing, competition, and promotions. It presents various market facets by identifying the key industry influencers. The data presented is comprehensive, reliable, and a result of extensive primary and secondary research. The market research reports provide a complete competitive landscape and an in-depth vendor selection methodology and analysis using qualitative and quantitative research to forecast accurate market growth.
Table of Contents
1 Executive Summary
- 1.1 Market overview
- Executive Summary - Chart on Market Overview
- Executive Summary - Data Table on Market Overview
- Executive Summary - Chart on Global Market Characteristics
- Executive Summary - Chart on Market By Geographical Landscape
- Executive Summary - Chart on Market Segmentation by Distribution Channel
- Executive Summary - Chart on Market Segmentation by Product
- Executive Summary - Chart on Market Segmentation by Route of Administration
- Executive Summary - Chart on Market Segmentation by Animal Type
- Executive Summary - Chart on Incremental Growth
- Executive Summary - Data Table on Incremental Growth
- Executive Summary - Chart on Company Market Positioning
2 Technavio Analysis
- 2.1 Analysis of price sensitivity, lifecycle, customer purchase basket, adoption rates, and purchase criteria
- Analysis of price sensitivity, lifecycle, customer purchase basket, adoption rates, and purchase criteria
- 2.2 Criticality of inputs and Factors of differentiation
- Overview on criticality of inputs and factors of differentiation
- 2.3 Factors of disruption
- Overview on factors of disruption
- 2.4 Impact of drivers and challenges
- Impact of drivers and challenges in 2024 and 2029
3 Market Landscape
- 3.1 Market ecosystem
- Parent Market
- Data Table on - Parent Market
- 3.2 Market characteristics
- Market characteristics analysis
- 3.3 Value chain analysis
- Value chain analysis
4 Market Sizing
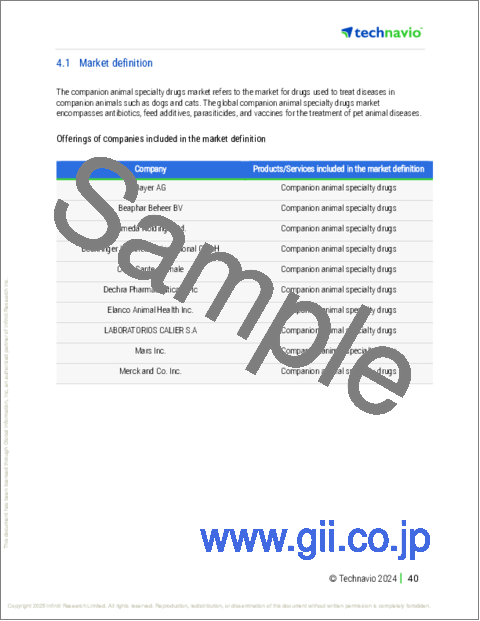
- 4.1 Market definition
- Offerings of companies included in the market definition
- 4.2 Market segment analysis
- Market segments
- 4.3 Market size 2024
- 4.4 Market outlook: Forecast for 2024-2029
- Chart on Global - Market size and forecast 2024-2029 ($ million)
- Data Table on Global - Market size and forecast 2024-2029 ($ million)
- Chart on Global Market: Year-over-year growth 2024-2029 (%)
- Data Table on Global Market: Year-over-year growth 2024-2029 (%)
5 Historic Market Size
- 5.1 Global Companion Animal Specialty Drugs Market 2019 - 2023
- Historic Market Size - Data Table on Global Companion Animal Specialty Drugs Market 2019 - 2023 ($ million)
- 5.2 Distribution Channel segment analysis 2019 - 2023
- Historic Market Size - Distribution Channel Segment 2019 - 2023 ($ million)
- 5.3 Product segment analysis 2019 - 2023
- Historic Market Size - Product Segment 2019 - 2023 ($ million)
- 5.4 Route of Administration segment analysis 2019 - 2023
- Historic Market Size - Route of Administration Segment 2019 - 2023 ($ million)
- 5.5 Animal Type segment analysis 2019 - 2023
- Historic Market Size - Animal Type Segment 2019 - 2023 ($ million)
- 5.6 Geography segment analysis 2019 - 2023
- Historic Market Size - Geography Segment 2019 - 2023 ($ million)
- 5.7 Country segment analysis 2019 - 2023
- Historic Market Size - Country Segment 2019 - 2023 ($ million)
6 Qualitative Analysis
- 6.1 Impact of AI on Companion Animal Specialty Drugs Market
7 Five Forces Analysis
- 7.1 Five forces summary
- Five forces analysis - Comparison between 2024 and 2029
- 7.2 Bargaining power of buyers
- Bargaining power of buyers - Impact of key factors 2024 and 2029
- 7.3 Bargaining power of suppliers
- Bargaining power of suppliers - Impact of key factors in 2024 and 2029
- 7.4 Threat of new entrants
- Threat of new entrants - Impact of key factors in 2024 and 2029
- 7.5 Threat of substitutes
- Threat of substitutes - Impact of key factors in 2024 and 2029
- 7.6 Threat of rivalry
- Threat of rivalry - Impact of key factors in 2024 and 2029
- 7.7 Market condition
- Chart on Market condition - Five forces 2024 and 2029
8 Market Segmentation by Distribution Channel
- 8.1 Market segments
- Chart on Distribution Channel - Market share 2024-2029 (%)
- Data Table on Distribution Channel - Market share 2024-2029 (%)
- 8.2 Comparison by Distribution Channel
- Chart on Comparison by Distribution Channel
- Data Table on Comparison by Distribution Channel
- 8.3 Veterinary hospitals - Market size and forecast 2024-2029
- Chart on Veterinary hospitals - Market size and forecast 2024-2029 ($ million)
- Data Table on Veterinary hospitals - Market size and forecast 2024-2029 ($ million)
- Chart on Veterinary hospitals - Year-over-year growth 2024-2029 (%)
- Data Table on Veterinary hospitals - Year-over-year growth 2024-2029 (%)
- 8.4 Pet care clinics - Market size and forecast 2024-2029
- Chart on Pet care clinics - Market size and forecast 2024-2029 ($ million)
- Data Table on Pet care clinics - Market size and forecast 2024-2029 ($ million)
- Chart on Pet care clinics - Year-over-year growth 2024-2029 (%)
- Data Table on Pet care clinics - Year-over-year growth 2024-2029 (%)
- 8.5 Pharmacy stores - Market size and forecast 2024-2029
- Chart on Pharmacy stores - Market size and forecast 2024-2029 ($ million)
- Data Table on Pharmacy stores - Market size and forecast 2024-2029 ($ million)
- Chart on Pharmacy stores - Year-over-year growth 2024-2029 (%)
- Data Table on Pharmacy stores - Year-over-year growth 2024-2029 (%)
- 8.6 Market opportunity by Distribution Channel
- Market opportunity by Distribution Channel ($ million)
- Data Table on Market opportunity by Distribution Channel ($ million)
9 Market Segmentation by Product
- 9.1 Market segments
- Chart on Product - Market share 2024-2029 (%)
- Data Table on Product - Market share 2024-2029 (%)
- 9.2 Comparison by Product
- Chart on Comparison by Product
- Data Table on Comparison by Product
- 9.3 Vaccines - Market size and forecast 2024-2029
- Chart on Vaccines - Market size and forecast 2024-2029 ($ million)
- Data Table on Vaccines - Market size and forecast 2024-2029 ($ million)
- Chart on Vaccines - Year-over-year growth 2024-2029 (%)
- Data Table on Vaccines - Year-over-year growth 2024-2029 (%)
- 9.4 Antibiotics - Market size and forecast 2024-2029
- Chart on Antibiotics - Market size and forecast 2024-2029 ($ million)
- Data Table on Antibiotics - Market size and forecast 2024-2029 ($ million)
- Chart on Antibiotics - Year-over-year growth 2024-2029 (%)
- Data Table on Antibiotics - Year-over-year growth 2024-2029 (%)
- 9.5 Parasiticides - Market size and forecast 2024-2029
- Chart on Parasiticides - Market size and forecast 2024-2029 ($ million)
- Data Table on Parasiticides - Market size and forecast 2024-2029 ($ million)
- Chart on Parasiticides - Year-over-year growth 2024-2029 (%)
- Data Table on Parasiticides - Year-over-year growth 2024-2029 (%)
- 9.6 Feed additives - Market size and forecast 2024-2029
- Chart on Feed additives - Market size and forecast 2024-2029 ($ million)
- Data Table on Feed additives - Market size and forecast 2024-2029 ($ million)
- Chart on Feed additives - Year-over-year growth 2024-2029 (%)
- Data Table on Feed additives - Year-over-year growth 2024-2029 (%)
- 9.7 Others - Market size and forecast 2024-2029
- Chart on Others - Market size and forecast 2024-2029 ($ million)
- Data Table on Others - Market size and forecast 2024-2029 ($ million)
- Chart on Others - Year-over-year growth 2024-2029 (%)
- Data Table on Others - Year-over-year growth 2024-2029 (%)
- 9.8 Market opportunity by Product
- Market opportunity by Product ($ million)
- Data Table on Market opportunity by Product ($ million)
10 Market Segmentation by Route of Administration
- 10.1 Market segments
- Chart on Route of Administration - Market share 2024-2029 (%)
- Data Table on Route of Administration - Market share 2024-2029 (%)
- 10.2 Comparison by Route of Administration
- Chart on Comparison by Route of Administration
- Data Table on Comparison by Route of Administration
- 10.3 Oral - Market size and forecast 2024-2029
- Chart on Oral - Market size and forecast 2024-2029 ($ million)
- Data Table on Oral - Market size and forecast 2024-2029 ($ million)
- Chart on Oral - Year-over-year growth 2024-2029 (%)
- Data Table on Oral - Year-over-year growth 2024-2029 (%)
- 10.4 Injectable - Market size and forecast 2024-2029
- Chart on Injectable - Market size and forecast 2024-2029 ($ million)
- Data Table on Injectable - Market size and forecast 2024-2029 ($ million)
- Chart on Injectable - Year-over-year growth 2024-2029 (%)
- Data Table on Injectable - Year-over-year growth 2024-2029 (%)
- 10.5 Market opportunity by Route of Administration
- Market opportunity by Route of Administration ($ million)
- Data Table on Market opportunity by Route of Administration ($ million)
11 Market Segmentation by Animal Type
- 11.1 Market segments
- Chart on Animal Type - Market share 2024-2029 (%)
- Data Table on Animal Type - Market share 2024-2029 (%)
- 11.2 Comparison by Animal Type
- Chart on Comparison by Animal Type
- Data Table on Comparison by Animal Type
- 11.3 Cats - Market size and forecast 2024-2029
- Chart on Cats - Market size and forecast 2024-2029 ($ million)
- Data Table on Cats - Market size and forecast 2024-2029 ($ million)
- Chart on Cats - Year-over-year growth 2024-2029 (%)
- Data Table on Cats - Year-over-year growth 2024-2029 (%)
- 11.4 Dogs - Market size and forecast 2024-2029
- Chart on Dogs - Market size and forecast 2024-2029 ($ million)
- Data Table on Dogs - Market size and forecast 2024-2029 ($ million)
- Chart on Dogs - Year-over-year growth 2024-2029 (%)
- Data Table on Dogs - Year-over-year growth 2024-2029 (%)
- 11.5 Horses - Market size and forecast 2024-2029
- Chart on Horses - Market size and forecast 2024-2029 ($ million)
- Data Table on Horses - Market size and forecast 2024-2029 ($ million)
- Chart on Horses - Year-over-year growth 2024-2029 (%)
- Data Table on Horses - Year-over-year growth 2024-2029 (%)
- 11.6 Others - Market size and forecast 2024-2029
- Chart on Others - Market size and forecast 2024-2029 ($ million)
- Data Table on Others - Market size and forecast 2024-2029 ($ million)
- Chart on Others - Year-over-year growth 2024-2029 (%)
- Data Table on Others - Year-over-year growth 2024-2029 (%)
- 11.7 Market opportunity by Animal Type
- Market opportunity by Animal Type ($ million)
- Data Table on Market opportunity by Animal Type ($ million)
12 Customer Landscape
- 12.1 Customer landscape overview
- Analysis of price sensitivity, lifecycle, customer purchase basket, adoption rates, and purchase criteria
13 Geographic Landscape
- 13.1 Geographic segmentation
- Chart on Market share By Geographical Landscape 2024-2029 (%)
- Data Table on Market share By Geographical Landscape 2024-2029 (%)
- 13.2 Geographic comparison
- Chart on Geographic comparison
- Data Table on Geographic comparison
- 13.3 North America - Market size and forecast 2024-2029
- Chart on North America - Market size and forecast 2024-2029 ($ million)
- Data Table on North America - Market size and forecast 2024-2029 ($ million)
- Chart on North America - Year-over-year growth 2024-2029 (%)
- Data Table on North America - Year-over-year growth 2024-2029 (%)
- 13.4 Europe - Market size and forecast 2024-2029
- Chart on Europe - Market size and forecast 2024-2029 ($ million)
- Data Table on Europe - Market size and forecast 2024-2029 ($ million)
- Chart on Europe - Year-over-year growth 2024-2029 (%)
- Data Table on Europe - Year-over-year growth 2024-2029 (%)
- 13.5 Asia - Market size and forecast 2024-2029
- Chart on Asia - Market size and forecast 2024-2029 ($ million)
- Data Table on Asia - Market size and forecast 2024-2029 ($ million)
- Chart on Asia - Year-over-year growth 2024-2029 (%)
- Data Table on Asia - Year-over-year growth 2024-2029 (%)
- 13.6 Rest of World (ROW) - Market size and forecast 2024-2029
- Chart on Rest of World (ROW) - Market size and forecast 2024-2029 ($ million)
- Data Table on Rest of World (ROW) - Market size and forecast 2024-2029 ($ million)
- Chart on Rest of World (ROW) - Year-over-year growth 2024-2029 (%)
- Data Table on Rest of World (ROW) - Year-over-year growth 2024-2029 (%)
- 13.7 US - Market size and forecast 2024-2029
- Chart on US - Market size and forecast 2024-2029 ($ million)
- Data Table on US - Market size and forecast 2024-2029 ($ million)
- Chart on US - Year-over-year growth 2024-2029 (%)
- Data Table on US - Year-over-year growth 2024-2029 (%)
- 13.8 Germany - Market size and forecast 2024-2029
- Chart on Germany - Market size and forecast 2024-2029 ($ million)
- Data Table on Germany - Market size and forecast 2024-2029 ($ million)
- Chart on Germany - Year-over-year growth 2024-2029 (%)
- Data Table on Germany - Year-over-year growth 2024-2029 (%)
- 13.9 China - Market size and forecast 2024-2029
- Chart on China - Market size and forecast 2024-2029 ($ million)
- Data Table on China - Market size and forecast 2024-2029 ($ million)
- Chart on China - Year-over-year growth 2024-2029 (%)
- Data Table on China - Year-over-year growth 2024-2029 (%)
- 13.10 Canada - Market size and forecast 2024-2029
- Chart on Canada - Market size and forecast 2024-2029 ($ million)
- Data Table on Canada - Market size and forecast 2024-2029 ($ million)
- Chart on Canada - Year-over-year growth 2024-2029 (%)
- Data Table on Canada - Year-over-year growth 2024-2029 (%)
- 13.11 France - Market size and forecast 2024-2029
- Chart on France - Market size and forecast 2024-2029 ($ million)
- Data Table on France - Market size and forecast 2024-2029 ($ million)
- Chart on France - Year-over-year growth 2024-2029 (%)
- Data Table on France - Year-over-year growth 2024-2029 (%)
- 13.12 Japan - Market size and forecast 2024-2029
- Chart on Japan - Market size and forecast 2024-2029 ($ million)
- Data Table on Japan - Market size and forecast 2024-2029 ($ million)
- Chart on Japan - Year-over-year growth 2024-2029 (%)
- Data Table on Japan - Year-over-year growth 2024-2029 (%)
- 13.13 UK - Market size and forecast 2024-2029
- Chart on UK - Market size and forecast 2024-2029 ($ million)
- Data Table on UK - Market size and forecast 2024-2029 ($ million)
- Chart on UK - Year-over-year growth 2024-2029 (%)
- Data Table on UK - Year-over-year growth 2024-2029 (%)
- 13.14 India - Market size and forecast 2024-2029
- Chart on India - Market size and forecast 2024-2029 ($ million)
- Data Table on India - Market size and forecast 2024-2029 ($ million)
- Chart on India - Year-over-year growth 2024-2029 (%)
- Data Table on India - Year-over-year growth 2024-2029 (%)
- 13.15 South Korea - Market size and forecast 2024-2029
- Chart on South Korea - Market size and forecast 2024-2029 ($ million)
- Data Table on South Korea - Market size and forecast 2024-2029 ($ million)
- Chart on South Korea - Year-over-year growth 2024-2029 (%)
- Data Table on South Korea - Year-over-year growth 2024-2029 (%)
- 13.16 Italy - Market size and forecast 2024-2029
- Chart on Italy - Market size and forecast 2024-2029 ($ million)
- Data Table on Italy - Market size and forecast 2024-2029 ($ million)
- Chart on Italy - Year-over-year growth 2024-2029 (%)
- Data Table on Italy - Year-over-year growth 2024-2029 (%)
- 13.17 Market opportunity By Geographical Landscape
- Market opportunity By Geographical Landscape ($ million)
- Data Tables on Market opportunity By Geographical Landscape ($ million)
14 Drivers, Challenges, and Opportunity/Restraints
- 14.1 Market drivers
- 14.2 Market challenges
- 14.3 Impact of drivers and challenges
- Impact of drivers and challenges in 2024 and 2029
- 14.4 Market opportunities/restraints
15 Competitive Landscape
- 15.1 Overview
- 15.2 Competitive Landscape
- Overview on criticality of inputs and factors of differentiation
- 15.3 Landscape disruption
- Overview on factors of disruption
- 15.4 Industry risks
- Impact of key risks on business
16 Competitive Analysis
- 16.1 Companies profiled
- Companies covered
- 16.2 Company ranking index
- Company ranking index
- 16.3 Market positioning of companies
- Matrix on companies position and classification
- 16.4 Bayer AG
- Bayer AG - Overview
- Bayer AG - Business segments
- Bayer AG - Key news
- Bayer AG - Key offerings
- Bayer AG - Segment focus
- SWOT
- 16.5 Beaphar Beheer BV
- Beaphar Beheer BV - Overview
- Beaphar Beheer BV - Product / Service
- Beaphar Beheer BV - Key offerings
- SWOT
- 16.6 Bimeda Holdings Ltd.
- Bimeda Holdings Ltd. - Overview
- Bimeda Holdings Ltd. - Product / Service
- Bimeda Holdings Ltd. - Key offerings
- SWOT
- 16.7 Boehringer Ingelheim International GmbH
- Boehringer Ingelheim International GmbH - Overview
- Boehringer Ingelheim International GmbH - Product / Service
- Boehringer Ingelheim International GmbH - Key news
- Boehringer Ingelheim International GmbH - Key offerings
- SWOT
- 16.8 Ceva Sante Animale
- Ceva Sante Animale - Overview
- Ceva Sante Animale - Product / Service
- Ceva Sante Animale - Key offerings
- SWOT
- 16.9 Dechra Pharmaceuticals Plc
- Dechra Pharmaceuticals Plc - Overview
- Dechra Pharmaceuticals Plc - Business segments
- Dechra Pharmaceuticals Plc - Key offerings
- Dechra Pharmaceuticals Plc - Segment focus
- SWOT
- 16.10 Elanco Animal Health Inc.
- Elanco Animal Health Inc. - Overview
- Elanco Animal Health Inc. - Product / Service
- Elanco Animal Health Inc. - Key offerings
- SWOT
- 16.11 LABORATORIOS CALIER S.A
- LABORATORIOS CALIER S.A - Overview
- LABORATORIOS CALIER S.A - Product / Service
- LABORATORIOS CALIER S.A - Key offerings
- SWOT
- 16.12 Mars Inc.
- Mars Inc. - Overview
- Mars Inc. - Product / Service
- Mars Inc. - Key news
- Mars Inc. - Key offerings
- SWOT
- 16.13 Merck and Co. Inc.
- Merck and Co. Inc. - Overview
- Merck and Co. Inc. - Business segments
- Merck and Co. Inc. - Key news
- Merck and Co. Inc. - Key offerings
- Merck and Co. Inc. - Segment focus
- SWOT
- 16.14 Neogen Corp.
- Neogen Corp. - Overview
- Neogen Corp. - Business segments
- Neogen Corp. - Key offerings
- Neogen Corp. - Segment focus
- SWOT
- 16.15 Norbrook Laboratories Ltd.
- Norbrook Laboratories Ltd. - Overview
- Norbrook Laboratories Ltd. - Product / Service
- Norbrook Laboratories Ltd. - Key offerings
- SWOT
- 16.16 Vetoquinol SA
- Vetoquinol SA - Overview
- Vetoquinol SA - Business segments
- Vetoquinol SA - Key offerings
- Vetoquinol SA - Segment focus
- SWOT
- 16.17 Virbac Group
- Virbac Group - Overview
- Virbac Group - Business segments
- Virbac Group - Key offerings
- Virbac Group - Segment focus
- SWOT
- 16.18 Zoetis Inc.
- Zoetis Inc. - Overview
- Zoetis Inc. - Business segments
- Zoetis Inc. - Key news
- Zoetis Inc. - Key offerings
- Zoetis Inc. - Segment focus
- SWOT
17 Appendix
- 17.1 Scope of the report
- 17.2 Inclusions and exclusions checklist
- Inclusions checklist
- Exclusions checklist
- 17.3 Currency conversion rates for US$
- Currency conversion rates for US$
- 17.4 Research methodology
- Research methodology
- 17.5 Data procurement
- Information sources
- 17.6 Data validation
- Data validation
- 17.7 Validation techniques employed for market sizing
- Validation techniques employed for market sizing
- 17.8 Data synthesis
- Data synthesis
- 17.9 360 degree market analysis
- 360 degree market analysis
- 17.10 List of abbreviations
- List of abbreviations

