|
|
市場調査レポート
商品コード
1660786
産業用エネルギー効率化サービスの世界市場(2025年~2029年)Global Industrial Energy Efficiency Services Market 2025-2029 |
||||||

|
|||||||
カスタマイズ可能
|
|||||||


| 産業用エネルギー効率化サービスの世界市場(2025年~2029年) |
|
出版日: 2025年02月16日
発行: TechNavio
ページ情報: 英文 249 Pages
納期: 即納可能
|

全表示
- 概要
- 目次
世界の産業用エネルギー効率化サービスの市場規模は、2024年~2029年に38億1,790万米ドルに達し、予測期間中のCAGRは5.1%で成長すると予測されています。
当レポートでは、産業用エネルギー効率化サービス市場の全体的な分析、市場規模・予測、動向、成長促進要因、課題、約25のベンダーを網羅したベンダー分析などを掲載しています。
当レポートは、現在の市場シナリオ、最新動向と促進要因、市場環境全体に関する最新分析を提供しています。市場は、環境への影響と持続可能性に関する意識の高まり、エネルギー効率の高い機器の使用を求める規制の増加、EPCモデルを推進する技術革新によって牽引されています。
| 市場範囲 | |
|---|---|
| 基準年 | 2025年 |
| 終了年 | 2029年 |
| 予測期間 | 2025年~2029年 |
| 成長モメンタム | 加速 |
| 前年比2025年 | 4.6% |
| CAGR | 5.1% |
| 増分額 | 38億1,790万米ドル |
本調査は、業界の主要参入企業からのインプットを含め、一次情報と二次情報を客観的に組み合わせて実施しました。レポートには、主要企業の分析に加え、包括的な市場規模データ、地域分析によるセグメント、ベンダー情勢が含まれています。レポートには実績データと予測データがあります。
本調査では、今後数年間の産業用エネルギー効率化サービス市場の成長を促進する主な理由の1つとして、再生可能エネルギーの利用への注目の高まりを挙げています。また、市場統合活動の増加や、エネルギー効率の可能性を活用するためのIoTの採用拡大も、市場の大きな需要につながる見込みです。
目次
第1章 エグゼクティブサマリー
- 市場概要
第2章 Technavioの分析
- 価格感度・ライフサイクル・顧客購入バスケット・採用率・購入基準の分析
- インプットの重要性と差別化の要因
- ディスラプションの要因
- 促進要因と課題の影響
第3章 市場情勢
- 市場エコシステム
- 市場の特徴
- バリューチェーン分析
第4章 市場規模
- 市場の定義
- 市場セグメント分析
- 市場規模(2024年)
- 市場の見通し(2024年~2029年)
第5章 市場規模実績
- 産業用エネルギー効率化サービスの世界市場(2019年~2023年)
- サービスセグメント分析(2019年~2023年)
- エンドユーザーセグメント分析(2019年~2023年)
- 展開セグメント分析(2019年~2023年)
- 収益源セグメント分析(2019年~2023年)
- 地域セグメント分析(2019年~2023年)
- 国セグメント分析(2019年~2023年)
第6章 定性分析
- AIの影響:産業用エネルギー効率化サービスの世界市場
第7章 ファイブフォース分析
- ファイブフォースの要約
- 買い手の交渉力
- 供給企業の交渉力
- 新規参入業者の脅威
- 代替品の脅威
- 競争の脅威
- 市況
第8章 市場セグメンテーション:サービス別
- 市場セグメント
- 比較:サービス別
- EAとC:市場規模と予測(2024年~2029年)
- 監視と検証:市場規模と予測(2024年~2029年)
- 製品とシステムの最適化:市場規模と予測(2024年~2029年)
- 市場機会:サービス別
第9章 市場セグメンテーション:エンドユーザー別
- 市場セグメント
- 比較:エンドユーザー別
- 石油・ガス:市場規模と予測(2024年~2029年)
- 電力:市場規模と予測(2024年~2029年)
- 石油化学製品・化学製品:市場規模と予測(2024年~2029年)
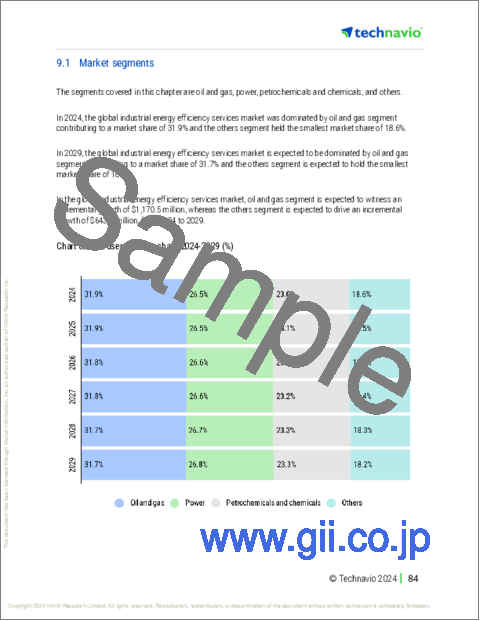
- その他:市場規模と予測(2024年~2029年)
- 市場機会:エンドユーザー別
第10章 市場セグメンテーション:展開別
- 市場セグメント
- 比較:展開別
- クラウドベース:市場規模と予測(2024年~2029年)
- オンプレミス:市場規模と予測(2024年~2029年)
- 市場機会:展開別
第11章 市場セグメンテーション:収益源別
- 市場セグメント
- 比較:収益源別
- Energy-as-a-Service(EaaS):市場規模と予測(2024年~2029年)
- 実績ベース契約:市場規模と予測(2024年~2029年)
- サブスクリプションベースサービス:市場規模と予測(2024年~2029年)
- 単発のコンサルティング・実装:市場規模と予測(2024年~2029年)
- 市場機会:収益源別
第12章 顧客情勢
- 顧客情勢の概要
第13章 地域別情勢
- 地域別セグメンテーション
- 地域別比較
- 北米:市場規模と予測(2024年~2029年)
- 欧州:市場規模と予測(2024年~2029年)
- アジア太平洋:市場規模と予測(2024年~2029年)
- 南米:市場規模と予測(2024年~2029年)
- 中東・アフリカ:市場規模と予測(2024年~2029年)
- 米国:市場規模と予測(2024年~2029年)
- ドイツ:市場規模と予測(2024年~2029年)
- カナダ:市場規模と予測(2024年~2029年)
- 中国:市場規模と予測(2024年~2029年)
- 英国:市場規模と予測(2024年~2029年)
- 日本:市場規模と予測(2024年~2029年)
- フランス:市場規模と予測(2024年~2029年)
- インド:市場規模と予測(2024年~2029年)
- イタリア:市場規模と予測(2024年~2029年)
- 韓国:市場規模と予測(2024年~2029年)
- 市場機会:地域情勢別
第14章 促進要因・課題・機会・抑制要因
- 市場促進要因
- 市場の課題
- 促進要因と課題の影響
- 市場の機会・抑制要因
第15章 競合情勢
- 概要
- 競合情勢
- ディスラプションの状況
- 業界のリスク
第16章 競合分析
- 企業プロファイル
- 企業ランキング指数
- 企業の市場ポジショニング
- Ameresco Inc.
- DNV Group AS
- DuPont de Nemours Inc.
- Econoler Inc.
- Electricite de France SA
- Enel Spa
- ENGIE SA
- General Electric Co.
- Honeywell International Inc.
- John Wood Group PLC
- Johnson Controls International Plc
- Schneider Electric SE
- SGS SA
- Siemens AG
- Veolia
第17章 付録
The industrial energy efficiency services market is forecasted to grow by USD 3817.9 million during 2024-2029, accelerating at a CAGR of 5.1% during the forecast period. The report on the industrial energy efficiency services market provides a holistic analysis, market size and forecast, trends, growth drivers, and challenges, as well as vendor analysis covering around 25 vendors.
The report offers an up-to-date analysis regarding the current market scenario, the latest trends and drivers, and the overall market environment. The market is driven by growing awareness about environmental impact and sustainability, increasing number of regulations to use energy-efficient equipment, and technological innovation driving the EPC model.
| Market Scope | |
|---|---|
| Base Year | 2025 |
| End Year | 2029 |
| Series Year | 2025-2029 |
| Growth Momentum | Accelerate |
| YOY 2025 | 4.6% |
| CAGR | 5.1% |
| Incremental Value | $3817.9 mn |
The study was conducted using an objective combination of primary and secondary information including inputs from key participants in the industry. The report contains a comprehensive market size data, segment with regional analysis and vendor landscape in addition to an analysis of the key companies. Reports have historic and forecast data.
Technavio's industrial energy efficiency services market is segmented as below:
By Service
- EA and C
- Monitoring and verification
- Product and system optimization
By End-user
- Oil and gas
- Power
- Petrochemicals and chemicals
- Others
By Deployment
- Cloud-based
- On-premises
By Revenue Stream
- Energy-as-a-service (EaaS)
- Performance-based contracts
- Subscription-based services
- One-time consultation and implementation
By Geographical Landscape
- North America
- Europe
- APAC
- South America
- Middle East and Africa
This study identifies the rise in focus on using renewable energy as one of the prime reasons driving the industrial energy efficiency services market growth during the next few years. Also, increasing market consolidation activities and growing adoption of IOT to leverage energy efficiency potential will lead to sizable demand in the market.
The report on the industrial energy efficiency services market covers the following areas:
- Industrial Energy Efficiency Services Market sizing
- Industrial Energy Efficiency Services Market forecast
- Industrial Energy Efficiency Services Market industry analysis
The robust vendor analysis is designed to help clients improve their market position, and in line with this, this report provides a detailed analysis of several leading industrial energy efficiency services market vendors that include Ameresco Inc., CoolPlanet Ltd., DNV Group AS, DuPont de Nemours Inc., Econoler Inc., Electricite de France SA, Enel Spa, ENGIE SA, GE GETEC Holding GmbH, General Electric Co., Honeywell International Inc., John Wood Group PLC, Johnson Controls International PLC, Ramboll Group AS, Rockwell Automation Inc., Schneider Electric SE, SGS SA, Siemens AG, TotalEnergies SE, and Veolia. Also, the industrial energy efficiency services market analysis report includes information on upcoming trends and challenges that will influence market growth. This is to help companies strategize and leverage all forthcoming growth opportunities.
The publisher presents a detailed picture of the market by the way of study, synthesis, and summation of data from multiple sources by an analysis of key parameters such as profit, pricing, competition, and promotions. It presents various market facets by identifying the key industry influencers. The data presented is comprehensive, reliable, and a result of extensive primary and secondary research. The market research reports provide a complete competitive landscape and an in-depth vendor selection methodology and analysis using qualitative and quantitative research to forecast accurate market growth.
Table of Contents
1 Executive Summary
- 1.1 Market overview
- Executive Summary - Chart on Market Overview
- Executive Summary - Data Table on Market Overview
- Executive Summary - Chart on Global Market Characteristics
- Executive Summary - Chart on Market By Geographical Landscape
- Executive Summary - Chart on Market Segmentation by Service
- Executive Summary - Chart on Market Segmentation by End-user
- Executive Summary - Chart on Market Segmentation by Deployment
- Executive Summary - Chart on Market Segmentation by Revenue Stream
- Executive Summary - Chart on Incremental Growth
- Executive Summary - Data Table on Incremental Growth
- Executive Summary - Chart on Company Market Positioning
2 Technavio Analysis
- 2.1 Analysis of price sensitivity, lifecycle, customer purchase basket, adoption rates, and purchase criteria
- Analysis of price sensitivity, lifecycle, customer purchase basket, adoption rates, and purchase criteria
- 2.2 Criticality of inputs and Factors of differentiation
- Overview on criticality of inputs and factors of differentiation
- 2.3 Factors of disruption
- Overview on factors of disruption
- 2.4 Impact of drivers and challenges
- Impact of drivers and challenges in 2024 and 2029
3 Market Landscape
- 3.1 Market ecosystem
- Parent Market
- Data Table on - Parent Market
- 3.2 Market characteristics
- Market characteristics analysis
- 3.3 Value chain analysis
- Value chain analysis
4 Market Sizing
- 4.1 Market definition
- Offerings of companies included in the market definition
- 4.2 Market segment analysis
- Market segments
- 4.3 Market size 2024
- 4.4 Market outlook: Forecast for 2024-2029
- Chart on Global - Market size and forecast 2024-2029 ($ million)
- Data Table on Global - Market size and forecast 2024-2029 ($ million)
- Chart on Global Market: Year-over-year growth 2024-2029 (%)
- Data Table on Global Market: Year-over-year growth 2024-2029 (%)
5 Historic Market Size
- 5.1 Global Industrial Energy Efficiency Services Market 2019 - 2023
- Historic Market Size - Data Table on Global Industrial Energy Efficiency Services Market 2019 - 2023 ($ million)
- 5.2 Service segment analysis 2019 - 2023
- Historic Market Size - Service Segment 2019 - 2023 ($ million)
- 5.3 End-user segment analysis 2019 - 2023
- Historic Market Size - End-user Segment 2019 - 2023 ($ million)
- 5.4 Deployment segment analysis 2019 - 2023
- Historic Market Size - Deployment Segment 2019 - 2023 ($ million)
- 5.5 Revenue Stream segment analysis 2019 - 2023
- Historic Market Size - Revenue Stream Segment 2019 - 2023 ($ million)
- 5.6 Geography segment analysis 2019 - 2023
- Historic Market Size - Geography Segment 2019 - 2023 ($ million)
- 5.7 Country segment analysis 2019 - 2023
- Historic Market Size - Country Segment 2019 - 2023 ($ million)
6 Qualitative Analysis
- 6.1 Impact of AI on the global Industrial Energy Efficiency Services Market
7 Five Forces Analysis
- 7.1 Five forces summary
- Five forces analysis - Comparison between 2024 and 2029
- 7.2 Bargaining power of buyers
- Bargaining power of buyers - Impact of key factors 2024 and 2029
- 7.3 Bargaining power of suppliers
- Bargaining power of suppliers - Impact of key factors in 2024 and 2029
- 7.4 Threat of new entrants
- Threat of new entrants - Impact of key factors in 2024 and 2029
- 7.5 Threat of substitutes
- Threat of substitutes - Impact of key factors in 2024 and 2029
- 7.6 Threat of rivalry
- Threat of rivalry - Impact of key factors in 2024 and 2029
- 7.7 Market condition
- Chart on Market condition - Five forces 2024 and 2029
8 Market Segmentation by Service
- 8.1 Market segments
- Chart on Service - Market share 2024-2029 (%)
- Data Table on Service - Market share 2024-2029 (%)
- 8.2 Comparison by Service
- Chart on Comparison by Service
- Data Table on Comparison by Service
- 8.3 EA and C - Market size and forecast 2024-2029
- Chart on EA and C - Market size and forecast 2024-2029 ($ million)
- Data Table on EA and C - Market size and forecast 2024-2029 ($ million)
- Chart on EA and C - Year-over-year growth 2024-2029 (%)
- Data Table on EA and C - Year-over-year growth 2024-2029 (%)
- 8.4 Monitoring and verification - Market size and forecast 2024-2029
- Chart on Monitoring and verification - Market size and forecast 2024-2029 ($ million)
- Data Table on Monitoring and verification - Market size and forecast 2024-2029 ($ million)
- Chart on Monitoring and verification - Year-over-year growth 2024-2029 (%)
- Data Table on Monitoring and verification - Year-over-year growth 2024-2029 (%)
- 8.5 Product and system optimization - Market size and forecast 2024-2029
- Chart on Product and system optimization - Market size and forecast 2024-2029 ($ million)
- Data Table on Product and system optimization - Market size and forecast 2024-2029 ($ million)
- Chart on Product and system optimization - Year-over-year growth 2024-2029 (%)
- Data Table on Product and system optimization - Year-over-year growth 2024-2029 (%)
- 8.6 Market opportunity by Service
- Market opportunity by Service ($ million)
- Data Table on Market opportunity by Service ($ million)
9 Market Segmentation by End-user
- 9.1 Market segments
- Chart on End-user - Market share 2024-2029 (%)
- Data Table on End-user - Market share 2024-2029 (%)
- 9.2 Comparison by End-user
- Chart on Comparison by End-user
- Data Table on Comparison by End-user
- 9.3 Oil and gas - Market size and forecast 2024-2029
- Chart on Oil and gas - Market size and forecast 2024-2029 ($ million)
- Data Table on Oil and gas - Market size and forecast 2024-2029 ($ million)
- Chart on Oil and gas - Year-over-year growth 2024-2029 (%)
- Data Table on Oil and gas - Year-over-year growth 2024-2029 (%)
- 9.4 Power - Market size and forecast 2024-2029
- Chart on Power - Market size and forecast 2024-2029 ($ million)
- Data Table on Power - Market size and forecast 2024-2029 ($ million)
- Chart on Power - Year-over-year growth 2024-2029 (%)
- Data Table on Power - Year-over-year growth 2024-2029 (%)
- 9.5 Petrochemicals and chemicals - Market size and forecast 2024-2029
- Chart on Petrochemicals and chemicals - Market size and forecast 2024-2029 ($ million)
- Data Table on Petrochemicals and chemicals - Market size and forecast 2024-2029 ($ million)
- Chart on Petrochemicals and chemicals - Year-over-year growth 2024-2029 (%)
- Data Table on Petrochemicals and chemicals - Year-over-year growth 2024-2029 (%)
- 9.6 Others - Market size and forecast 2024-2029
- Chart on Others - Market size and forecast 2024-2029 ($ million)
- Data Table on Others - Market size and forecast 2024-2029 ($ million)
- Chart on Others - Year-over-year growth 2024-2029 (%)
- Data Table on Others - Year-over-year growth 2024-2029 (%)
- 9.7 Market opportunity by End-user
- Market opportunity by End-user ($ million)
- Data Table on Market opportunity by End-user ($ million)
10 Market Segmentation by Deployment
- 10.1 Market segments
- Chart on Deployment - Market share 2024-2029 (%)
- Data Table on Deployment - Market share 2024-2029 (%)
- 10.2 Comparison by Deployment
- Chart on Comparison by Deployment
- Data Table on Comparison by Deployment
- 10.3 Cloud-based - Market size and forecast 2024-2029
- Chart on Cloud-based - Market size and forecast 2024-2029 ($ million)
- Data Table on Cloud-based - Market size and forecast 2024-2029 ($ million)
- Chart on Cloud-based - Year-over-year growth 2024-2029 (%)
- Data Table on Cloud-based - Year-over-year growth 2024-2029 (%)
- 10.4 On-premises - Market size and forecast 2024-2029
- Chart on On-premises - Market size and forecast 2024-2029 ($ million)
- Data Table on On-premises - Market size and forecast 2024-2029 ($ million)
- Chart on On-premises - Year-over-year growth 2024-2029 (%)
- Data Table on On-premises - Year-over-year growth 2024-2029 (%)
- 10.5 Market opportunity by Deployment
- Market opportunity by Deployment ($ million)
- Data Table on Market opportunity by Deployment ($ million)
11 Market Segmentation by Revenue Stream
- 11.1 Market segments
- Chart on Revenue Stream - Market share 2024-2029 (%)
- Data Table on Revenue Stream - Market share 2024-2029 (%)
- 11.2 Comparison by Revenue Stream
- Chart on Comparison by Revenue Stream
- Data Table on Comparison by Revenue Stream
- 11.3 Energy-as-a-service (EaaS) - Market size and forecast 2024-2029
- Chart on Energy-as-a-service (EaaS) - Market size and forecast 2024-2029 ($ million)
- Data Table on Energy-as-a-service (EaaS) - Market size and forecast 2024-2029 ($ million)
- Chart on Energy-as-a-service (EaaS) - Year-over-year growth 2024-2029 (%)
- Data Table on Energy-as-a-service (EaaS) - Year-over-year growth 2024-2029 (%)
- 11.4 Performance-based contracts - Market size and forecast 2024-2029
- Chart on Performance-based contracts - Market size and forecast 2024-2029 ($ million)
- Data Table on Performance-based contracts - Market size and forecast 2024-2029 ($ million)
- Chart on Performance-based contracts - Year-over-year growth 2024-2029 (%)
- Data Table on Performance-based contracts - Year-over-year growth 2024-2029 (%)
- 11.5 Subscription-based services - Market size and forecast 2024-2029
- Chart on Subscription-based services - Market size and forecast 2024-2029 ($ million)
- Data Table on Subscription-based services - Market size and forecast 2024-2029 ($ million)
- Chart on Subscription-based services - Year-over-year growth 2024-2029 (%)
- Data Table on Subscription-based services - Year-over-year growth 2024-2029 (%)
- 11.6 One-time consultation and implementation - Market size and forecast 2024-2029
- Chart on One-time consultation and implementation - Market size and forecast 2024-2029 ($ million)
- Data Table on One-time consultation and implementation - Market size and forecast 2024-2029 ($ million)
- Chart on One-time consultation and implementation - Year-over-year growth 2024-2029 (%)
- Data Table on One-time consultation and implementation - Year-over-year growth 2024-2029 (%)
- 11.7 Market opportunity by Revenue Stream
- Market opportunity by Revenue Stream ($ million)
- Data Table on Market opportunity by Revenue Stream ($ million)
12 Customer Landscape
- 12.1 Customer landscape overview
- Analysis of price sensitivity, lifecycle, customer purchase basket, adoption rates, and purchase criteria
13 Geographic Landscape
- 13.1 Geographic segmentation
- Chart on Market share By Geographical Landscape 2024-2029 (%)
- Data Table on Market share By Geographical Landscape 2024-2029 (%)
- 13.2 Geographic comparison
- Chart on Geographic comparison
- Data Table on Geographic comparison
- 13.3 North America - Market size and forecast 2024-2029
- Chart on North America - Market size and forecast 2024-2029 ($ million)
- Data Table on North America - Market size and forecast 2024-2029 ($ million)
- Chart on North America - Year-over-year growth 2024-2029 (%)
- Data Table on North America - Year-over-year growth 2024-2029 (%)
- 13.4 Europe - Market size and forecast 2024-2029
- Chart on Europe - Market size and forecast 2024-2029 ($ million)
- Data Table on Europe - Market size and forecast 2024-2029 ($ million)
- Chart on Europe - Year-over-year growth 2024-2029 (%)
- Data Table on Europe - Year-over-year growth 2024-2029 (%)
- 13.5 APAC - Market size and forecast 2024-2029
- Chart on APAC - Market size and forecast 2024-2029 ($ million)
- Data Table on APAC - Market size and forecast 2024-2029 ($ million)
- Chart on APAC - Year-over-year growth 2024-2029 (%)
- Data Table on APAC - Year-over-year growth 2024-2029 (%)
- 13.6 South America - Market size and forecast 2024-2029
- Chart on South America - Market size and forecast 2024-2029 ($ million)
- Data Table on South America - Market size and forecast 2024-2029 ($ million)
- Chart on South America - Year-over-year growth 2024-2029 (%)
- Data Table on South America - Year-over-year growth 2024-2029 (%)
- 13.7 Middle East and Africa - Market size and forecast 2024-2029
- Chart on Middle East and Africa - Market size and forecast 2024-2029 ($ million)
- Data Table on Middle East and Africa - Market size and forecast 2024-2029 ($ million)
- Chart on Middle East and Africa - Year-over-year growth 2024-2029 (%)
- Data Table on Middle East and Africa - Year-over-year growth 2024-2029 (%)
- 13.8 US - Market size and forecast 2024-2029
- Chart on US - Market size and forecast 2024-2029 ($ million)
- Data Table on US - Market size and forecast 2024-2029 ($ million)
- Chart on US - Year-over-year growth 2024-2029 (%)
- Data Table on US - Year-over-year growth 2024-2029 (%)
- 13.9 Germany - Market size and forecast 2024-2029
- Chart on Germany - Market size and forecast 2024-2029 ($ million)
- Data Table on Germany - Market size and forecast 2024-2029 ($ million)
- Chart on Germany - Year-over-year growth 2024-2029 (%)
- Data Table on Germany - Year-over-year growth 2024-2029 (%)
- 13.10 Canada - Market size and forecast 2024-2029
- Chart on Canada - Market size and forecast 2024-2029 ($ million)
- Data Table on Canada - Market size and forecast 2024-2029 ($ million)
- Chart on Canada - Year-over-year growth 2024-2029 (%)
- Data Table on Canada - Year-over-year growth 2024-2029 (%)
- 13.11 China - Market size and forecast 2024-2029
- Chart on China - Market size and forecast 2024-2029 ($ million)
- Data Table on China - Market size and forecast 2024-2029 ($ million)
- Chart on China - Year-over-year growth 2024-2029 (%)
- Data Table on China - Year-over-year growth 2024-2029 (%)
- 13.12 UK - Market size and forecast 2024-2029
- Chart on UK - Market size and forecast 2024-2029 ($ million)
- Data Table on UK - Market size and forecast 2024-2029 ($ million)
- Chart on UK - Year-over-year growth 2024-2029 (%)
- Data Table on UK - Year-over-year growth 2024-2029 (%)
- 13.13 Japan - Market size and forecast 2024-2029
- Chart on Japan - Market size and forecast 2024-2029 ($ million)
- Data Table on Japan - Market size and forecast 2024-2029 ($ million)
- Chart on Japan - Year-over-year growth 2024-2029 (%)
- Data Table on Japan - Year-over-year growth 2024-2029 (%)
- 13.14 France - Market size and forecast 2024-2029
- Chart on France - Market size and forecast 2024-2029 ($ million)
- Data Table on France - Market size and forecast 2024-2029 ($ million)
- Chart on France - Year-over-year growth 2024-2029 (%)
- Data Table on France - Year-over-year growth 2024-2029 (%)
- 13.15 India - Market size and forecast 2024-2029
- Chart on India - Market size and forecast 2024-2029 ($ million)
- Data Table on India - Market size and forecast 2024-2029 ($ million)
- Chart on India - Year-over-year growth 2024-2029 (%)
- Data Table on India - Year-over-year growth 2024-2029 (%)
- 13.16 Italy - Market size and forecast 2024-2029
- Chart on Italy - Market size and forecast 2024-2029 ($ million)
- Data Table on Italy - Market size and forecast 2024-2029 ($ million)
- Chart on Italy - Year-over-year growth 2024-2029 (%)
- Data Table on Italy - Year-over-year growth 2024-2029 (%)
- 13.17 South Korea - Market size and forecast 2024-2029
- Chart on South Korea - Market size and forecast 2024-2029 ($ million)
- Data Table on South Korea - Market size and forecast 2024-2029 ($ million)
- Chart on South Korea - Year-over-year growth 2024-2029 (%)
- Data Table on South Korea - Year-over-year growth 2024-2029 (%)
- 13.18 Market opportunity By Geographical Landscape
- Market opportunity By Geographical Landscape ($ million)
- Data Tables on Market opportunity By Geographical Landscape ($ million)
14 Drivers, Challenges, and Opportunity/Restraints
- 14.1 Market drivers
- 14.2 Market challenges
- 14.3 Impact of drivers and challenges
- Impact of drivers and challenges in 2024 and 2029
- 14.4 Market opportunities/restraints
15 Competitive Landscape
- 15.1 Overview
- 15.2 Competitive Landscape
- Overview on criticality of inputs and factors of differentiation
- 15.3 Landscape disruption
- Overview on factors of disruption
- 15.4 Industry risks
- Impact of key risks on business
16 Competitive Analysis
- 16.1 Companies profiled
- Companies covered
- 16.2 Company ranking index
- Company ranking index
- 16.3 Market positioning of companies
- Matrix on companies position and classification
- 16.4 Ameresco Inc.
- Ameresco Inc. - Overview
- Ameresco Inc. - Business segments
- Ameresco Inc. - Key news
- Ameresco Inc. - Key offerings
- Ameresco Inc. - Segment focus
- SWOT
- 16.5 DNV Group AS
- DNV Group AS - Overview
- DNV Group AS - Business segments
- DNV Group AS - Key offerings
- DNV Group AS - Segment focus
- SWOT
- 16.6 DuPont de Nemours Inc.
- DuPont de Nemours Inc. - Overview
- DuPont de Nemours Inc. - Business segments
- DuPont de Nemours Inc. - Key news
- DuPont de Nemours Inc. - Key offerings
- DuPont de Nemours Inc. - Segment focus
- SWOT
- 16.7 Econoler Inc.
- Econoler Inc. - Overview
- Econoler Inc. - Product / Service
- Econoler Inc. - Key offerings
- SWOT
- 16.8 Electricite de France SA
- Electricite de France SA - Overview
- Electricite de France SA - Business segments
- Electricite de France SA - Key offerings
- Electricite de France SA - Segment focus
- SWOT
- 16.9 Enel Spa
- Enel Spa - Overview
- Enel Spa - Product / Service
- Enel Spa - Key news
- Enel Spa - Key offerings
- SWOT
- 16.10 ENGIE SA
- ENGIE SA - Overview
- ENGIE SA - Business segments
- ENGIE SA - Key offerings
- ENGIE SA - Segment focus
- SWOT
- 16.11 General Electric Co.
- General Electric Co. - Overview
- General Electric Co. - Business segments
- General Electric Co. - Key news
- General Electric Co. - Key offerings
- General Electric Co. - Segment focus
- SWOT
- 16.12 Honeywell International Inc.
- Honeywell International Inc. - Overview
- Honeywell International Inc. - Business segments
- Honeywell International Inc. - Key news
- Honeywell International Inc. - Key offerings
- Honeywell International Inc. - Segment focus
- SWOT
- 16.13 John Wood Group PLC
- John Wood Group PLC - Overview
- John Wood Group PLC - Business segments
- John Wood Group PLC - Key offerings
- John Wood Group PLC - Segment focus
- SWOT
- 16.14 Johnson Controls International Plc
- Johnson Controls International Plc - Overview
- Johnson Controls International Plc - Business segments
- Johnson Controls International Plc - Key news
- Johnson Controls International Plc - Key offerings
- Johnson Controls International Plc - Segment focus
- SWOT
- 16.15 Schneider Electric SE
- Schneider Electric SE - Overview
- Schneider Electric SE - Business segments
- Schneider Electric SE - Key news
- Schneider Electric SE - Key offerings
- Schneider Electric SE - Segment focus
- SWOT
- 16.16 SGS SA
- SGS SA - Overview
- SGS SA - Business segments
- SGS SA - Key news
- SGS SA - Key offerings
- SGS SA - Segment focus
- SWOT
- 16.17 Siemens AG
- Siemens AG - Overview
- Siemens AG - Business segments
- Siemens AG - Key news
- Siemens AG - Key offerings
- Siemens AG - Segment focus
- SWOT
- 16.18 Veolia
- Veolia - Overview
- Veolia - Business segments
- Veolia - Key news
- Veolia - Key offerings
- Veolia - Segment focus
- SWOT
17 Appendix
- 17.1 Scope of the report
- 17.2 Inclusions and exclusions checklist
- Inclusions checklist
- Exclusions checklist
- 17.3 Currency conversion rates for US$
- Currency conversion rates for US$
- 17.4 Research methodology
- Research methodology
- 17.5 Data procurement
- Information sources
- 17.6 Data validation
- Data validation
- 17.7 Validation techniques employed for market sizing
- Validation techniques employed for market sizing
- 17.8 Data synthesis
- Data synthesis
- 17.9 360 degree market analysis
- 360 degree market analysis
- 17.10 List of abbreviations
- List of abbreviations
