|
|
市場調査レポート
商品コード
1626986
身体障害者補助ロボットの世界市場、2024~2028年Global Handicap Assistance Robots Market 2024-2028 |
||||||

|
|||||||
カスタマイズ可能
|
|||||||


| 身体障害者補助ロボットの世界市場、2024~2028年 |
|
出版日: 2024年07月31日
発行: TechNavio
ページ情報: 英文 164 Pages
納期: 即納可能
|

全表示
- 概要
- 図表
- 目次
身体障害者補助ロボット市場、2024~2028年
身体障害者補助ロボット市場は2023~2028年に38億7,480万米ドル、予測期間中のCAGRは32.14%で成長すると予測されます。当レポートでは、身体障害者補助ロボット市場の全体的な分析、市場規模・予測、動向、成長促進要因、課題、約25のベンダーを網羅したベンダー分析などを掲載しています。
現在の市場シナリオ、最新動向と促進要因、市場環境全体に関する最新分析を提供しています。市場は、人工知能の進歩、新興国政府による支援ロボットへの支援、先進国の高齢化などが牽引しています。
| 市場範囲 | |
|---|---|
| 基準年 | 2024年 |
| 終了年 | 2028年 |
| 予測期間 | 2024~2028年 |
| 成長モメンタム | 加速 |
| 前年比[2024年] | 24.42% |
| CAGR | 32.14% |
| 増分額 | 38億7,480万米ドル |
本調査では、身体障害者補助ロボットとIoTの統合が、今後数年間の身体障害者補助ロボット市場の成長を促進する主要な理由の1つであると特定しています。また、ロボット技術の拡大や自律型ロボット車椅子の市場開拓は、市場の大きな需要につながります。
目次
第1章 エグゼクティブサマリー
- 市場概要
第2章 市場情勢
- 市場エコシステム
- 市場の特徴
- バリューチェーン分析
第3章 市場規模
- 市場の定義
- 市場セグメント分析
- 市場規模 2023年
- 市場の展望 2023~2028年
第4章 市場規模実績
- 身体障害者補助ロボットの世界市場 2018~2022年
- 製品別セグメント分析 2018~2022年
- タイプ別セグメント分析 2018~2022年
- 地域別セグメント分析 2018~2022年
- 国別セグメント分析 2018~2022年
第5章 ファイブフォース分析
- ファイブフォースの要約
- 買い手の交渉力
- 供給企業の交渉力
- 新規参入業者の脅威
- 代替品の脅威
- 競争の脅威
- 市況
第6章 市場セグメンテーション:製品別
- 市場セグメント
- 比較:製品別
- ロボット部品:市場規模と予測 2023~2028年
- ロボット車椅子:市場規模と予測 2023~2028年
- 市場機会:製品別
第7章 市場セグメンテーション:タイプ別
- 市場セグメント
- 比較:タイプ別
- 据置型:市場規模と予測 2023~2028年
- モビリティ:市場規模と予測 2023~2028年
- 市場機会:タイプ別
第8章 顧客情勢
- 顧客情勢概要
第9章 地域別情勢
- 地域別セグメンテーション
- 比較:地域別
- 北米:市場規模と予測 2023~2028年
- 欧州:市場規模と予測 2023~2028年
- アジア太平洋:市場規模と予測 2023~2028年
- 中東・アフリカ:市場規模と予測 2023~2028年
- 南米:市場規模と予測 2023~2028年
- 米国:市場規模と予測 2023~2028年
- ドイツ:市場規模と予測 2023~2028年
- スウェーデン:市場規模と予測 2023~2028年
- 日本:市場規模と予測 2023~2028年
- 英国:市場規模と予測 2023~2028年
- 地域情勢による市場機会
第10章 促進要因・課題・機会・抑制要因
- 市場促進要因
- 市場課題
- 促進要因と課題の影響
- 市場機会・抑制要因
第11章 競合情勢
- 概要
- 競合情勢
- 混乱の状況
- 産業のリスク
第12章 競合分析
- 企業プロファイル
- 企業の市場ポジショニング
- Assistive Innovations bv
- Bionic Yantra
- Cyberdyne Inc.
- Ekso Bionics Holdings Inc.
- Focal Meditech
- GOGOA Mobility Robots SL
- Honda Motor Co. Ltd.
- Kinova Inc.
- Ossur hf
- Ottobock SE and Co. KGaA
- Panasonic Holdings Corp.
- ReWalk Robotics Ltd.
- Rex Bionics Ltd.
- Toyota Motor Corp.
- Wandercraft
第13章 付録
Exhibits:
- Exhibits1: Executive Summary - Chart on Market Overview
- Exhibits2: Executive Summary - Data Table on Market Overview
- Exhibits3: Executive Summary - Chart on Global Market Characteristics
- Exhibits4: Executive Summary - Chart on Market By Geographical Landscape
- Exhibits5: Executive Summary - Chart on Market Segmentation by Product
- Exhibits6: Executive Summary - Chart on Market Segmentation by Type
- Exhibits7: Executive Summary - Chart on Incremental Growth
- Exhibits8: Executive Summary - Data Table on Incremental Growth
- Exhibits9: Executive Summary - Chart on Company Market Positioning
- Exhibits10: Parent Market
- Exhibits11: Data Table on - Parent Market
- Exhibits12: Market characteristics analysis
- Exhibits13: Value Chain Analysis
- Exhibits14: Offerings of companies included in the market definition
- Exhibits15: Market segments
- Exhibits16: Chart on Global - Market size and forecast 2023-2028 ($ million)
- Exhibits17: Data Table on Global - Market size and forecast 2023-2028 ($ million)
- Exhibits18: Chart on Global Market: Year-over-year growth 2023-2028 (%)
- Exhibits19: Data Table on Global Market: Year-over-year growth 2023-2028 (%)
- Exhibits20: Historic Market Size - Data Table on Global Handicap Assistance Robots Market 2018 - 2022 ($ million)
- Exhibits21: Historic Market Size - Product Segment 2018 - 2022 ($ million)
- Exhibits22: Historic Market Size - Type Segment 2018 - 2022 ($ million)
- Exhibits23: Historic Market Size - Geography Segment 2018 - 2022 ($ million)
- Exhibits24: Historic Market Size - Country Segment 2018 - 2022 ($ million)
- Exhibits25: Five forces analysis - Comparison between 2023 and 2028
- Exhibits26: Bargaining power of buyers - Impact of key factors 2023 and 2028
- Exhibits27: Bargaining power of suppliers - Impact of key factors in 2023 and 2028
- Exhibits28: Threat of new entrants - Impact of key factors in 2023 and 2028
- Exhibits29: Threat of substitutes - Impact of key factors in 2023 and 2028
- Exhibits30: Threat of rivalry - Impact of key factors in 2023 and 2028
- Exhibits31: Chart on Market condition - Five forces 2023 and 2028
- Exhibits32: Chart on Product - Market share 2023-2028 (%)
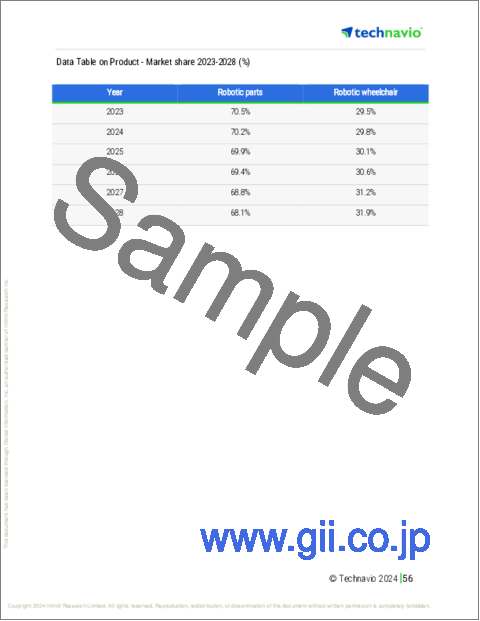
- Exhibits33: Data Table on Product - Market share 2023-2028 (%)
- Exhibits34: Chart on Comparison by Product
- Exhibits35: Data Table on Comparison by Product
- Exhibits36: Chart on Robotic parts - Market size and forecast 2023-2028 ($ million)
- Exhibits37: Data Table on Robotic parts - Market size and forecast 2023-2028 ($ million)
- Exhibits38: Chart on Robotic parts - Year-over-year growth 2023-2028 (%)
- Exhibits39: Data Table on Robotic parts - Year-over-year growth 2023-2028 (%)
- Exhibits40: Chart on Robotic wheelchair - Market size and forecast 2023-2028 ($ million)
- Exhibits41: Data Table on Robotic wheelchair - Market size and forecast 2023-2028 ($ million)
- Exhibits42: Chart on Robotic wheelchair - Year-over-year growth 2023-2028 (%)
- Exhibits43: Data Table on Robotic wheelchair - Year-over-year growth 2023-2028 (%)
- Exhibits44: Market opportunity by Product ($ million)
- Exhibits45: Data Table on Market opportunity by Product ($ million)
- Exhibits46: Chart on Type - Market share 2023-2028 (%)
- Exhibits47: Data Table on Type - Market share 2023-2028 (%)
- Exhibits48: Chart on Comparison by Type
- Exhibits49: Data Table on Comparison by Type
- Exhibits50: Chart on Stationary - Market size and forecast 2023-2028 ($ million)
- Exhibits51: Data Table on Stationary - Market size and forecast 2023-2028 ($ million)
- Exhibits52: Chart on Stationary - Year-over-year growth 2023-2028 (%)
- Exhibits53: Data Table on Stationary - Year-over-year growth 2023-2028 (%)
- Exhibits54: Chart on Mobility - Market size and forecast 2023-2028 ($ million)
- Exhibits55: Data Table on Mobility - Market size and forecast 2023-2028 ($ million)
- Exhibits56: Chart on Mobility - Year-over-year growth 2023-2028 (%)
- Exhibits57: Data Table on Mobility - Year-over-year growth 2023-2028 (%)
- Exhibits58: Market opportunity by Type ($ million)
- Exhibits59: Data Table on Market opportunity by Type ($ million)
- Exhibits60: Analysis of price sensitivity, lifecycle, customer purchase basket, adoption rates, and purchase criteria
- Exhibits61: Chart on Market share By Geographical Landscape 2023-2028 (%)
- Exhibits62: Data Table on Market share By Geographical Landscape 2023-2028 (%)
- Exhibits63: Chart on Geographic comparison
- Exhibits64: Data Table on Geographic comparison
- Exhibits65: Chart on North America - Market size and forecast 2023-2028 ($ million)
- Exhibits66: Data Table on North America - Market size and forecast 2023-2028 ($ million)
- Exhibits67: Chart on North America - Year-over-year growth 2023-2028 (%)
- Exhibits68: Data Table on North America - Year-over-year growth 2023-2028 (%)
- Exhibits69: Chart on Europe - Market size and forecast 2023-2028 ($ million)
- Exhibits70: Data Table on Europe - Market size and forecast 2023-2028 ($ million)
- Exhibits71: Chart on Europe - Year-over-year growth 2023-2028 (%)
- Exhibits72: Data Table on Europe - Year-over-year growth 2023-2028 (%)
- Exhibits73: Chart on APAC - Market size and forecast 2023-2028 ($ million)
- Exhibits74: Data Table on APAC - Market size and forecast 2023-2028 ($ million)
- Exhibits75: Chart on APAC - Year-over-year growth 2023-2028 (%)
- Exhibits76: Data Table on APAC - Year-over-year growth 2023-2028 (%)
- Exhibits77: Chart on Middle East and Africa - Market size and forecast 2023-2028 ($ million)
- Exhibits78: Data Table on Middle East and Africa - Market size and forecast 2023-2028 ($ million)
- Exhibits79: Chart on Middle East and Africa - Year-over-year growth 2023-2028 (%)
- Exhibits80: Data Table on Middle East and Africa - Year-over-year growth 2023-2028 (%)
- Exhibits81: Chart on South America - Market size and forecast 2023-2028 ($ million)
- Exhibits82: Data Table on South America - Market size and forecast 2023-2028 ($ million)
- Exhibits83: Chart on South America - Year-over-year growth 2023-2028 (%)
- Exhibits84: Data Table on South America - Year-over-year growth 2023-2028 (%)
- Exhibits85: Chart on US - Market size and forecast 2023-2028 ($ million)
- Exhibits86: Data Table on US - Market size and forecast 2023-2028 ($ million)
- Exhibits87: Chart on US - Year-over-year growth 2023-2028 (%)
- Exhibits88: Data Table on US - Year-over-year growth 2023-2028 (%)
- Exhibits89: Chart on Germany - Market size and forecast 2023-2028 ($ million)
- Exhibits90: Data Table on Germany - Market size and forecast 2023-2028 ($ million)
- Exhibits91: Chart on Germany - Year-over-year growth 2023-2028 (%)
- Exhibits92: Data Table on Germany - Year-over-year growth 2023-2028 (%)
- Exhibits93: Chart on Sweden - Market size and forecast 2023-2028 ($ million)
- Exhibits94: Data Table on Sweden - Market size and forecast 2023-2028 ($ million)
- Exhibits95: Chart on Sweden - Year-over-year growth 2023-2028 (%)
- Exhibits96: Data Table on Sweden - Year-over-year growth 2023-2028 (%)
- Exhibits97: Chart on Japan - Market size and forecast 2023-2028 ($ million)
- Exhibits98: Data Table on Japan - Market size and forecast 2023-2028 ($ million)
- Exhibits99: Chart on Japan - Year-over-year growth 2023-2028 (%)
- Exhibits100: Data Table on Japan - Year-over-year growth 2023-2028 (%)
- Exhibits101: Chart on UK - Market size and forecast 2023-2028 ($ million)
- Exhibits102: Data Table on UK - Market size and forecast 2023-2028 ($ million)
- Exhibits103: Chart on UK - Year-over-year growth 2023-2028 (%)
- Exhibits104: Data Table on UK - Year-over-year growth 2023-2028 (%)
- Exhibits105: Market opportunity By Geographical Landscape ($ million)
- Exhibits106: Data Tables on Market opportunity By Geographical Landscape ($ million)
- Exhibits107: Impact of drivers and challenges in 2023 and 2028
- Exhibits108: Overview on criticality of inputs and factors of differentiation
- Exhibits109: Overview on factors of disruption
- Exhibits110: Impact of key risks on business
- Exhibits111: Companies covered
- Exhibits112: Matrix on companies position and classification
- Exhibits113: Assistive Innovations bv - Overview
- Exhibits114: Assistive Innovations bv - Product / Service
- Exhibits115: Assistive Innovations bv - Key offerings
- Exhibits116: Bionic Yantra - Overview
- Exhibits117: Bionic Yantra - Product / Service
- Exhibits118: Bionic Yantra - Key offerings
- Exhibits119: Cyberdyne Inc. - Overview
- Exhibits120: Cyberdyne Inc. - Product / Service
- Exhibits121: Cyberdyne Inc. - Key offerings
- Exhibits122: Ekso Bionics Holdings Inc. - Overview
- Exhibits123: Ekso Bionics Holdings Inc. - Business segments
- Exhibits124: Ekso Bionics Holdings Inc. - Key offerings
- Exhibits125: Ekso Bionics Holdings Inc. - Segment focus
- Exhibits126: Focal Meditech - Overview
- Exhibits127: Focal Meditech - Product / Service
- Exhibits128: Focal Meditech - Key offerings
- Exhibits129: GOGOA Mobility Robots SL - Overview
- Exhibits130: GOGOA Mobility Robots SL - Product / Service
- Exhibits131: GOGOA Mobility Robots SL - Key offerings
- Exhibits132: Honda Motor Co. Ltd. - Overview
- Exhibits133: Honda Motor Co. Ltd. - Business segments
- Exhibits134: Honda Motor Co. Ltd. - Key offerings
- Exhibits135: Honda Motor Co. Ltd. - Segment focus
- Exhibits136: Kinova Inc. - Overview
- Exhibits137: Kinova Inc. - Product / Service
- Exhibits138: Kinova Inc. - Key offerings
- Exhibits139: Ossur hf - Overview
- Exhibits140: Ossur hf - Business segments
- Exhibits141: Ossur hf - Key offerings
- Exhibits142: Ossur hf - Segment focus
- Exhibits143: Ottobock SE and Co. KGaA - Overview
- Exhibits144: Ottobock SE and Co. KGaA - Product / Service
- Exhibits145: Ottobock SE and Co. KGaA - Key offerings
- Exhibits146: Panasonic Holdings Corp. - Overview
- Exhibits147: Panasonic Holdings Corp. - Product / Service
- Exhibits148: Panasonic Holdings Corp. - Key news
- Exhibits149: Panasonic Holdings Corp. - Key offerings
- Exhibits150: ReWalk Robotics Ltd. - Overview
- Exhibits151: ReWalk Robotics Ltd. - Product / Service
- Exhibits152: ReWalk Robotics Ltd. - Key offerings
- Exhibits153: Rex Bionics Ltd. - Overview
- Exhibits154: Rex Bionics Ltd. - Product / Service
- Exhibits155: Rex Bionics Ltd. - Key offerings
- Exhibits156: Toyota Motor Corp. - Overview
- Exhibits157: Toyota Motor Corp. - Business segments
- Exhibits158: Toyota Motor Corp. - Key news
- Exhibits159: Toyota Motor Corp. - Key offerings
- Exhibits160: Toyota Motor Corp. - Segment focus
- Exhibits161: Wandercraft - Overview
- Exhibits162: Wandercraft - Product / Service
- Exhibits163: Wandercraft - Key offerings
- Exhibits164: Inclusions checklist
- Exhibits165: Exclusions checklist
- Exhibits166: Currency conversion rates for US$
- Exhibits167: Research methodology
- Exhibits168: Information sources
- Exhibits169: Data validation
- Exhibits170: Validation techniques employed for market sizing
- Exhibits171: Data synthesis
- Exhibits172: 360 degree market analysis
- Exhibits173: List of abbreviations
Handicap Assistance Robots Market 2024-2028
The handicap assistance robots market is forecasted to grow by USD 3874.8 mn during 2023-2028, accelerating at a CAGR of 32.14% during the forecast period. The report on the handicap assistance robots market provides a holistic analysis, market size and forecast, trends, growth drivers, and challenges, as well as vendor analysis covering around 25 vendors.
The report offers an up-to-date analysis regarding the current market scenario, the latest trends and drivers, and the overall market environment. The market is driven by advancements in artificial intelligence, support for assistance robots from governments of developed countries, and aging population in developed countries.
| Market Scope | |
|---|---|
| Base Year | 2024 |
| End Year | 2028 |
| Series Year | 2024-2028 |
| Growth Momentum | Accelerate |
| YOY 2024 | 24.42% |
| CAGR | 32.14% |
| Incremental Value | $3874.8 mn |
Technavio's handicap assistance robots market is segmented as below:
By Product
- Robotic parts
- Robotic wheelchair
By Type
- Stationary
- Mobility
By Geographical Landscape
- North America
- Europe
- APAC
- Middle East and Africa
- South America
This study identifies the integration of iot with handicap assistance robots as one of the prime reasons driving the handicap assistance robots market growth during the next few years. Also, expansion of robotics technology and development of autonomous robotic wheelchairs will lead to sizable demand in the market.
The report on the handicap assistance robots market covers the following areas:
- Handicap Assistance Robots Market sizing
- Handicap Assistance Robots Market forecast
- Handicap Assistance Robots Market industry analysis
The robust vendor analysis is designed to help clients improve their market position, and in line with this, this report provides a detailed analysis of several leading handicap assistance robots market vendors that include Aether Biomedical sp. z o.o., Assistive Innovations bv, Bionic Yantra, Bionik Laboratories Corp., COVVI, Cyberdyne Inc., Ekso Bionics Holdings Inc., Focal Meditech, GOGOA Mobility Robots SL, Honda Motor Co. Ltd., Japet Medical Devices, Kinova Inc., Ossur hf, Ottobock SE and Co. KGaA, Panasonic Holdings Corp., ReWalk Robotics Ltd., Rex Bionics Ltd., Toyota Motor Corp., Trexo Robotics Inc., and Wandercraft. Also, the handicap assistance robots market analysis report includes information on upcoming trends and challenges that will influence market growth. This is to help companies strategize and leverage all forthcoming growth opportunities.
The study was conducted using an objective combination of primary and secondary information including inputs from key participants in the industry. The report contains a comprehensive market and vendor landscape in addition to an analysis of the key vendors.
The publisher presents a detailed picture of the market by the way of study, synthesis, and summation of data from multiple sources by an analysis of key parameters such as profit, pricing, competition, and promotions. It presents various market facets by identifying the key industry influencers. The data presented is comprehensive, reliable, and a result of extensive primary and secondary research. The market research reports provide a complete competitive landscape and an in-depth vendor selection methodology and analysis using qualitative and quantitative research to forecast accurate market growth.
Table of Contents
1 Executive Summary
- 1.1 Market overview
- Executive Summary - Chart on Market Overview
- Executive Summary - Data Table on Market Overview
- Executive Summary - Chart on Global Market Characteristics
- Executive Summary - Chart on Market By Geographical Landscape
- Executive Summary - Chart on Market Segmentation by Product
- Executive Summary - Chart on Market Segmentation by Type
- Executive Summary - Chart on Incremental Growth
- Executive Summary - Data Table on Incremental Growth
- Executive Summary - Chart on Company Market Positioning
2 Market Landscape
- 2.1 Market ecosystem
- Parent Market
- Data Table on - Parent Market
- 2.2 Market characteristics
- Market characteristics analysis
- 2.3 Value chain analysis
- Value Chain Analysis
3 Market Sizing
- 3.1 Market definition
- Offerings of companies included in the market definition
- 3.2 Market segment analysis
- Market segments
- 3.3 Market size 2023
- 3.4 Market outlook: Forecast for 2023-2028
- Chart on Global - Market size and forecast 2023-2028 ($ million)
- Data Table on Global - Market size and forecast 2023-2028 ($ million)
- Chart on Global Market: Year-over-year growth 2023-2028 (%)
- Data Table on Global Market: Year-over-year growth 2023-2028 (%)
4 Historic Market Size
- 4.1 Global Handicap Assistance Robots Market 2018 - 2022
- Historic Market Size - Data Table on Global Handicap Assistance Robots Market 2018 - 2022 ($ million)
- 4.2 Product segment analysis 2018 - 2022
- Historic Market Size - Product Segment 2018 - 2022 ($ million)
- 4.3 Type segment analysis 2018 - 2022
- Historic Market Size - Type Segment 2018 - 2022 ($ million)
- 4.4 Geography segment analysis 2018 - 2022
- Historic Market Size - Geography Segment 2018 - 2022 ($ million)
- 4.5 Country segment analysis 2018 - 2022
- Historic Market Size - Country Segment 2018 - 2022 ($ million)
5 Five Forces Analysis
- 5.1 Five forces summary
- Five forces analysis - Comparison between 2023 and 2028
- 5.2 Bargaining power of buyers
- Bargaining power of buyers - Impact of key factors 2023 and 2028
- 5.3 Bargaining power of suppliers
- Bargaining power of suppliers - Impact of key factors in 2023 and 2028
- 5.4 Threat of new entrants
- Threat of new entrants - Impact of key factors in 2023 and 2028
- 5.5 Threat of substitutes
- Threat of substitutes - Impact of key factors in 2023 and 2028
- 5.6 Threat of rivalry
- Threat of rivalry - Impact of key factors in 2023 and 2028
- 5.7 Market condition
- Chart on Market condition - Five forces 2023 and 2028
6 Market Segmentation by Product
- 6.1 Market segments
- Chart on Product - Market share 2023-2028 (%)
- Data Table on Product - Market share 2023-2028 (%)
- 6.2 Comparison by Product
- Chart on Comparison by Product
- Data Table on Comparison by Product
- 6.3 Robotic parts - Market size and forecast 2023-2028
- Chart on Robotic parts - Market size and forecast 2023-2028 ($ million)
- Data Table on Robotic parts - Market size and forecast 2023-2028 ($ million)
- Chart on Robotic parts - Year-over-year growth 2023-2028 (%)
- Data Table on Robotic parts - Year-over-year growth 2023-2028 (%)
- 6.4 Robotic wheelchair - Market size and forecast 2023-2028
- Chart on Robotic wheelchair - Market size and forecast 2023-2028 ($ million)
- Data Table on Robotic wheelchair - Market size and forecast 2023-2028 ($ million)
- Chart on Robotic wheelchair - Year-over-year growth 2023-2028 (%)
- Data Table on Robotic wheelchair - Year-over-year growth 2023-2028 (%)
- 6.5 Market opportunity by Product
- Market opportunity by Product ($ million)
- Data Table on Market opportunity by Product ($ million)
7 Market Segmentation by Type
- 7.1 Market segments
- Chart on Type - Market share 2023-2028 (%)
- Data Table on Type - Market share 2023-2028 (%)
- 7.2 Comparison by Type
- Chart on Comparison by Type
- Data Table on Comparison by Type
- 7.3 Stationary - Market size and forecast 2023-2028
- Chart on Stationary - Market size and forecast 2023-2028 ($ million)
- Data Table on Stationary - Market size and forecast 2023-2028 ($ million)
- Chart on Stationary - Year-over-year growth 2023-2028 (%)
- Data Table on Stationary - Year-over-year growth 2023-2028 (%)
- 7.4 Mobility - Market size and forecast 2023-2028
- Chart on Mobility - Market size and forecast 2023-2028 ($ million)
- Data Table on Mobility - Market size and forecast 2023-2028 ($ million)
- Chart on Mobility - Year-over-year growth 2023-2028 (%)
- Data Table on Mobility - Year-over-year growth 2023-2028 (%)
- 7.5 Market opportunity by Type
- Market opportunity by Type ($ million)
- Data Table on Market opportunity by Type ($ million)
8 Customer Landscape
- 8.1 Customer landscape overview
- Analysis of price sensitivity, lifecycle, customer purchase basket, adoption rates, and purchase criteria
9 Geographic Landscape
- 9.1 Geographic segmentation
- Chart on Market share By Geographical Landscape 2023-2028 (%)
- Data Table on Market share By Geographical Landscape 2023-2028 (%)
- 9.2 Geographic comparison
- Chart on Geographic comparison
- Data Table on Geographic comparison
- 9.3 North America - Market size and forecast 2023-2028
- Chart on North America - Market size and forecast 2023-2028 ($ million)
- Data Table on North America - Market size and forecast 2023-2028 ($ million)
- Chart on North America - Year-over-year growth 2023-2028 (%)
- Data Table on North America - Year-over-year growth 2023-2028 (%)
- 9.4 Europe - Market size and forecast 2023-2028
- Chart on Europe - Market size and forecast 2023-2028 ($ million)
- Data Table on Europe - Market size and forecast 2023-2028 ($ million)
- Chart on Europe - Year-over-year growth 2023-2028 (%)
- Data Table on Europe - Year-over-year growth 2023-2028 (%)
- 9.5 APAC - Market size and forecast 2023-2028
- Chart on APAC - Market size and forecast 2023-2028 ($ million)
- Data Table on APAC - Market size and forecast 2023-2028 ($ million)
- Chart on APAC - Year-over-year growth 2023-2028 (%)
- Data Table on APAC - Year-over-year growth 2023-2028 (%)
- 9.6 Middle East and Africa - Market size and forecast 2023-2028
- Chart on Middle East and Africa - Market size and forecast 2023-2028 ($ million)
- Data Table on Middle East and Africa - Market size and forecast 2023-2028 ($ million)
- Chart on Middle East and Africa - Year-over-year growth 2023-2028 (%)
- Data Table on Middle East and Africa - Year-over-year growth 2023-2028 (%)
- 9.7 South America - Market size and forecast 2023-2028
- Chart on South America - Market size and forecast 2023-2028 ($ million)
- Data Table on South America - Market size and forecast 2023-2028 ($ million)
- Chart on South America - Year-over-year growth 2023-2028 (%)
- Data Table on South America - Year-over-year growth 2023-2028 (%)
- 9.8 US - Market size and forecast 2023-2028
- Chart on US - Market size and forecast 2023-2028 ($ million)
- Data Table on US - Market size and forecast 2023-2028 ($ million)
- Chart on US - Year-over-year growth 2023-2028 (%)
- Data Table on US - Year-over-year growth 2023-2028 (%)
- 9.9 Germany - Market size and forecast 2023-2028
- Chart on Germany - Market size and forecast 2023-2028 ($ million)
- Data Table on Germany - Market size and forecast 2023-2028 ($ million)
- Chart on Germany - Year-over-year growth 2023-2028 (%)
- Data Table on Germany - Year-over-year growth 2023-2028 (%)
- 9.10 Sweden - Market size and forecast 2023-2028
- Chart on Sweden - Market size and forecast 2023-2028 ($ million)
- Data Table on Sweden - Market size and forecast 2023-2028 ($ million)
- Chart on Sweden - Year-over-year growth 2023-2028 (%)
- Data Table on Sweden - Year-over-year growth 2023-2028 (%)
- 9.11 Japan - Market size and forecast 2023-2028
- Chart on Japan - Market size and forecast 2023-2028 ($ million)
- Data Table on Japan - Market size and forecast 2023-2028 ($ million)
- Chart on Japan - Year-over-year growth 2023-2028 (%)
- Data Table on Japan - Year-over-year growth 2023-2028 (%)
- 9.12 UK - Market size and forecast 2023-2028
- Chart on UK - Market size and forecast 2023-2028 ($ million)
- Data Table on UK - Market size and forecast 2023-2028 ($ million)
- Chart on UK - Year-over-year growth 2023-2028 (%)
- Data Table on UK - Year-over-year growth 2023-2028 (%)
- 9.13 Market opportunity By Geographical Landscape
- Market opportunity By Geographical Landscape ($ million)
- Data Tables on Market opportunity By Geographical Landscape ($ million)
10 Drivers, Challenges, and Opportunity/Restraints
- 10.1 Market drivers
- 10.2 Market challenges
- 10.3 Impact of drivers and challenges
- Impact of drivers and challenges in 2023 and 2028
- 10.4 Market opportunities/restraints
11 Competitive Landscape
- 11.1 Overview
- 11.2 Competitive Landscape
- Overview on criticality of inputs and factors of differentiation
- 11.3 Landscape disruption
- Overview on factors of disruption
- 11.4 Industry risks
- Impact of key risks on business
12 Competitive Analysis
- 12.1 Companies profiled
- Companies covered
- 12.2 Market positioning of companies
- Matrix on companies position and classification
- 12.3 Assistive Innovations bv
- Assistive Innovations bv - Overview
- Assistive Innovations bv - Product / Service
- Assistive Innovations bv - Key offerings
- 12.4 Bionic Yantra
- Bionic Yantra - Overview
- Bionic Yantra - Product / Service
- Bionic Yantra - Key offerings
- 12.5 Cyberdyne Inc.
- Cyberdyne Inc. - Overview
- Cyberdyne Inc. - Product / Service
- Cyberdyne Inc. - Key offerings
- 12.6 Ekso Bionics Holdings Inc.
- Ekso Bionics Holdings Inc. - Overview
- Ekso Bionics Holdings Inc. - Business segments
- Ekso Bionics Holdings Inc. - Key offerings
- Ekso Bionics Holdings Inc. - Segment focus
- 12.7 Focal Meditech
- Focal Meditech - Overview
- Focal Meditech - Product / Service
- Focal Meditech - Key offerings
- 12.8 GOGOA Mobility Robots SL
- GOGOA Mobility Robots SL - Overview
- GOGOA Mobility Robots SL - Product / Service
- GOGOA Mobility Robots SL - Key offerings
- 12.9 Honda Motor Co. Ltd.
- Honda Motor Co. Ltd. - Overview
- Honda Motor Co. Ltd. - Business segments
- Honda Motor Co. Ltd. - Key offerings
- Honda Motor Co. Ltd. - Segment focus
- 12.10 Kinova Inc.
- Kinova Inc. - Overview
- Kinova Inc. - Product / Service
- Kinova Inc. - Key offerings
- 12.11 Ossur hf
- Ossur hf - Overview
- Ossur hf - Business segments
- Ossur hf - Key offerings
- Ossur hf - Segment focus
- 12.12 Ottobock SE and Co. KGaA
- Ottobock SE and Co. KGaA - Overview
- Ottobock SE and Co. KGaA - Product / Service
- Ottobock SE and Co. KGaA - Key offerings
- 12.13 Panasonic Holdings Corp.
- Panasonic Holdings Corp. - Overview
- Panasonic Holdings Corp. - Product / Service
- Panasonic Holdings Corp. - Key news
- Panasonic Holdings Corp. - Key offerings
- 12.14 ReWalk Robotics Ltd.
- ReWalk Robotics Ltd. - Overview
- ReWalk Robotics Ltd. - Product / Service
- ReWalk Robotics Ltd. - Key offerings
- 12.15 Rex Bionics Ltd.
- Rex Bionics Ltd. - Overview
- Rex Bionics Ltd. - Product / Service
- Rex Bionics Ltd. - Key offerings
- 12.16 Toyota Motor Corp.
- Toyota Motor Corp. - Overview
- Toyota Motor Corp. - Business segments
- Toyota Motor Corp. - Key news
- Toyota Motor Corp. - Key offerings
- Toyota Motor Corp. - Segment focus
- 12.17 Wandercraft
- Wandercraft - Overview
- Wandercraft - Product / Service
- Wandercraft - Key offerings
13 Appendix
- 13.1 Scope of the report
- 13.2 Inclusions and exclusions checklist
- Inclusions checklist
- Exclusions checklist
- 13.3 Currency conversion rates for US$
- Currency conversion rates for US$
- 13.4 Research methodology
- Research methodology
- 13.5 Data procurement
- Information sources
- 13.6 Data validation
- Data validation
- 13.7 Validation techniques employed for market sizing
- Validation techniques employed for market sizing
- 13.8 Data synthesis
- Data synthesis
- 13.9 360 degree market analysis
- 360 degree market analysis
- 13.10 List of abbreviations
- List of abbreviations

