|
|
市場調査レポート
商品コード
1626982
小売用途向けディスプレイの世界市場、2024~2028年Global Display for Retail Applications Market 2024-2028 |
||||||

|
|||||||
カスタマイズ可能
|
|||||||


| 小売用途向けディスプレイの世界市場、2024~2028年 |
|
出版日: 2024年07月31日
発行: TechNavio
ページ情報: 英文 187 Pages
納期: 即納可能
|

全表示
- 概要
- 図表
- 目次
小売用途向けディスプレイ市場、2024~2028年
小売用途向けディスプレイ市場は2023~2028年に10億9,950万米ドル、予測期間中のCAGRは4.36%で成長すると予測されます。当レポートでは、小売用途向けディスプレイ市場の全体的な分析、市場規模・予測、動向、成長促進要因、課題、約25のベンダーを網羅したベンダー分析などを掲載しています。
現在の市場シナリオ、最新動向と促進要因、市場環境全体に関する最新分析を提供しています。市場は、従来の広告手法に対する優位性、便利で使いやすいショッピング環境に対する需要の高まり、娯楽の一形態としてのショッピングの進化によって牽引されています。
| 市場範囲 | |
|---|---|
| 基準年 | 2024年 |
| 終了年 | 2028年 |
| 予測期間 | 2024~2028年 |
| 成長モメンタム | 加速 |
| 前年比[2024年] | 4.11% |
| CAGR | 4.36% |
| 増分額 | 10億9,950万米ドル |
本調査では、今後数年間の小売用途向けディスプレイ市場の成長を牽引する主要要因の1つとして、新しいディスプレイ技術の出現を挙げています。また、広告用3Dディスプレイの採用拡大や高解像度ディスプレイの使用は、市場の大きな需要につながります。
目次
第1章 エグゼクティブサマリー
- 市場概要
第2章 市場情勢
- 市場エコシステム
- 市場の特徴
- バリューチェーン分析
第3章 市場規模
- 市場の定義
- 市場セグメント分析
- 市場規模 2023年
- 市場の展望 2023~2028年
第4章 市場規模実績
- 小売用途向けディスプレイの世界市場 2018~2022年
- タイプ別セグメント分析 2018~2022年
- 用途別セグメント分析 2018~2022年
- 地域別セグメント分析 2018~2022年
- 国別セグメント分析 2018~2022年
第5章 ファイブフォース分析
- ファイブフォースの要約
- 買い手の交渉力
- 供給企業の交渉力
- 新規参入業者の脅威
- 代替品の脅威
- 競争の脅威
- 市況
第6章 市場セグメンテーション:タイプ別
- 市場セグメント
- 比較:タイプ別
- タッチスクリーンディスプレイ:市場規模と予測 2023~2028年
- 非タッチスクリーンディスプレイ:市場規模と予測 2023~2028年
- 市場機会:タイプ別
第7章 市場セグメンテーション:用途別
- 市場セグメント
- 比較:用途別
- アパレルとフットウェア:市場規模と予測 2023~2028年
- 百貨店:市場規模と予測 2023~2028年
- ジュエリーと腕時計:市場規模と予測 2023~2028年
- バッグとラゲッジ:市場規模と予測 2023~2028年
- その他:市場規模と予測 2023~2028年
- 市場機会:用途別
第8章 顧客情勢
- 顧客情勢概要
第9章 地域別情勢
- 地域別セグメンテーション
- 比較:地域別
- アジア太平洋:市場規模と予測 2023~2028年
- 北米:市場規模と予測 2023~2028年
- 欧州:市場規模と予測 2023~2028年
- 南米:市場規模と予測 2023~2028年
- 中東・アフリカ:市場規模と予測 2023~2028年
- 米国:市場規模と予測 2023~2028年
- 中国:市場規模と予測 2023~2028年
- 日本:市場規模と予測 2023~2028年
- インド:市場規模と予測 2023~2028年
- ドイツ:市場規模と予測 2023~2028年
- 地域情勢による市場機会
第10章 促進要因・課題・機会・抑制要因
- 市場促進要因
- 市場課題
- 促進要因と課題の影響
- 市場機会・抑制要因
第11章 競合情勢
- 概要
- 競合情勢
- 混乱の状況
- 産業のリスク
第12章 競合分析
- 企業プロファイル
- 企業の市場ポジショニング
- AUO Corp.
- Corning Inc.
- Crystal Display Systems Ltd.
- Daktronics Inc.
- Elo Touch Solutions Inc.
- Kent Displays Inc.
- Leyard Group
- LG Electronics Inc.
- NEC Corp.
- Panasonic Holdings Corp.
- Samsung Electronics Co. Ltd.
- Seiko Epson Corp.
- Toshiba Corp.
- ViewSonic Corp.
- YFY Inc.
第13章 付録
Exhibits:
- Exhibits1: Executive Summary - Chart on Market Overview
- Exhibits2: Executive Summary - Data Table on Market Overview
- Exhibits3: Executive Summary - Chart on Global Market Characteristics
- Exhibits4: Executive Summary - Chart on Market By Geographical Landscape
- Exhibits5: Executive Summary - Chart on Market Segmentation by Type
- Exhibits6: Executive Summary - Chart on Market Segmentation by Application
- Exhibits7: Executive Summary - Chart on Incremental Growth
- Exhibits8: Executive Summary - Data Table on Incremental Growth
- Exhibits9: Executive Summary - Chart on Company Market Positioning
- Exhibits10: Parent Market
- Exhibits11: Data Table on - Parent Market
- Exhibits12: Market characteristics analysis
- Exhibits13: Value Chain Analysis
- Exhibits14: Offerings of companies included in the market definition
- Exhibits15: Market segments
- Exhibits16: Chart on Global - Market size and forecast 2023-2028 ($ million)
- Exhibits17: Data Table on Global - Market size and forecast 2023-2028 ($ million)
- Exhibits18: Chart on Global Market: Year-over-year growth 2023-2028 (%)
- Exhibits19: Data Table on Global Market: Year-over-year growth 2023-2028 (%)
- Exhibits20: Historic Market Size - Data Table on Global Display For Retail Applications Market 2018 - 2022 ($ million)
- Exhibits21: Historic Market Size - Type Segment 2018 - 2022 ($ million)
- Exhibits22: Historic Market Size - Application Segment 2018 - 2022 ($ million)
- Exhibits23: Historic Market Size - Geography Segment 2018 - 2022 ($ million)
- Exhibits24: Historic Market Size - Country Segment 2018 - 2022 ($ million)
- Exhibits25: Five forces analysis - Comparison between 2023 and 2028
- Exhibits26: Bargaining power of buyers - Impact of key factors 2023 and 2028
- Exhibits27: Bargaining power of suppliers - Impact of key factors in 2023 and 2028
- Exhibits28: Threat of new entrants - Impact of key factors in 2023 and 2028
- Exhibits29: Threat of substitutes - Impact of key factors in 2023 and 2028
- Exhibits30: Threat of rivalry - Impact of key factors in 2023 and 2028
- Exhibits31: Chart on Market condition - Five forces 2023 and 2028
- Exhibits32: Chart on Type - Market share 2023-2028 (%)
- Exhibits33: Data Table on Type - Market share 2023-2028 (%)
- Exhibits34: Chart on Comparison by Type
- Exhibits35: Data Table on Comparison by Type
- Exhibits36: Chart on Touchscreen display - Market size and forecast 2023-2028 ($ million)
- Exhibits37: Data Table on Touchscreen display - Market size and forecast 2023-2028 ($ million)
- Exhibits38: Chart on Touchscreen display - Year-over-year growth 2023-2028 (%)
- Exhibits39: Data Table on Touchscreen display - Year-over-year growth 2023-2028 (%)
- Exhibits40: Chart on Non-touchscreen display - Market size and forecast 2023-2028 ($ million)
- Exhibits41: Data Table on Non-touchscreen display - Market size and forecast 2023-2028 ($ million)
- Exhibits42: Chart on Non-touchscreen display - Year-over-year growth 2023-2028 (%)
- Exhibits43: Data Table on Non-touchscreen display - Year-over-year growth 2023-2028 (%)
- Exhibits44: Market opportunity by Type ($ million)
- Exhibits45: Data Table on Market opportunity by Type ($ million)
- Exhibits46: Chart on Application - Market share 2023-2028 (%)
- Exhibits47: Data Table on Application - Market share 2023-2028 (%)
- Exhibits48: Chart on Comparison by Application
- Exhibits49: Data Table on Comparison by Application
- Exhibits50: Chart on Apparel and footwear - Market size and forecast 2023-2028 ($ million)
- Exhibits51: Data Table on Apparel and footwear - Market size and forecast 2023-2028 ($ million)
- Exhibits52: Chart on Apparel and footwear - Year-over-year growth 2023-2028 (%)
- Exhibits53: Data Table on Apparel and footwear - Year-over-year growth 2023-2028 (%)
- Exhibits54: Chart on Departmental stores - Market size and forecast 2023-2028 ($ million)
- Exhibits55: Data Table on Departmental stores - Market size and forecast 2023-2028 ($ million)
- Exhibits56: Chart on Departmental stores - Year-over-year growth 2023-2028 (%)
- Exhibits57: Data Table on Departmental stores - Year-over-year growth 2023-2028 (%)
- Exhibits58: Chart on Jewelry and watches - Market size and forecast 2023-2028 ($ million)
- Exhibits59: Data Table on Jewelry and watches - Market size and forecast 2023-2028 ($ million)
- Exhibits60: Chart on Jewelry and watches - Year-over-year growth 2023-2028 (%)
- Exhibits61: Data Table on Jewelry and watches - Year-over-year growth 2023-2028 (%)
- Exhibits62: Chart on Bags and luggage - Market size and forecast 2023-2028 ($ million)
- Exhibits63: Data Table on Bags and luggage - Market size and forecast 2023-2028 ($ million)
- Exhibits64: Chart on Bags and luggage - Year-over-year growth 2023-2028 (%)
- Exhibits65: Data Table on Bags and luggage - Year-over-year growth 2023-2028 (%)
- Exhibits66: Chart on Others - Market size and forecast 2023-2028 ($ million)
- Exhibits67: Data Table on Others - Market size and forecast 2023-2028 ($ million)
- Exhibits68: Chart on Others - Year-over-year growth 2023-2028 (%)
- Exhibits69: Data Table on Others - Year-over-year growth 2023-2028 (%)
- Exhibits70: Market opportunity by Application ($ million)
- Exhibits71: Data Table on Market opportunity by Application ($ million)
- Exhibits72: Analysis of price sensitivity, lifecycle, customer purchase basket, adoption rates, and purchase criteria
- Exhibits73: Chart on Market share By Geographical Landscape 2023-2028 (%)
- Exhibits74: Data Table on Market share By Geographical Landscape 2023-2028 (%)
- Exhibits75: Chart on Geographic comparison
- Exhibits76: Data Table on Geographic comparison
- Exhibits77: Chart on APAC - Market size and forecast 2023-2028 ($ million)
- Exhibits78: Data Table on APAC - Market size and forecast 2023-2028 ($ million)
- Exhibits79: Chart on APAC - Year-over-year growth 2023-2028 (%)
- Exhibits80: Data Table on APAC - Year-over-year growth 2023-2028 (%)
- Exhibits81: Chart on North America - Market size and forecast 2023-2028 ($ million)
- Exhibits82: Data Table on North America - Market size and forecast 2023-2028 ($ million)
- Exhibits83: Chart on North America - Year-over-year growth 2023-2028 (%)
- Exhibits84: Data Table on North America - Year-over-year growth 2023-2028 (%)
- Exhibits85: Chart on Europe - Market size and forecast 2023-2028 ($ million)
- Exhibits86: Data Table on Europe - Market size and forecast 2023-2028 ($ million)
- Exhibits87: Chart on Europe - Year-over-year growth 2023-2028 (%)
- Exhibits88: Data Table on Europe - Year-over-year growth 2023-2028 (%)
- Exhibits89: Chart on South America - Market size and forecast 2023-2028 ($ million)
- Exhibits90: Data Table on South America - Market size and forecast 2023-2028 ($ million)
- Exhibits91: Chart on South America - Year-over-year growth 2023-2028 (%)
- Exhibits92: Data Table on South America - Year-over-year growth 2023-2028 (%)
- Exhibits93: Chart on Middle East and Africa - Market size and forecast 2023-2028 ($ million)
- Exhibits94: Data Table on Middle East and Africa - Market size and forecast 2023-2028 ($ million)
- Exhibits95: Chart on Middle East and Africa - Year-over-year growth 2023-2028 (%)
- Exhibits96: Data Table on Middle East and Africa - Year-over-year growth 2023-2028 (%)
- Exhibits97: Chart on US - Market size and forecast 2023-2028 ($ million)
- Exhibits98: Data Table on US - Market size and forecast 2023-2028 ($ million)
- Exhibits99: Chart on US - Year-over-year growth 2023-2028 (%)
- Exhibits100: Data Table on US - Year-over-year growth 2023-2028 (%)
- Exhibits101: Chart on China - Market size and forecast 2023-2028 ($ million)
- Exhibits102: Data Table on China - Market size and forecast 2023-2028 ($ million)
- Exhibits103: Chart on China - Year-over-year growth 2023-2028 (%)
- Exhibits104: Data Table on China - Year-over-year growth 2023-2028 (%)
- Exhibits105: Chart on Japan - Market size and forecast 2023-2028 ($ million)
- Exhibits106: Data Table on Japan - Market size and forecast 2023-2028 ($ million)
- Exhibits107: Chart on Japan - Year-over-year growth 2023-2028 (%)
- Exhibits108: Data Table on Japan - Year-over-year growth 2023-2028 (%)
- Exhibits109: Chart on India - Market size and forecast 2023-2028 ($ million)
- Exhibits110: Data Table on India - Market size and forecast 2023-2028 ($ million)
- Exhibits111: Chart on India - Year-over-year growth 2023-2028 (%)
- Exhibits112: Data Table on India - Year-over-year growth 2023-2028 (%)
- Exhibits113: Chart on Germany - Market size and forecast 2023-2028 ($ million)
- Exhibits114: Data Table on Germany - Market size and forecast 2023-2028 ($ million)
- Exhibits115: Chart on Germany - Year-over-year growth 2023-2028 (%)
- Exhibits116: Data Table on Germany - Year-over-year growth 2023-2028 (%)
- Exhibits117: Market opportunity By Geographical Landscape ($ million)
- Exhibits118: Data Tables on Market opportunity By Geographical Landscape ($ million)
- Exhibits119: Impact of drivers and challenges in 2023 and 2028
- Exhibits120: Overview on criticality of inputs and factors of differentiation
- Exhibits121: Overview on factors of disruption
- Exhibits122: Impact of key risks on business
- Exhibits123: Companies covered
- Exhibits124: Matrix on companies position and classification
- Exhibits125: AUO Corp. - Overview
- Exhibits126: AUO Corp. - Business segments
- Exhibits127: AUO Corp. - Key news
- Exhibits128: AUO Corp. - Key offerings
- Exhibits129: AUO Corp. - Segment focus
- Exhibits130: Corning Inc. - Overview
- Exhibits131: Corning Inc. - Business segments
- Exhibits132: Corning Inc. - Key news
- Exhibits133: Corning Inc. - Key offerings
- Exhibits134: Corning Inc. - Segment focus
- Exhibits135: Crystal Display Systems Ltd. - Overview
- Exhibits136: Crystal Display Systems Ltd. - Product / Service
- Exhibits137: Crystal Display Systems Ltd. - Key offerings
- Exhibits138: Daktronics Inc. - Overview
- Exhibits139: Daktronics Inc. - Business segments
- Exhibits140: Daktronics Inc. - Key offerings
- Exhibits141: Daktronics Inc. - Segment focus
- Exhibits142: Elo Touch Solutions Inc. - Overview
- Exhibits143: Elo Touch Solutions Inc. - Product / Service
- Exhibits144: Elo Touch Solutions Inc. - Key offerings
- Exhibits145: Kent Displays Inc. - Overview
- Exhibits146: Kent Displays Inc. - Product / Service
- Exhibits147: Kent Displays Inc. - Key offerings
- Exhibits148: Leyard Group - Overview
- Exhibits149: Leyard Group - Business segments
- Exhibits150: Leyard Group - Key offerings
- Exhibits151: Leyard Group - Segment focus
- Exhibits152: LG Electronics Inc. - Overview
- Exhibits153: LG Electronics Inc. - Product / Service
- Exhibits154: LG Electronics Inc. - Key news
- Exhibits155: LG Electronics Inc. - Key offerings
- Exhibits156: NEC Corp. - Overview
- Exhibits157: NEC Corp. - Business segments
- Exhibits158: NEC Corp. - Key news
- Exhibits159: NEC Corp. - Key offerings
- Exhibits160: NEC Corp. - Segment focus
- Exhibits161: Panasonic Holdings Corp. - Overview
- Exhibits162: Panasonic Holdings Corp. - Product / Service
- Exhibits163: Panasonic Holdings Corp. - Key news
- Exhibits164: Panasonic Holdings Corp. - Key offerings
- Exhibits165: Samsung Electronics Co. Ltd. - Overview
- Exhibits166: Samsung Electronics Co. Ltd. - Business segments
- Exhibits167: Samsung Electronics Co. Ltd. - Key news
- Exhibits168: Samsung Electronics Co. Ltd. - Key offerings
- Exhibits169: Samsung Electronics Co. Ltd. - Segment focus
- Exhibits170: Seiko Epson Corp. - Overview
- Exhibits171: Seiko Epson Corp. - Business segments
- Exhibits172: Seiko Epson Corp. - Key news
- Exhibits173: Seiko Epson Corp. - Key offerings
- Exhibits174: Seiko Epson Corp. - Segment focus
- Exhibits175: Toshiba Corp. - Overview
- Exhibits176: Toshiba Corp. - Business segments
- Exhibits177: Toshiba Corp. - Key news
- Exhibits178: Toshiba Corp. - Key offerings
- Exhibits179: Toshiba Corp. - Segment focus
- Exhibits180: ViewSonic Corp. - Overview
- Exhibits181: ViewSonic Corp. - Product / Service
- Exhibits182: ViewSonic Corp. - Key offerings
- Exhibits183: YFY Inc. - Overview
- Exhibits184: YFY Inc. - Business segments
- Exhibits185: YFY Inc. - Key offerings
- Exhibits186: YFY Inc. - Segment focus
- Exhibits187: Inclusions checklist
- Exhibits188: Exclusions checklist
- Exhibits189: Currency conversion rates for US$
- Exhibits190: Research methodology
- Exhibits191: Information sources
- Exhibits192: Data validation
- Exhibits193: Validation techniques employed for market sizing
- Exhibits194: Data synthesis
- Exhibits195: 360 degree market analysis
- Exhibits196: List of abbreviations
Display For Retail Applications Market 2024-2028
The display for retail applications market is forecasted to grow by USD 1099.5 mn during 2023-2028, accelerating at a CAGR of 4.36% during the forecast period. The report on the display for retail applications market provides a holistic analysis, market size and forecast, trends, growth drivers, and challenges, as well as vendor analysis covering around 25 vendors.
The report offers an up-to-date analysis regarding the current market scenario, the latest trends and drivers, and the overall market environment. The market is driven by advantages over traditional advertisement methods, rising demand for convenient and user-friendly shopping environment, and evolution of shopping as form of entertainment.
| Market Scope | |
|---|---|
| Base Year | 2024 |
| End Year | 2028 |
| Series Year | 2024-2028 |
| Growth Momentum | Accelerate |
| YOY 2024 | 4.11% |
| CAGR | 4.36% |
| Incremental Value | $1099.5 mn |
Technavio's display for retail applications market is segmented as below:
By Type
- Touchscreen display
- Non-touchscreen display
By Application
- Apparel and footwear
- Departmental stores
- Jewelry and watches
- Bags and luggage
- Others
By Geographical Landscape
- APAC
- North America
- Europe
- South America
- Middle East and Africa
This study identifies the emergence of new display technologies as one of the prime reasons driving the display for retail applications market growth during the next few years. Also, growing adoption of 3D displays for advertising and use of high-resolution displays will lead to sizable demand in the market.
The report on the display for retail applications market covers the following areas:
- Display For Retail Applications Market sizing
- Display For Retail Applications Market forecast
- Display For Retail Applications Market industry analysis
The robust vendor analysis is designed to help clients improve their market position, and in line with this, this report provides a detailed analysis of several leading display for retail applications market vendors that include AUO Corp., Corning Inc., Crystal Display Systems Ltd., Daktronics Inc., Elo Touch Solutions Inc., Furukawa Electric Co. Ltd., Hon Hai Precision Industry Co. Ltd., Kent Displays Inc., Koninklijke Philips N.V., Leyard Group, LG Electronics Inc., Mitsubishi Electric Corp., NEC Corp., Panasonic Holdings Corp., Samsung Electronics Co. Ltd., Seiko Epson Corp., Sony Group Corp., Toshiba Corp., ViewSonic Corp., and YFY Inc.. Also, the display for retail applications market analysis report includes information on upcoming trends and challenges that will influence market growth. This is to help companies strategize and leverage all forthcoming growth opportunities.
The study was conducted using an objective combination of primary and secondary information including inputs from key participants in the industry. The report contains a comprehensive market and vendor landscape in addition to an analysis of the key vendors.
The publisher presents a detailed picture of the market by the way of study, synthesis, and summation of data from multiple sources by an analysis of key parameters such as profit, pricing, competition, and promotions. It presents various market facets by identifying the key industry influencers. The data presented is comprehensive, reliable, and a result of extensive primary and secondary research. The market research reports provide a complete competitive landscape and an in-depth vendor selection methodology and analysis using qualitative and quantitative research to forecast accurate market growth.
Table of Contents
1 Executive Summary
- 1.1 Market overview
- Executive Summary - Chart on Market Overview
- Executive Summary - Data Table on Market Overview
- Executive Summary - Chart on Global Market Characteristics
- Executive Summary - Chart on Market By Geographical Landscape
- Executive Summary - Chart on Market Segmentation by Type
- Executive Summary - Chart on Market Segmentation by Application
- Executive Summary - Chart on Incremental Growth
- Executive Summary - Data Table on Incremental Growth
- Executive Summary - Chart on Company Market Positioning
2 Market Landscape
- 2.1 Market ecosystem
- Parent Market
- Data Table on - Parent Market
- 2.2 Market characteristics
- Market characteristics analysis
- 2.3 Value chain analysis
- Value Chain Analysis
3 Market Sizing
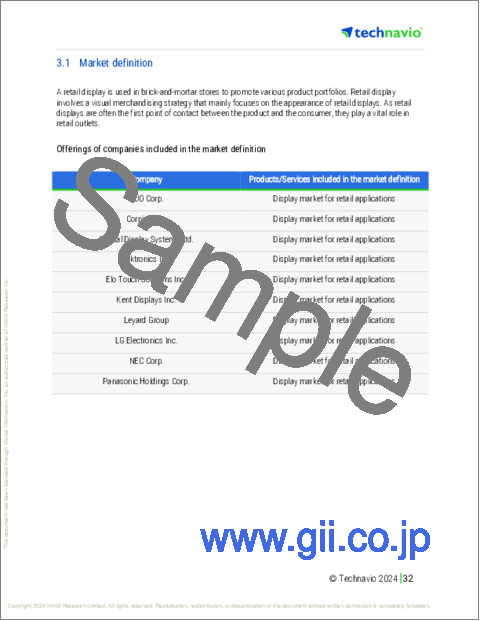
- 3.1 Market definition
- Offerings of companies included in the market definition
- 3.2 Market segment analysis
- Market segments
- 3.3 Market size 2023
- 3.4 Market outlook: Forecast for 2023-2028
- Chart on Global - Market size and forecast 2023-2028 ($ million)
- Data Table on Global - Market size and forecast 2023-2028 ($ million)
- Chart on Global Market: Year-over-year growth 2023-2028 (%)
- Data Table on Global Market: Year-over-year growth 2023-2028 (%)
4 Historic Market Size
- 4.1 Global Display For Retail Applications Market 2018 - 2022
- Historic Market Size - Data Table on Global Display For Retail Applications Market 2018 - 2022 ($ million)
- 4.2 Type segment analysis 2018 - 2022
- Historic Market Size - Type Segment 2018 - 2022 ($ million)
- 4.3 Application segment analysis 2018 - 2022
- Historic Market Size - Application Segment 2018 - 2022 ($ million)
- 4.4 Geography segment analysis 2018 - 2022
- Historic Market Size - Geography Segment 2018 - 2022 ($ million)
- 4.5 Country segment analysis 2018 - 2022
- Historic Market Size - Country Segment 2018 - 2022 ($ million)
5 Five Forces Analysis
- 5.1 Five forces summary
- Five forces analysis - Comparison between 2023 and 2028
- 5.2 Bargaining power of buyers
- Bargaining power of buyers - Impact of key factors 2023 and 2028
- 5.3 Bargaining power of suppliers
- Bargaining power of suppliers - Impact of key factors in 2023 and 2028
- 5.4 Threat of new entrants
- Threat of new entrants - Impact of key factors in 2023 and 2028
- 5.5 Threat of substitutes
- Threat of substitutes - Impact of key factors in 2023 and 2028
- 5.6 Threat of rivalry
- Threat of rivalry - Impact of key factors in 2023 and 2028
- 5.7 Market condition
- Chart on Market condition - Five forces 2023 and 2028
6 Market Segmentation by Type
- 6.1 Market segments
- Chart on Type - Market share 2023-2028 (%)
- Data Table on Type - Market share 2023-2028 (%)
- 6.2 Comparison by Type
- Chart on Comparison by Type
- Data Table on Comparison by Type
- 6.3 Touchscreen display - Market size and forecast 2023-2028
- Chart on Touchscreen display - Market size and forecast 2023-2028 ($ million)
- Data Table on Touchscreen display - Market size and forecast 2023-2028 ($ million)
- Chart on Touchscreen display - Year-over-year growth 2023-2028 (%)
- Data Table on Touchscreen display - Year-over-year growth 2023-2028 (%)
- 6.4 Non-touchscreen display - Market size and forecast 2023-2028
- Chart on Non-touchscreen display - Market size and forecast 2023-2028 ($ million)
- Data Table on Non-touchscreen display - Market size and forecast 2023-2028 ($ million)
- Chart on Non-touchscreen display - Year-over-year growth 2023-2028 (%)
- Data Table on Non-touchscreen display - Year-over-year growth 2023-2028 (%)
- 6.5 Market opportunity by Type
- Market opportunity by Type ($ million)
- Data Table on Market opportunity by Type ($ million)
7 Market Segmentation by Application
- 7.1 Market segments
- Chart on Application - Market share 2023-2028 (%)
- Data Table on Application - Market share 2023-2028 (%)
- 7.2 Comparison by Application
- Chart on Comparison by Application
- Data Table on Comparison by Application
- 7.3 Apparel and footwear - Market size and forecast 2023-2028
- Chart on Apparel and footwear - Market size and forecast 2023-2028 ($ million)
- Data Table on Apparel and footwear - Market size and forecast 2023-2028 ($ million)
- Chart on Apparel and footwear - Year-over-year growth 2023-2028 (%)
- Data Table on Apparel and footwear - Year-over-year growth 2023-2028 (%)
- 7.4 Departmental stores - Market size and forecast 2023-2028
- Chart on Departmental stores - Market size and forecast 2023-2028 ($ million)
- Data Table on Departmental stores - Market size and forecast 2023-2028 ($ million)
- Chart on Departmental stores - Year-over-year growth 2023-2028 (%)
- Data Table on Departmental stores - Year-over-year growth 2023-2028 (%)
- 7.5 Jewelry and watches - Market size and forecast 2023-2028
- Chart on Jewelry and watches - Market size and forecast 2023-2028 ($ million)
- Data Table on Jewelry and watches - Market size and forecast 2023-2028 ($ million)
- Chart on Jewelry and watches - Year-over-year growth 2023-2028 (%)
- Data Table on Jewelry and watches - Year-over-year growth 2023-2028 (%)
- 7.6 Bags and luggage - Market size and forecast 2023-2028
- Chart on Bags and luggage - Market size and forecast 2023-2028 ($ million)
- Data Table on Bags and luggage - Market size and forecast 2023-2028 ($ million)
- Chart on Bags and luggage - Year-over-year growth 2023-2028 (%)
- Data Table on Bags and luggage - Year-over-year growth 2023-2028 (%)
- 7.7 Others - Market size and forecast 2023-2028
- Chart on Others - Market size and forecast 2023-2028 ($ million)
- Data Table on Others - Market size and forecast 2023-2028 ($ million)
- Chart on Others - Year-over-year growth 2023-2028 (%)
- Data Table on Others - Year-over-year growth 2023-2028 (%)
- 7.8 Market opportunity by Application
- Market opportunity by Application ($ million)
- Data Table on Market opportunity by Application ($ million)
8 Customer Landscape
- 8.1 Customer landscape overview
- Analysis of price sensitivity, lifecycle, customer purchase basket, adoption rates, and purchase criteria
9 Geographic Landscape
- 9.1 Geographic segmentation
- Chart on Market share By Geographical Landscape 2023-2028 (%)
- Data Table on Market share By Geographical Landscape 2023-2028 (%)
- 9.2 Geographic comparison
- Chart on Geographic comparison
- Data Table on Geographic comparison
- 9.3 APAC - Market size and forecast 2023-2028
- Chart on APAC - Market size and forecast 2023-2028 ($ million)
- Data Table on APAC - Market size and forecast 2023-2028 ($ million)
- Chart on APAC - Year-over-year growth 2023-2028 (%)
- Data Table on APAC - Year-over-year growth 2023-2028 (%)
- 9.4 North America - Market size and forecast 2023-2028
- Chart on North America - Market size and forecast 2023-2028 ($ million)
- Data Table on North America - Market size and forecast 2023-2028 ($ million)
- Chart on North America - Year-over-year growth 2023-2028 (%)
- Data Table on North America - Year-over-year growth 2023-2028 (%)
- 9.5 Europe - Market size and forecast 2023-2028
- Chart on Europe - Market size and forecast 2023-2028 ($ million)
- Data Table on Europe - Market size and forecast 2023-2028 ($ million)
- Chart on Europe - Year-over-year growth 2023-2028 (%)
- Data Table on Europe - Year-over-year growth 2023-2028 (%)
- 9.6 South America - Market size and forecast 2023-2028
- Chart on South America - Market size and forecast 2023-2028 ($ million)
- Data Table on South America - Market size and forecast 2023-2028 ($ million)
- Chart on South America - Year-over-year growth 2023-2028 (%)
- Data Table on South America - Year-over-year growth 2023-2028 (%)
- 9.7 Middle East and Africa - Market size and forecast 2023-2028
- Chart on Middle East and Africa - Market size and forecast 2023-2028 ($ million)
- Data Table on Middle East and Africa - Market size and forecast 2023-2028 ($ million)
- Chart on Middle East and Africa - Year-over-year growth 2023-2028 (%)
- Data Table on Middle East and Africa - Year-over-year growth 2023-2028 (%)
- 9.8 US - Market size and forecast 2023-2028
- Chart on US - Market size and forecast 2023-2028 ($ million)
- Data Table on US - Market size and forecast 2023-2028 ($ million)
- Chart on US - Year-over-year growth 2023-2028 (%)
- Data Table on US - Year-over-year growth 2023-2028 (%)
- 9.9 China - Market size and forecast 2023-2028
- Chart on China - Market size and forecast 2023-2028 ($ million)
- Data Table on China - Market size and forecast 2023-2028 ($ million)
- Chart on China - Year-over-year growth 2023-2028 (%)
- Data Table on China - Year-over-year growth 2023-2028 (%)
- 9.10 Japan - Market size and forecast 2023-2028
- Chart on Japan - Market size and forecast 2023-2028 ($ million)
- Data Table on Japan - Market size and forecast 2023-2028 ($ million)
- Chart on Japan - Year-over-year growth 2023-2028 (%)
- Data Table on Japan - Year-over-year growth 2023-2028 (%)
- 9.11 India - Market size and forecast 2023-2028
- Chart on India - Market size and forecast 2023-2028 ($ million)
- Data Table on India - Market size and forecast 2023-2028 ($ million)
- Chart on India - Year-over-year growth 2023-2028 (%)
- Data Table on India - Year-over-year growth 2023-2028 (%)
- 9.12 Germany - Market size and forecast 2023-2028
- Chart on Germany - Market size and forecast 2023-2028 ($ million)
- Data Table on Germany - Market size and forecast 2023-2028 ($ million)
- Chart on Germany - Year-over-year growth 2023-2028 (%)
- Data Table on Germany - Year-over-year growth 2023-2028 (%)
- 9.13 Market opportunity By Geographical Landscape
- Market opportunity By Geographical Landscape ($ million)
- Data Tables on Market opportunity By Geographical Landscape ($ million)
10 Drivers, Challenges, and Opportunity/Restraints
- 10.1 Market drivers
- 10.2 Market challenges
- 10.3 Impact of drivers and challenges
- Impact of drivers and challenges in 2023 and 2028
- 10.4 Market opportunities/restraints
11 Competitive Landscape
- 11.1 Overview
- 11.2 Competitive Landscape
- Overview on criticality of inputs and factors of differentiation
- 11.3 Landscape disruption
- Overview on factors of disruption
- 11.4 Industry risks
- Impact of key risks on business
12 Competitive Analysis
- 12.1 Companies profiled
- Companies covered
- 12.2 Market positioning of companies
- Matrix on companies position and classification
- 12.3 AUO Corp.
- AUO Corp. - Overview
- AUO Corp. - Business segments
- AUO Corp. - Key news
- AUO Corp. - Key offerings
- AUO Corp. - Segment focus
- 12.4 Corning Inc.
- Corning Inc. - Overview
- Corning Inc. - Business segments
- Corning Inc. - Key news
- Corning Inc. - Key offerings
- Corning Inc. - Segment focus
- 12.5 Crystal Display Systems Ltd.
- Crystal Display Systems Ltd. - Overview
- Crystal Display Systems Ltd. - Product / Service
- Crystal Display Systems Ltd. - Key offerings
- 12.6 Daktronics Inc.
- Daktronics Inc. - Overview
- Daktronics Inc. - Business segments
- Daktronics Inc. - Key offerings
- Daktronics Inc. - Segment focus
- 12.7 Elo Touch Solutions Inc.
- Elo Touch Solutions Inc. - Overview
- Elo Touch Solutions Inc. - Product / Service
- Elo Touch Solutions Inc. - Key offerings
- 12.8 Kent Displays Inc.
- Kent Displays Inc. - Overview
- Kent Displays Inc. - Product / Service
- Kent Displays Inc. - Key offerings
- 12.9 Leyard Group
- Leyard Group - Overview
- Leyard Group - Business segments
- Leyard Group - Key offerings
- Leyard Group - Segment focus
- 12.10 LG Electronics Inc.
- LG Electronics Inc. - Overview
- LG Electronics Inc. - Product / Service
- LG Electronics Inc. - Key news
- LG Electronics Inc. - Key offerings
- 12.11 NEC Corp.
- NEC Corp. - Overview
- NEC Corp. - Business segments
- NEC Corp. - Key news
- NEC Corp. - Key offerings
- NEC Corp. - Segment focus
- 12.12 Panasonic Holdings Corp.
- Panasonic Holdings Corp. - Overview
- Panasonic Holdings Corp. - Product / Service
- Panasonic Holdings Corp. - Key news
- Panasonic Holdings Corp. - Key offerings
- 12.13 Samsung Electronics Co. Ltd.
- Samsung Electronics Co. Ltd. - Overview
- Samsung Electronics Co. Ltd. - Business segments
- Samsung Electronics Co. Ltd. - Key news
- Samsung Electronics Co. Ltd. - Key offerings
- Samsung Electronics Co. Ltd. - Segment focus
- 12.14 Seiko Epson Corp.
- Seiko Epson Corp. - Overview
- Seiko Epson Corp. - Business segments
- Seiko Epson Corp. - Key news
- Seiko Epson Corp. - Key offerings
- Seiko Epson Corp. - Segment focus
- 12.15 Toshiba Corp.
- Toshiba Corp. - Overview
- Toshiba Corp. - Business segments
- Toshiba Corp. - Key news
- Toshiba Corp. - Key offerings
- Toshiba Corp. - Segment focus
- 12.16 ViewSonic Corp.
- ViewSonic Corp. - Overview
- ViewSonic Corp. - Product / Service
- ViewSonic Corp. - Key offerings
- 12.17 YFY Inc.
- YFY Inc. - Overview
- YFY Inc. - Business segments
- YFY Inc. - Key offerings
- YFY Inc. - Segment focus
13 Appendix
- 13.1 Scope of the report
- 13.2 Inclusions and exclusions checklist
- Inclusions checklist
- Exclusions checklist
- 13.3 Currency conversion rates for US$
- Currency conversion rates for US$
- 13.4 Research methodology
- Research methodology
- 13.5 Data procurement
- Information sources
- 13.6 Data validation
- Data validation
- 13.7 Validation techniques employed for market sizing
- Validation techniques employed for market sizing
- 13.8 Data synthesis
- Data synthesis
- 360 degree market analysis
- 360 degree market analysis
- 13.10 List of abbreviations
- List of abbreviations

