|
|
市場調査レポート
商品コード
1685602
統合ステッピングモーターの世界市場 2025-2029年Global Integrated Stepper Motor Market 2025-2029 |
||||||
|
|||||||
カスタマイズ可能
|
|||||||


| 統合ステッピングモーターの世界市場 2025-2029年 |
|
出版日: 2025年03月13日
発行: TechNavio
ページ情報: 英文 235 Pages
納期: 即納可能
|

全表示
- 概要
- 図表
- 目次
統合ステッピングモーター市場は2024-2029年に4,760万米ドル、予測期間中のCAGRで6.2%の成長が予測されています。
当レポートでは、統合ステッピングモーター市場の全体的な分析、市場規模・予測、動向、成長促進要因、課題、約25のベンダーを網羅したベンダー分析などを掲載しています。
現在の市場シナリオ、最新動向と促進要因、市場環境全体に関する最新分析を提供しています。市場は、産業施設における自動化機器の需要の増加、低速で高いエネルギー効率を持つモーターへの需要の高まり、産業運営の中断を防ぐ必要性などが原動力となっています。
| 市場範囲 | |
|---|---|
| 基準年 | 2025 |
| 終了年 | 2029 |
| 予測期間 | 2025-2029 |
| 成長モメンタム | 加速 |
| 前年比2025年 | 5.7% |
| CAGR | 6.2% |
| 増分額 | 4,760万米ドル |
本調査は、業界の主要参加者からのインプットを含め、一次情報と二次情報を客観的に組み合わせて実施しました。レポートには、主要企業の分析に加え、包括的な市場規模データ、地域分析によるセグメント、ベンダー情勢が含まれています。レポートには過去データと予測データがあります。
本調査では、今後数年間の統合ステッピングモーター市場の成長を促進する主な理由の1つとして、モーターとドライブにおけるIOTの採用増加を挙げています。また、小型化・コンパクト化されたモーターへのシフトやスマートシティプロジェクトへの投資の増加は、市場の大きな需要につながります。
目次
第1章 エグゼクティブサマリー
- 市場概要
第2章 Technavio分析
- 価格・ライフサイクル・顧客購入バスケット・採用率・購入基準の分析
- インプットの重要性と差別化の要因
- 混乱の要因
- 促進要因と課題の影響
第3章 市場情勢
- 市場エコシステム
- 市場の特徴
- バリューチェーン分析
第4章 市場規模
- 市場の定義
- 市場セグメント分析
- 市場規模 2024
- 市場の見通し 2024-2029
第5章 市場規模実績
- 統合ステッピングモーターの世界市場 2019-2023
- エンドユーザー別セグメント分析 2019-2023
- タイプ別セグメント分析 2019-2023
- 製品別セグメント分析 2019-2023
- 用途別セグメント分析 2019-2023
- 地域別セグメント分析 2019-2023
- 国別セグメント分析 2019-2023
第6章 定性分析
- AIの影響:統合ステッピングモーターの世界市場
第7章 ファイブフォース分析
- ファイブフォースの要約
- 買い手の交渉力
- 供給企業の交渉力
- 新規参入業者の脅威
- 代替品の脅威
- 競争の脅威
- 市況
第8章 市場セグメンテーション:エンドユーザー別
- 市場セグメント
- 比較:エンドユーザー別
- プロセス産業:市場規模と予測 2024-2029
- ディスクリート産業:市場規模と予測 2024-2029
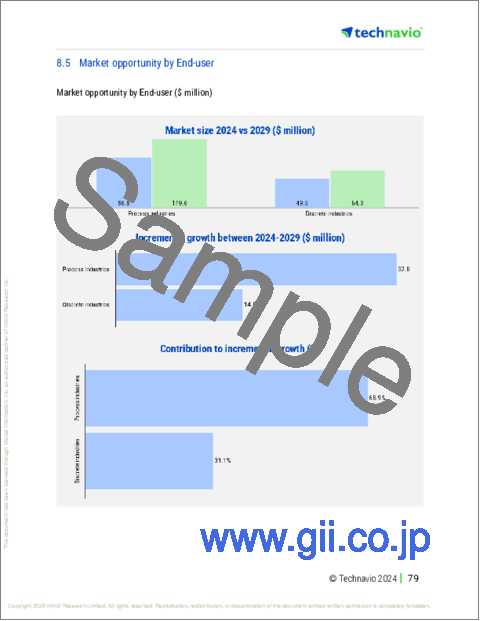
- 市場機会:エンドユーザー別
第9章 市場セグメンテーション:タイプ別
- 市場セグメント
- 比較:タイプ別
- NEMA 17:市場規模と予測 2024-2029
- NEMA 23:市場規模と予測 2024-2029
- 市場機会:タイプ別
第10章 市場セグメンテーション:製品別
- 市場セグメント
- 比較:製品別
- 回転ステッピングモーター:市場規模と予測 2024-2029
- リニアステッピングモーター:市場規模と予測 2024-2029
- 市場機会:製品別
第11章 市場セグメンテーション:用途別
- 市場セグメント
- 比較:用途別
- 産業オートメーション:市場規模と予測 2024-2029
- 医療機器:市場規模と予測 2024-2029
- 自動車:市場規模と予測 2024-2029
- コンシューマーエレクトロニクス:市場規模と予測 2024-2029
- 市場機会:用途別
第12章 顧客情勢
- 顧客情勢の概要
第13章 地域別情勢
- 地域別セグメンテーション
- 地域別比較
- 欧州:市場規模と予測 2024-2029
- 北米:市場規模と予測 2024-2029
- アジア太平洋:市場規模と予測 2024-2029
- 中東・アフリカ:市場規模と予測 2024-2029
- 南米:市場規模と予測 2024-2029
- ドイツ:市場規模と予測 2024-2029
- 米国:市場規模と予測 2024-2029
- イタリア:市場規模と予測 2024-2029
- メキシコ:市場規模と予測 2024-2029
- 中国:市場規模と予測 2024-2029
- フランス:市場規模と予測 2024-2029
- 日本:市場規模と予測 2024-2029
- カナダ:市場規模と予測 2024-2029
- インド:市場規模と予測 2024-2029
- 韓国:市場規模と予測 2024-2029
- 市場機会:地域情勢別
第14章 促進要因・課題・機会・抑制要因
- 市場促進要因
- 市場の課題
- 促進要因と課題の影響
- 市場の機会・抑制要因
第15章 競合情勢
- 概要
- 競合情勢
- 混乱の状況
- 業界のリスク
第16章 競合分析
- 企業プロファイル
- 企業ランキング指数
- 企業の市場ポジショニング
- ABB Ltd.
- Anaheim Automation Inc.
- Beckhoff Automation
- Changzhou Fulling Motor Co. Ltd.
- Danaher Corp.
- Japan Pulse Motor Co. Ltd.
- Leadshine Technology Co. Ltd.
- MinebeaMitsumi Inc.
- Nanotec Electronic GmbH and Co. KG
- Oriental Motor Co. Ltd.
- Panasonic Holdings Corp.
- Parker Hannifin Corp.
- Schneider Electric SE
- Shanghai MOONS Electric Co. Ltd.
- TAMAGAWA SEIKI Co. Ltd.
第17章 付録
Exhibits:
- Exhibits1: Executive Summary - Chart on Market Overview
- Exhibits2: Executive Summary - Data Table on Market Overview
- Exhibits3: Executive Summary - Chart on Global Market Characteristics
- Exhibits4: Executive Summary - Chart on Market By Geographical Landscape
- Exhibits5: Executive Summary - Chart on Market Segmentation by End-user
- Exhibits6: Executive Summary - Chart on Market Segmentation by Type
- Exhibits7: Executive Summary - Chart on Market Segmentation by Product
- Exhibits8: Executive Summary - Chart on Market Segmentation by Application
- Exhibits9: Executive Summary - Chart on Incremental Growth
- Exhibits10: Executive Summary - Data Table on Incremental Growth
- Exhibits11: Executive Summary - Chart on Company Market Positioning
- Exhibits12: Analysis of price sensitivity, lifecycle, customer purchase basket, adoption rates, and purchase criteria
- Exhibits13: Overview on criticality of inputs and factors of differentiation
- Exhibits14: Overview on factors of disruption
- Exhibits15: Impact of drivers and challenges in 2024 and 2029
- Exhibits16: Parent Market
- Exhibits17: Data Table on - Parent Market
- Exhibits18: Market characteristics analysis
- Exhibits19: Value chain analysis
- Exhibits20: Offerings of companies included in the market definition
- Exhibits21: Market segments
- Exhibits22: Chart on Global - Market size and forecast 2024-2029 ($ million)
- Exhibits23: Data Table on Global - Market size and forecast 2024-2029 ($ million)
- Exhibits24: Chart on Global Market: Year-over-year growth 2024-2029 (%)
- Exhibits25: Data Table on Global Market: Year-over-year growth 2024-2029 (%)
- Exhibits26: Historic Market Size - Data Table on Global Integrated Stepper Motor Market 2019 - 2023 ($ million)
- Exhibits27: Historic Market Size - End-user Segment 2019 - 2023 ($ million)
- Exhibits28: Historic Market Size - Type Segment 2019 - 2023 ($ million)
- Exhibits29: Historic Market Size - Product Segment 2019 - 2023 ($ million)
- Exhibits30: Historic Market Size - Application Segment 2019 - 2023 ($ million)
- Exhibits31: Historic Market Size - Geography Segment 2019 - 2023 ($ million)
- Exhibits32: Historic Market Size - Country Segment 2019 - 2023 ($ million)
- Exhibits33: Five forces analysis - Comparison between 2024 and 2029
- Exhibits34: Bargaining power of buyers - Impact of key factors 2024 and 2029
- Exhibits35: Bargaining power of suppliers - Impact of key factors in 2024 and 2029
- Exhibits36: Threat of new entrants - Impact of key factors in 2024 and 2029
- Exhibits37: Threat of substitutes - Impact of key factors in 2024 and 2029
- Exhibits38: Threat of rivalry - Impact of key factors in 2024 and 2029
- Exhibits39: Chart on Market condition - Five forces 2024 and 2029
- Exhibits40: Chart on End-user - Market share 2024-2029 (%)
- Exhibits41: Data Table on End-user - Market share 2024-2029 (%)
- Exhibits42: Chart on Comparison by End-user
- Exhibits43: Data Table on Comparison by End-user
- Exhibits44: Chart on Process industries - Market size and forecast 2024-2029 ($ million)
- Exhibits45: Data Table on Process industries - Market size and forecast 2024-2029 ($ million)
- Exhibits46: Chart on Process industries - Year-over-year growth 2024-2029 (%)
- Exhibits47: Data Table on Process industries - Year-over-year growth 2024-2029 (%)
- Exhibits48: Chart on Discrete industries - Market size and forecast 2024-2029 ($ million)
- Exhibits49: Data Table on Discrete industries - Market size and forecast 2024-2029 ($ million)
- Exhibits50: Chart on Discrete industries - Year-over-year growth 2024-2029 (%)
- Exhibits51: Data Table on Discrete industries - Year-over-year growth 2024-2029 (%)
- Exhibits52: Market opportunity by End-user ($ million)
- Exhibits53: Data Table on Market opportunity by End-user ($ million)
- Exhibits54: Chart on Type - Market share 2024-2029 (%)
- Exhibits55: Data Table on Type - Market share 2024-2029 (%)
- Exhibits56: Chart on Comparison by Type
- Exhibits57: Data Table on Comparison by Type
- Exhibits58: Chart on NEMA17 - Market size and forecast 2024-2029 ($ million)
- Exhibits59: Data Table on NEMA17 - Market size and forecast 2024-2029 ($ million)
- Exhibits60: Chart on NEMA17 - Year-over-year growth 2024-2029 (%)
- Exhibits61: Data Table on NEMA17 - Year-over-year growth 2024-2029 (%)
- Exhibits62: Chart on NEMA23 - Market size and forecast 2024-2029 ($ million)
- Exhibits63: Data Table on NEMA23 - Market size and forecast 2024-2029 ($ million)
- Exhibits64: Chart on NEMA23 - Year-over-year growth 2024-2029 (%)
- Exhibits65: Data Table on NEMA23 - Year-over-year growth 2024-2029 (%)
- Exhibits66: Market opportunity by Type ($ million)
- Exhibits67: Data Table on Market opportunity by Type ($ million)
- Exhibits68: Chart on Product - Market share 2024-2029 (%)
- Exhibits69: Data Table on Product - Market share 2024-2029 (%)
- Exhibits70: Chart on Comparison by Product
- Exhibits71: Data Table on Comparison by Product
- Exhibits72: Chart on Rotary stepper motors - Market size and forecast 2024-2029 ($ million)
- Exhibits73: Data Table on Rotary stepper motors - Market size and forecast 2024-2029 ($ million)
- Exhibits74: Chart on Rotary stepper motors - Year-over-year growth 2024-2029 (%)
- Exhibits75: Data Table on Rotary stepper motors - Year-over-year growth 2024-2029 (%)
- Exhibits76: Chart on Linear stepper motors - Market size and forecast 2024-2029 ($ million)
- Exhibits77: Data Table on Linear stepper motors - Market size and forecast 2024-2029 ($ million)
- Exhibits78: Chart on Linear stepper motors - Year-over-year growth 2024-2029 (%)
- Exhibits79: Data Table on Linear stepper motors - Year-over-year growth 2024-2029 (%)
- Exhibits80: Market opportunity by Product ($ million)
- Exhibits81: Data Table on Market opportunity by Product ($ million)
- Exhibits82: Chart on Application - Market share 2024-2029 (%)
- Exhibits83: Data Table on Application - Market share 2024-2029 (%)
- Exhibits84: Chart on Comparison by Application
- Exhibits85: Data Table on Comparison by Application
- Exhibits86: Chart on Industrial automation - Market size and forecast 2024-2029 ($ million)
- Exhibits87: Data Table on Industrial automation - Market size and forecast 2024-2029 ($ million)
- Exhibits88: Chart on Industrial automation - Year-over-year growth 2024-2029 (%)
- Exhibits89: Data Table on Industrial automation - Year-over-year growth 2024-2029 (%)
- Exhibits90: Chart on Medical devices - Market size and forecast 2024-2029 ($ million)
- Exhibits91: Data Table on Medical devices - Market size and forecast 2024-2029 ($ million)
- Exhibits92: Chart on Medical devices - Year-over-year growth 2024-2029 (%)
- Exhibits93: Data Table on Medical devices - Year-over-year growth 2024-2029 (%)
- Exhibits94: Chart on Automotive - Market size and forecast 2024-2029 ($ million)
- Exhibits95: Data Table on Automotive - Market size and forecast 2024-2029 ($ million)
- Exhibits96: Chart on Automotive - Year-over-year growth 2024-2029 (%)
- Exhibits97: Data Table on Automotive - Year-over-year growth 2024-2029 (%)
- Exhibits98: Chart on Consumer electronics - Market size and forecast 2024-2029 ($ million)
- Exhibits99: Data Table on Consumer electronics - Market size and forecast 2024-2029 ($ million)
- Exhibits100: Chart on Consumer electronics - Year-over-year growth 2024-2029 (%)
- Exhibits101: Data Table on Consumer electronics - Year-over-year growth 2024-2029 (%)
- Exhibits102: Market opportunity by Application ($ million)
- Exhibits103: Data Table on Market opportunity by Application ($ million)
- Exhibits104: Analysis of price sensitivity, lifecycle, customer purchase basket, adoption rates, and purchase criteria
- Exhibits105: Chart on Market share By Geographical Landscape 2024-2029 (%)
- Exhibits106: Data Table on Market share By Geographical Landscape 2024-2029 (%)
- Exhibits107: Chart on Geographic comparison
- Exhibits108: Data Table on Geographic comparison
- Exhibits109: Chart on Europe - Market size and forecast 2024-2029 ($ million)
- Exhibits110: Data Table on Europe - Market size and forecast 2024-2029 ($ million)
- Exhibits111: Chart on Europe - Year-over-year growth 2024-2029 (%)
- Exhibits112: Data Table on Europe - Year-over-year growth 2024-2029 (%)
- Exhibits113: Chart on North America - Market size and forecast 2024-2029 ($ million)
- Exhibits114: Data Table on North America - Market size and forecast 2024-2029 ($ million)
- Exhibits115: Chart on North America - Year-over-year growth 2024-2029 (%)
- Exhibits116: Data Table on North America - Year-over-year growth 2024-2029 (%)
- Exhibits117: Chart on APAC - Market size and forecast 2024-2029 ($ million)
- Exhibits118: Data Table on APAC - Market size and forecast 2024-2029 ($ million)
- Exhibits119: Chart on APAC - Year-over-year growth 2024-2029 (%)
- Exhibits120: Data Table on APAC - Year-over-year growth 2024-2029 (%)
- Exhibits121: Chart on Middle East and Africa - Market size and forecast 2024-2029 ($ million)
- Exhibits122: Data Table on Middle East and Africa - Market size and forecast 2024-2029 ($ million)
- Exhibits123: Chart on Middle East and Africa - Year-over-year growth 2024-2029 (%)
- Exhibits124: Data Table on Middle East and Africa - Year-over-year growth 2024-2029 (%)
- Exhibits125: Chart on South America - Market size and forecast 2024-2029 ($ million)
- Exhibits126: Data Table on South America - Market size and forecast 2024-2029 ($ million)
- Exhibits127: Chart on South America - Year-over-year growth 2024-2029 (%)
- Exhibits128: Data Table on South America - Year-over-year growth 2024-2029 (%)
- Exhibits129: Chart on Germany - Market size and forecast 2024-2029 ($ million)
- Exhibits130: Data Table on Germany - Market size and forecast 2024-2029 ($ million)
- Exhibits131: Chart on Germany - Year-over-year growth 2024-2029 (%)
- Exhibits132: Data Table on Germany - Year-over-year growth 2024-2029 (%)
- Exhibits133: Chart on US - Market size and forecast 2024-2029 ($ million)
- Exhibits134: Data Table on US - Market size and forecast 2024-2029 ($ million)
- Exhibits135: Chart on US - Year-over-year growth 2024-2029 (%)
- Exhibits136: Data Table on US - Year-over-year growth 2024-2029 (%)
- Exhibits137: Chart on Italy - Market size and forecast 2024-2029 ($ million)
- Exhibits138: Data Table on Italy - Market size and forecast 2024-2029 ($ million)
- Exhibits139: Chart on Italy - Year-over-year growth 2024-2029 (%)
- Exhibits140: Data Table on Italy - Year-over-year growth 2024-2029 (%)
- Exhibits141: Chart on Mexico - Market size and forecast 2024-2029 ($ million)
- Exhibits142: Data Table on Mexico - Market size and forecast 2024-2029 ($ million)
- Exhibits143: Chart on Mexico - Year-over-year growth 2024-2029 (%)
- Exhibits144: Data Table on Mexico - Year-over-year growth 2024-2029 (%)
- Exhibits145: Chart on China - Market size and forecast 2024-2029 ($ million)
- Exhibits146: Data Table on China - Market size and forecast 2024-2029 ($ million)
- Exhibits147: Chart on China - Year-over-year growth 2024-2029 (%)
- Exhibits148: Data Table on China - Year-over-year growth 2024-2029 (%)
- Exhibits149: Chart on France - Market size and forecast 2024-2029 ($ million)
- Exhibits150: Data Table on France - Market size and forecast 2024-2029 ($ million)
- Exhibits151: Chart on France - Year-over-year growth 2024-2029 (%)
- Exhibits152: Data Table on France - Year-over-year growth 2024-2029 (%)
- Exhibits153: Chart on Japan - Market size and forecast 2024-2029 ($ million)
- Exhibits154: Data Table on Japan - Market size and forecast 2024-2029 ($ million)
- Exhibits155: Chart on Japan - Year-over-year growth 2024-2029 (%)
- Exhibits156: Data Table on Japan - Year-over-year growth 2024-2029 (%)
- Exhibits157: Chart on Canada - Market size and forecast 2024-2029 ($ million)
- Exhibits158: Data Table on Canada - Market size and forecast 2024-2029 ($ million)
- Exhibits159: Chart on Canada - Year-over-year growth 2024-2029 (%)
- Exhibits160: Data Table on Canada - Year-over-year growth 2024-2029 (%)
- Exhibits161: Chart on India - Market size and forecast 2024-2029 ($ million)
- Exhibits162: Data Table on India - Market size and forecast 2024-2029 ($ million)
- Exhibits163: Chart on India - Year-over-year growth 2024-2029 (%)
- Exhibits164: Data Table on India - Year-over-year growth 2024-2029 (%)
- Exhibits165: Chart on South Korea - Market size and forecast 2024-2029 ($ million)
- Exhibits166: Data Table on South Korea - Market size and forecast 2024-2029 ($ million)
- Exhibits167: Chart on South Korea - Year-over-year growth 2024-2029 (%)
- Exhibits168: Data Table on South Korea - Year-over-year growth 2024-2029 (%)
- Exhibits169: Market opportunity By Geographical Landscape ($ million)
- Exhibits170: Data Tables on Market opportunity By Geographical Landscape ($ million)
- Exhibits171: Impact of drivers and challenges in 2024 and 2029
- Exhibits172: Overview on criticality of inputs and factors of differentiation
- Exhibits173: Overview on factors of disruption
- Exhibits174: Impact of key risks on business
- Exhibits175: Companies covered
- Exhibits176: Company ranking index
- Exhibits177: Matrix on companies position and classification
- Exhibits178: ABB Ltd. - Overview
- Exhibits179: ABB Ltd. - Business segments
- Exhibits180: ABB Ltd. - Key news
- Exhibits181: ABB Ltd. - Key offerings
- Exhibits182: ABB Ltd. - Segment focus
- Exhibits183: SWOT
- Exhibits184: Anaheim Automation Inc. - Overview
- Exhibits185: Anaheim Automation Inc. - Product / Service
- Exhibits186: Anaheim Automation Inc. - Key offerings
- Exhibits187: SWOT
- Exhibits188: Beckhoff Automation - Overview
- Exhibits189: Beckhoff Automation - Product / Service
- Exhibits190: Beckhoff Automation - Key offerings
- Exhibits191: SWOT
- Exhibits192: Changzhou Fulling Motor Co. Ltd. - Overview
- Exhibits193: Changzhou Fulling Motor Co. Ltd. - Product / Service
- Exhibits194: Changzhou Fulling Motor Co. Ltd. - Key offerings
- Exhibits195: SWOT
- Exhibits196: Danaher Corp. - Overview
- Exhibits197: Danaher Corp. - Business segments
- Exhibits198: Danaher Corp. - Key news
- Exhibits199: Danaher Corp. - Key offerings
- Exhibits200: Danaher Corp. - Segment focus
- Exhibits201: SWOT
- Exhibits202: Japan Pulse Motor Co. Ltd. - Overview
- Exhibits203: Japan Pulse Motor Co. Ltd. - Product / Service
- Exhibits204: Japan Pulse Motor Co. Ltd. - Key offerings
- Exhibits205: SWOT
- Exhibits206: Leadshine Technology Co. Ltd. - Overview
- Exhibits207: Leadshine Technology Co. Ltd. - Product / Service
- Exhibits208: Leadshine Technology Co. Ltd. - Key offerings
- Exhibits209: SWOT
- Exhibits210: MinebeaMitsumi Inc. - Overview
- Exhibits211: MinebeaMitsumi Inc. - Business segments
- Exhibits212: MinebeaMitsumi Inc. - Key offerings
- Exhibits213: MinebeaMitsumi Inc. - Segment focus
- Exhibits214: SWOT
- Exhibits215: Nanotec Electronic GmbH and Co. KG - Overview
- Exhibits216: Nanotec Electronic GmbH and Co. KG - Product / Service
- Exhibits217: Nanotec Electronic GmbH and Co. KG - Key offerings
- Exhibits218: SWOT
- Exhibits219: Oriental Motor Co. Ltd. - Overview
- Exhibits220: Oriental Motor Co. Ltd. - Product / Service
- Exhibits221: Oriental Motor Co. Ltd. - Key offerings
- Exhibits222: SWOT
- Exhibits223: Panasonic Holdings Corp. - Overview
- Exhibits224: Panasonic Holdings Corp. - Business segments
- Exhibits225: Panasonic Holdings Corp. - Key news
- Exhibits226: Panasonic Holdings Corp. - Key offerings
- Exhibits227: Panasonic Holdings Corp. - Segment focus
- Exhibits228: SWOT
- Exhibits229: Parker Hannifin Corp. - Overview
- Exhibits230: Parker Hannifin Corp. - Business segments
- Exhibits231: Parker Hannifin Corp. - Key news
- Exhibits232: Parker Hannifin Corp. - Key offerings
- Exhibits233: Parker Hannifin Corp. - Segment focus
- Exhibits234: SWOT
- Exhibits235: Schneider Electric SE - Overview
- Exhibits236: Schneider Electric SE - Business segments
- Exhibits237: Schneider Electric SE - Key news
- Exhibits238: Schneider Electric SE - Key offerings
- Exhibits239: Schneider Electric SE - Segment focus
- Exhibits240: SWOT
- Exhibits241: Shanghai MOONS Electric Co. Ltd. - Overview
- Exhibits242: Shanghai MOONS Electric Co. Ltd. - Product / Service
- Exhibits243: Shanghai MOONS Electric Co. Ltd. - Key offerings
- Exhibits244: SWOT
- Exhibits245: TAMAGAWA SEIKI Co. Ltd. - Overview
- Exhibits246: TAMAGAWA SEIKI Co. Ltd. - Product / Service
- Exhibits247: TAMAGAWA SEIKI Co. Ltd. - Key offerings
- Exhibits248: SWOT
- Exhibits249: Inclusions checklist
- Exhibits250: Exclusions checklist
- Exhibits251: Currency conversion rates for US$
- Exhibits252: Research methodology
- Exhibits253: Information sources
- Exhibits254: Data validation
- Exhibits255: Validation techniques employed for market sizing
- Exhibits256: Data synthesis
- Exhibits257: 360 degree market analysis
- Exhibits258: List of abbreviations
The integrated stepper motor market is forecasted to grow by USD 47.6 million during 2024-2029, accelerating at a CAGR of 6.2% during the forecast period. The report on the integrated stepper motor market provides a holistic analysis, market size and forecast, trends, growth drivers, and challenges, as well as vendor analysis covering around 25 vendors.
The report offers an up-to-date analysis regarding the current market scenario, the latest trends and drivers, and the overall market environment. The market is driven by increase in demand for automated equipment in industrial premises, growing demand for motors with high energy efficiency at low speeds, and need to ensure uninterrupted industrial operations.
| Market Scope | |
|---|---|
| Base Year | 2025 |
| End Year | 2029 |
| Series Year | 2025-2029 |
| Growth Momentum | Accelerate |
| YOY 2025 | 5.7% |
| CAGR | 6.2% |
| Incremental Value | $47.6 mn |
The study was conducted using an objective combination of primary and secondary information including inputs from key participants in the industry. The report contains a comprehensive market size data, segment with regional analysis and vendor landscape in addition to an analysis of the key companies. Reports have historic and forecast data.
Technavio's integrated stepper motor market is segmented as below:
By End-user
- Process industries
- Discrete industries
By Type
- NEMA17
- NEMA23
By Product
- Rotary stepper motors
- Linear stepper motors
By Application
- Industrial automation
- Medical devices
- Automotive
- Consumer electronics
By Geographical Landscape
- Europe
- North America
- APAC
- Middle East and Africa
- South America
This study identifies the increased adoption of IOT in motors and drives as one of the prime reasons driving the integrated stepper motor market growth during the next few years. Also, shift toward miniaturized and compact motors and growing investments in smart city projects will lead to sizable demand in the market.
The report on the integrated stepper motor market covers the following areas:
- Integrated Stepper Motor Market sizing
- Integrated Stepper Motor Market forecast
- Integrated Stepper Motor Market industry analysis
The robust vendor analysis is designed to help clients improve their market position, and in line with this, this report provides a detailed analysis of several leading integrated stepper motor market vendors that include ABB Ltd., ACT Motor Co. Ltd., Advanced Micro Controls Inc., Anaheim Automation Inc., Arcus Servo Motion Inc., Beckhoff Automation, Changzhou Fulling Motor Co. Ltd., Danaher Corp., DMI Technology Corp., FAULHABER GROUP, Japan Pulse Motor Co. Ltd., Leadshine Technology Co. Ltd., MinebeaMitsumi Inc., Nanotec Electronic GmbH and Co. KG, Oriental Motor Co. Ltd., Panasonic Holdings Corp., Parker Hannifin Corp., Schneider Electric SE, Shanghai MOONS Electric Co. Ltd., and TAMAGAWA SEIKI Co. Ltd.. Also, the integrated stepper motor market analysis report includes information on upcoming trends and challenges that will influence market growth. This is to help companies strategize and leverage all forthcoming growth opportunities.
The publisher presents a detailed picture of the market by the way of study, synthesis, and summation of data from multiple sources by an analysis of key parameters such as profit, pricing, competition, and promotions. It presents various market facets by identifying the key industry influencers. The data presented is comprehensive, reliable, and a result of extensive primary and secondary research. The market research reports provide a complete competitive landscape and an in-depth vendor selection methodology and analysis using qualitative and quantitative research to forecast accurate market growth.
Table of Contents
1 Executive Summary
- 1.1 Market overview
- Executive Summary - Chart on Market Overview
- Executive Summary - Data Table on Market Overview
- Executive Summary - Chart on Global Market Characteristics
- Executive Summary - Chart on Market By Geographical Landscape
- Executive Summary - Chart on Market Segmentation by End-user
- Executive Summary - Chart on Market Segmentation by Type
- Executive Summary - Chart on Market Segmentation by Product
- Executive Summary - Chart on Market Segmentation by Application
- Executive Summary - Chart on Incremental Growth
- Executive Summary - Data Table on Incremental Growth
- Executive Summary - Chart on Company Market Positioning
2 Technavio Analysis
- 2.1 Analysis of price sensitivity, lifecycle, customer purchase basket, adoption rates, and purchase criteria
- Analysis of price sensitivity, lifecycle, customer purchase basket, adoption rates, and purchase criteria
- 2.2 Criticality of inputs and Factors of differentiation
- Overview on criticality of inputs and factors of differentiation
- 2.3 Factors of disruption
- Overview on factors of disruption
- 2.4 Impact of drivers and challenges
- Impact of drivers and challenges in 2024 and 2029
3 Market Landscape
- 3.1 Market ecosystem
- Parent Market
- Data Table on - Parent Market
- 3.2 Market characteristics
- Market characteristics analysis
- 3.3 Value chain analysis
- Value chain analysis
4 Market Sizing
- 4.1 Market definition
- Offerings of companies included in the market definition
- 4.2 Market segment analysis
- Market segments
- 4.3 Market size 2024
- 4.4 Market outlook: Forecast for 2024-2029
- Chart on Global - Market size and forecast 2024-2029 ($ million)
- Data Table on Global - Market size and forecast 2024-2029 ($ million)
- Chart on Global Market: Year-over-year growth 2024-2029 (%)
- Data Table on Global Market: Year-over-year growth 2024-2029 (%)
5 Historic Market Size
- 5.1 Global Integrated Stepper Motor Market 2019 - 2023
- Historic Market Size - Data Table on Global Integrated Stepper Motor Market 2019 - 2023 ($ million)
- 5.2 End-user segment analysis 2019 - 2023
- Historic Market Size - End-user Segment 2019 - 2023 ($ million)
- 5.3 Type segment analysis 2019 - 2023
- Historic Market Size - Type Segment 2019 - 2023 ($ million)
- 5.4 Product segment analysis 2019 - 2023
- Historic Market Size - Product Segment 2019 - 2023 ($ million)
- 5.5 Application segment analysis 2019 - 2023
- Historic Market Size - Application Segment 2019 - 2023 ($ million)
- 5.6 Geography segment analysis 2019 - 2023
- Historic Market Size - Geography Segment 2019 - 2023 ($ million)
- 5.7 Country segment analysis 2019 - 2023
- Historic Market Size - Country Segment 2019 - 2023 ($ million)
6 Qualitative Analysis
- 6.1 The AI impact on Global Integrated Stepper Motor Market
7 Five Forces Analysis
- 7.1 Five forces summary
- Five forces analysis - Comparison between 2024 and 2029
- 7.2 Bargaining power of buyers
- Bargaining power of buyers - Impact of key factors 2024 and 2029
- 7.3 Bargaining power of suppliers
- Bargaining power of suppliers - Impact of key factors in 2024 and 2029
- 7.4 Threat of new entrants
- Threat of new entrants - Impact of key factors in 2024 and 2029
- 7.5 Threat of substitutes
- Threat of substitutes - Impact of key factors in 2024 and 2029
- 7.6 Threat of rivalry
- Threat of rivalry - Impact of key factors in 2024 and 2029
- 7.7 Market condition
- Chart on Market condition - Five forces 2024 and 2029
8 Market Segmentation by End-user
- 8.1 Market segments
- Chart on End-user - Market share 2024-2029 (%)
- Data Table on End-user - Market share 2024-2029 (%)
- 8.2 Comparison by End-user
- Chart on Comparison by End-user
- Data Table on Comparison by End-user
- 8.3 Process industries - Market size and forecast 2024-2029
- Chart on Process industries - Market size and forecast 2024-2029 ($ million)
- Data Table on Process industries - Market size and forecast 2024-2029 ($ million)
- Chart on Process industries - Year-over-year growth 2024-2029 (%)
- Data Table on Process industries - Year-over-year growth 2024-2029 (%)
- 8.4 Discrete industries - Market size and forecast 2024-2029
- Chart on Discrete industries - Market size and forecast 2024-2029 ($ million)
- Data Table on Discrete industries - Market size and forecast 2024-2029 ($ million)
- Chart on Discrete industries - Year-over-year growth 2024-2029 (%)
- Data Table on Discrete industries - Year-over-year growth 2024-2029 (%)
- 8.5 Market opportunity by End-user
- Market opportunity by End-user ($ million)
- Data Table on Market opportunity by End-user ($ million)
9 Market Segmentation by Type
- 9.1 Market segments
- Chart on Type - Market share 2024-2029 (%)
- Data Table on Type - Market share 2024-2029 (%)
- 9.2 Comparison by Type
- Chart on Comparison by Type
- Data Table on Comparison by Type
- 9.3 NEMA17 - Market size and forecast 2024-2029
- Chart on NEMA17 - Market size and forecast 2024-2029 ($ million)
- Data Table on NEMA17 - Market size and forecast 2024-2029 ($ million)
- Chart on NEMA17 - Year-over-year growth 2024-2029 (%)
- Data Table on NEMA17 - Year-over-year growth 2024-2029 (%)
- 9.4 NEMA23 - Market size and forecast 2024-2029
- Chart on NEMA23 - Market size and forecast 2024-2029 ($ million)
- Data Table on NEMA23 - Market size and forecast 2024-2029 ($ million)
- Chart on NEMA23 - Year-over-year growth 2024-2029 (%)
- Data Table on NEMA23 - Year-over-year growth 2024-2029 (%)
- 9.5 Market opportunity by Type
- Market opportunity by Type ($ million)
- Data Table on Market opportunity by Type ($ million)
10 Market Segmentation by Product
- 10.1 Market segments
- Chart on Product - Market share 2024-2029 (%)
- Data Table on Product - Market share 2024-2029 (%)
- 10.2 Comparison by Product
- Chart on Comparison by Product
- Data Table on Comparison by Product
- 10.3 Rotary stepper motors - Market size and forecast 2024-2029
- Chart on Rotary stepper motors - Market size and forecast 2024-2029 ($ million)
- Data Table on Rotary stepper motors - Market size and forecast 2024-2029 ($ million)
- Chart on Rotary stepper motors - Year-over-year growth 2024-2029 (%)
- Data Table on Rotary stepper motors - Year-over-year growth 2024-2029 (%)
- 10.4 Linear stepper motors - Market size and forecast 2024-2029
- Chart on Linear stepper motors - Market size and forecast 2024-2029 ($ million)
- Data Table on Linear stepper motors - Market size and forecast 2024-2029 ($ million)
- Chart on Linear stepper motors - Year-over-year growth 2024-2029 (%)
- Data Table on Linear stepper motors - Year-over-year growth 2024-2029 (%)
- 10.5 Market opportunity by Product
- Market opportunity by Product ($ million)
- Data Table on Market opportunity by Product ($ million)
11 Market Segmentation by Application
- 11.1 Market segments
- Chart on Application - Market share 2024-2029 (%)
- Data Table on Application - Market share 2024-2029 (%)
- 11.2 Comparison by Application
- Chart on Comparison by Application
- Data Table on Comparison by Application
- 11.3 Industrial automation - Market size and forecast 2024-2029
- Chart on Industrial automation - Market size and forecast 2024-2029 ($ million)
- Data Table on Industrial automation - Market size and forecast 2024-2029 ($ million)
- Chart on Industrial automation - Year-over-year growth 2024-2029 (%)
- Data Table on Industrial automation - Year-over-year growth 2024-2029 (%)
- 11.4 Medical devices - Market size and forecast 2024-2029
- Chart on Medical devices - Market size and forecast 2024-2029 ($ million)
- Data Table on Medical devices - Market size and forecast 2024-2029 ($ million)
- Chart on Medical devices - Year-over-year growth 2024-2029 (%)
- Data Table on Medical devices - Year-over-year growth 2024-2029 (%)
- 11.5 Automotive - Market size and forecast 2024-2029
- Chart on Automotive - Market size and forecast 2024-2029 ($ million)
- Data Table on Automotive - Market size and forecast 2024-2029 ($ million)
- Chart on Automotive - Year-over-year growth 2024-2029 (%)
- Data Table on Automotive - Year-over-year growth 2024-2029 (%)
- 11.6 Consumer electronics - Market size and forecast 2024-2029
- Chart on Consumer electronics - Market size and forecast 2024-2029 ($ million)
- Data Table on Consumer electronics - Market size and forecast 2024-2029 ($ million)
- Chart on Consumer electronics - Year-over-year growth 2024-2029 (%)
- Data Table on Consumer electronics - Year-over-year growth 2024-2029 (%)
- 11.7 Market opportunity by Application
- Market opportunity by Application ($ million)
- Data Table on Market opportunity by Application ($ million)
12 Customer Landscape
- 12.1 Customer landscape overview
- Analysis of price sensitivity, lifecycle, customer purchase basket, adoption rates, and purchase criteria
13 Geographic Landscape
- 13.1 Geographic segmentation
- Chart on Market share By Geographical Landscape 2024-2029 (%)
- Data Table on Market share By Geographical Landscape 2024-2029 (%)
- 13.2 Geographic comparison
- Chart on Geographic comparison
- Data Table on Geographic comparison
- 13.3 Europe - Market size and forecast 2024-2029
- Chart on Europe - Market size and forecast 2024-2029 ($ million)
- Data Table on Europe - Market size and forecast 2024-2029 ($ million)
- Chart on Europe - Year-over-year growth 2024-2029 (%)
- Data Table on Europe - Year-over-year growth 2024-2029 (%)
- 13.4 North America - Market size and forecast 2024-2029
- Chart on North America - Market size and forecast 2024-2029 ($ million)
- Data Table on North America - Market size and forecast 2024-2029 ($ million)
- Chart on North America - Year-over-year growth 2024-2029 (%)
- Data Table on North America - Year-over-year growth 2024-2029 (%)
- 13.5 APAC - Market size and forecast 2024-2029
- Chart on APAC - Market size and forecast 2024-2029 ($ million)
- Data Table on APAC - Market size and forecast 2024-2029 ($ million)
- Chart on APAC - Year-over-year growth 2024-2029 (%)
- Data Table on APAC - Year-over-year growth 2024-2029 (%)
- 13.6 Middle East and Africa - Market size and forecast 2024-2029
- Chart on Middle East and Africa - Market size and forecast 2024-2029 ($ million)
- Data Table on Middle East and Africa - Market size and forecast 2024-2029 ($ million)
- Chart on Middle East and Africa - Year-over-year growth 2024-2029 (%)
- Data Table on Middle East and Africa - Year-over-year growth 2024-2029 (%)
- 13.7 South America - Market size and forecast 2024-2029
- Chart on South America - Market size and forecast 2024-2029 ($ million)
- Data Table on South America - Market size and forecast 2024-2029 ($ million)
- Chart on South America - Year-over-year growth 2024-2029 (%)
- Data Table on South America - Year-over-year growth 2024-2029 (%)
- 13.8 Germany - Market size and forecast 2024-2029
- Chart on Germany - Market size and forecast 2024-2029 ($ million)
- Data Table on Germany - Market size and forecast 2024-2029 ($ million)
- Chart on Germany - Year-over-year growth 2024-2029 (%)
- Data Table on Germany - Year-over-year growth 2024-2029 (%)
- 13.9 US - Market size and forecast 2024-2029
- Chart on US - Market size and forecast 2024-2029 ($ million)
- Data Table on US - Market size and forecast 2024-2029 ($ million)
- Chart on US - Year-over-year growth 2024-2029 (%)
- Data Table on US - Year-over-year growth 2024-2029 (%)
- 13.10 Italy - Market size and forecast 2024-2029
- Chart on Italy - Market size and forecast 2024-2029 ($ million)
- Data Table on Italy - Market size and forecast 2024-2029 ($ million)
- Chart on Italy - Year-over-year growth 2024-2029 (%)
- Data Table on Italy - Year-over-year growth 2024-2029 (%)
- 13.11 Mexico - Market size and forecast 2024-2029
- Chart on Mexico - Market size and forecast 2024-2029 ($ million)
- Data Table on Mexico - Market size and forecast 2024-2029 ($ million)
- Chart on Mexico - Year-over-year growth 2024-2029 (%)
- Data Table on Mexico - Year-over-year growth 2024-2029 (%)
- 13.12 China - Market size and forecast 2024-2029
- Chart on China - Market size and forecast 2024-2029 ($ million)
- Data Table on China - Market size and forecast 2024-2029 ($ million)
- Chart on China - Year-over-year growth 2024-2029 (%)
- Data Table on China - Year-over-year growth 2024-2029 (%)
- 13.13 France - Market size and forecast 2024-2029
- Chart on France - Market size and forecast 2024-2029 ($ million)
- Data Table on France - Market size and forecast 2024-2029 ($ million)
- Chart on France - Year-over-year growth 2024-2029 (%)
- Data Table on France - Year-over-year growth 2024-2029 (%)
- 13.14 Japan - Market size and forecast 2024-2029
- Chart on Japan - Market size and forecast 2024-2029 ($ million)
- Data Table on Japan - Market size and forecast 2024-2029 ($ million)
- Chart on Japan - Year-over-year growth 2024-2029 (%)
- Data Table on Japan - Year-over-year growth 2024-2029 (%)
- 13.15 Canada - Market size and forecast 2024-2029
- Chart on Canada - Market size and forecast 2024-2029 ($ million)
- Data Table on Canada - Market size and forecast 2024-2029 ($ million)
- Chart on Canada - Year-over-year growth 2024-2029 (%)
- Data Table on Canada - Year-over-year growth 2024-2029 (%)
- 13.16 India - Market size and forecast 2024-2029
- Chart on India - Market size and forecast 2024-2029 ($ million)
- Data Table on India - Market size and forecast 2024-2029 ($ million)
- Chart on India - Year-over-year growth 2024-2029 (%)
- Data Table on India - Year-over-year growth 2024-2029 (%)
- 13.17 South Korea - Market size and forecast 2024-2029
- Chart on South Korea - Market size and forecast 2024-2029 ($ million)
- Data Table on South Korea - Market size and forecast 2024-2029 ($ million)
- Chart on South Korea - Year-over-year growth 2024-2029 (%)
- Data Table on South Korea - Year-over-year growth 2024-2029 (%)
- 13.18 Market opportunity By Geographical Landscape
- Market opportunity By Geographical Landscape ($ million)
- Data Tables on Market opportunity By Geographical Landscape ($ million)
14 Drivers, Challenges, and Opportunity/Restraints
- 14.1 Market drivers
- 14.2 Market challenges
- 14.3 Impact of drivers and challenges
- Impact of drivers and challenges in 2024 and 2029
- 14.4 Market opportunities/restraints
15 Competitive Landscape
- 15.1 Overview
- 15.2 Competitive Landscape
- Overview on criticality of inputs and factors of differentiation
- 15.3 Landscape disruption
- Overview on factors of disruption
- 15.4 Industry risks
- Impact of key risks on business
16 Competitive Analysis
- 16.1 Companies profiled
- Companies covered
- 16.2 Company ranking index
- Company ranking index
- 16.3 Market positioning of companies
- Matrix on companies position and classification
- 16.4 ABB Ltd.
- ABB Ltd. - Overview
- ABB Ltd. - Business segments
- ABB Ltd. - Key news
- ABB Ltd. - Key offerings
- ABB Ltd. - Segment focus
- SWOT
- 16.5 Anaheim Automation Inc.
- Anaheim Automation Inc. - Overview
- Anaheim Automation Inc. - Product / Service
- Anaheim Automation Inc. - Key offerings
- SWOT
- 16.6 Beckhoff Automation
- Beckhoff Automation - Overview
- Beckhoff Automation - Product / Service
- Beckhoff Automation - Key offerings
- SWOT
- 16.7 Changzhou Fulling Motor Co. Ltd.
- Changzhou Fulling Motor Co. Ltd. - Overview
- Changzhou Fulling Motor Co. Ltd. - Product / Service
- Changzhou Fulling Motor Co. Ltd. - Key offerings
- SWOT
- 16.8 Danaher Corp.
- Danaher Corp. - Overview
- Danaher Corp. - Business segments
- Danaher Corp. - Key news
- Danaher Corp. - Key offerings
- Danaher Corp. - Segment focus
- SWOT
- 16.9 Japan Pulse Motor Co. Ltd.
- Japan Pulse Motor Co. Ltd. - Overview
- Japan Pulse Motor Co. Ltd. - Product / Service
- Japan Pulse Motor Co. Ltd. - Key offerings
- SWOT
- 16.10 Leadshine Technology Co. Ltd.
- Leadshine Technology Co. Ltd. - Overview
- Leadshine Technology Co. Ltd. - Product / Service
- Leadshine Technology Co. Ltd. - Key offerings
- SWOT
- 16.11 MinebeaMitsumi Inc.
- MinebeaMitsumi Inc. - Overview
- MinebeaMitsumi Inc. - Business segments
- MinebeaMitsumi Inc. - Key offerings
- MinebeaMitsumi Inc. - Segment focus
- SWOT
- 16.12 Nanotec Electronic GmbH and Co. KG
- Nanotec Electronic GmbH and Co. KG - Overview
- Nanotec Electronic GmbH and Co. KG - Product / Service
- Nanotec Electronic GmbH and Co. KG - Key offerings
- SWOT
- 16.13 Oriental Motor Co. Ltd.
- Oriental Motor Co. Ltd. - Overview
- Oriental Motor Co. Ltd. - Product / Service
- Oriental Motor Co. Ltd. - Key offerings
- SWOT
- 16.14 Panasonic Holdings Corp.
- Panasonic Holdings Corp. - Overview
- Panasonic Holdings Corp. - Business segments
- Panasonic Holdings Corp. - Key news
- Panasonic Holdings Corp. - Key offerings
- Panasonic Holdings Corp. - Segment focus
- SWOT
- 16.15 Parker Hannifin Corp.
- Parker Hannifin Corp. - Overview
- Parker Hannifin Corp. - Business segments
- Parker Hannifin Corp. - Key news
- Parker Hannifin Corp. - Key offerings
- Parker Hannifin Corp. - Segment focus
- SWOT
- 16.16 Schneider Electric SE
- Schneider Electric SE - Overview
- Schneider Electric SE - Business segments
- Schneider Electric SE - Key news
- Schneider Electric SE - Key offerings
- Schneider Electric SE - Segment focus
- SWOT
- 16.17 Shanghai MOONS Electric Co. Ltd.
- Shanghai MOONS Electric Co. Ltd. - Overview
- Shanghai MOONS Electric Co. Ltd. - Product / Service
- Shanghai MOONS Electric Co. Ltd. - Key offerings
- SWOT
- 16.18 TAMAGAWA SEIKI Co. Ltd.
- TAMAGAWA SEIKI Co. Ltd. - Overview
- TAMAGAWA SEIKI Co. Ltd. - Product / Service
- TAMAGAWA SEIKI Co. Ltd. - Key offerings
- SWOT
17 Appendix
- 17.1 Scope of the report
- 17.2 Inclusions and exclusions checklist
- Inclusions checklist
- Exclusions checklist
- 17.3 Currency conversion rates for US$
- Currency conversion rates for US$
- 17.4 Research methodology
- Research methodology
- 17.5 Data procurement
- Information sources
- 17.6 Data validation
- Data validation
- 17.7 Validation techniques employed for market sizing
- Validation techniques employed for market sizing
- 17.8 Data synthesis
- Data synthesis
- 17.9 360 degree market analysis
- 360 degree market analysis
- 17.10 List of abbreviations
- List of abbreviations

