|
|
市場調査レポート
商品コード
1792177
ハイブリッド冷却塔の世界市場、2025年~2029年Global Hybrid Cooling Towers Market 2025-2029 |
||||||

|
|||||||
カスタマイズ可能
|
|||||||


| ハイブリッド冷却塔の世界市場、2025年~2029年 |
|
出版日: 2025年08月13日
発行: TechNavio
ページ情報: 英文 223 Pages
納期: 即納可能
|

全表示
- 概要
- 図表
- 目次
ハイブリッド冷却塔市場は2024-2029年に2億4,460万米ドル、予測期間中のCAGRで4.6%の成長が予測されています。
当レポートでは、ハイブリッド冷却塔市場の全体的な分析、市場規模・予測、動向、成長促進要因、課題、約25のベンダーを網羅したベンダー分析などを掲載しています。
現在の市場シナリオ、最新動向と促進要因、市場環境全体に関する最新分析を提供しています。市場は、データセンター建設の増加、環境負荷低減ニーズの高まり、原子力発電所の増加などが牽引しています。
| 市場範囲 | |
|---|---|
| 基準年 | 2025 |
| 終了年 | 2029 |
| 予測期間 | 2025-2029 |
| 成長モメンタム | 加速 |
| 前年比 | 4.3% |
| CAGR | 4.6% |
| 増分額 | 2億4,460万米ドル |
本調査は、業界の主要参加者からのインプットを含め、一次情報と二次情報を客観的に組み合わせて実施しました。レポートには、主要企業の分析に加え、包括的な市場規模データ、地域別分析によるセグメント、ベンダー情勢が含まれています。レポートには過去データと予測データがあります。
本調査では、今後数年間のハイブリッド冷却塔市場の成長を促進する主な理由の1つとして、ハイブリッド閉回路冷却塔の出現を挙げています。また、ハイブリッド冷却塔のレンタルが可能であることや、ハイブリッド冷却塔にIoTが組み込まれることが、市場の大きな需要につながるでしょう。
目次
第1章 エグゼクティブサマリー
- 市場概要
第2章 Technavio分析
- 価格・ライフサイクル・顧客購入バスケット・採用率・購入基準の分析
- インプットの重要性と差別化の要因
- 混乱の要因
- 促進要因と課題の影響
第3章 市場情勢
- 市場エコシステム
- 市場の特徴
- バリューチェーン分析
第4章 市場規模
- 市場の定義
- 市場セグメント分析
- 市場規模 2024
- 市場の見通し 2024-2029
第5章 市場規模実績
- ハイブリッド冷却塔の世界市場 2019-2023
- アプリケーション別セグメント分析 2019-2023
- タイプ別セグメント分析 2019-2023
- 材料別セグメント分析 2019-2023
- 地域別セグメント分析 2019-2023
- 国別セグメント分析 2019-2023
第6章 定性分析
- AIの影響:ハイブリッド冷却塔の世界市場
第7章 ファイブフォース分析
- ファイブフォースの要約
- 買い手の交渉力
- 供給企業の交渉力
- 新規参入業者の脅威
- 代替品の脅威
- 競争の脅威
- 市況
第8章 市場セグメンテーション:アプリケーション別
- 市場セグメント
- 比較:アプリケーション別
- 発電:市場規模と予測 2024-2029
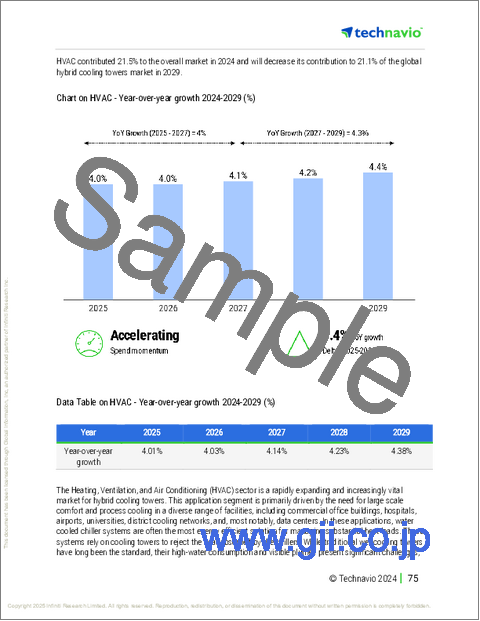
- HVAC:市場規模と予測 2024-2029
- 石油・ガス:市場規模と予測 2024-2029
- 化学・石油化学:市場規模と予測 2024-2029
- その他:市場規模と予測 2024-2029
- 市場機会:アプリケーション別
第9章 市場セグメンテーション:タイプ別
- 市場セグメント
- 比較:タイプ別
- DC:市場規模と予測 2024-2029
- 閉回路:市場規模と予測 2024-2029
- 市場機会:タイプ別
第10章 市場セグメンテーション:材料別
- 市場セグメント
- 比較:材料別
- 鋼鉄:市場規模と予測 2024-2029
- コンクリート:市場規模と予測 2024-2029
- FRP:市場規模と予測 2024-2029
- 市場機会:材料別
第11章 顧客情勢
- 顧客情勢の概要
第12章 地域別情勢
- 地域別セグメンテーション
- 地域別比較
- アジア太平洋:市場規模と予測 2024-2029
- 欧州:市場規模と予測 2024-2029
- 北米:市場規模と予測 2024-2029
- 中東・アフリカ:市場規模と予測 2024-2029
- 南米:市場規模と予測 2024-2029
- 米国:市場規模と予測 2024-2029
- 中国:市場規模と予測 2024-2029
- 日本:市場規模と予測 2024-2029
- インド:市場規模と予測 2024-2029
- 英国:市場規模と予測 2024-2029
- ドイツ:市場規模と予測 2024-2029
- 韓国:市場規模と予測 2024-2029
- カナダ:市場規模と予測 2024-2029
- フランス:市場規模と予測 2024-2029
- イタリア:市場規模と予測 2024-2029
- 市場機会:地域情勢別
第13章 促進要因・課題・機会・抑制要因
- 市場促進要因
- 市場の課題
- 促進要因と課題の影響
- 市場の機会・抑制要因
第14章 競合情勢
- 概要
- 競合情勢
- 混乱の状況
- 業界のリスク
第15章 競合分析
- 企業プロファイル
- 企業ランキング指数
- 企業の市場ポジショニング
- Babcock and Wilcox Enterprises Inc.
- Baltimore Aircoil Co.
- Composite Cooling Solutions LP
- Delta Cooling Towers Inc.
- ENEXIO Management GmbH
- EUROCONFORT GROUP LLC
- EVAPCO Inc.
- FANS AS
- Hamon S.A.
- Harrison Cooling Towers Pvt. Ltd.
- Konuk Isi
- Kuken Kogyo Co. Ltd.
- MITA Cooling Technologies Srl
- North Street Cooling Towers Pvt. Ltd.
- SPX Technologies Inc.
第16章 付録
Exhibits:
- Exhibits1: Executive Summary - Chart on Market Overview
- Exhibits2: Executive Summary - Data Table on Market Overview
- Exhibits3: Executive Summary - Chart on Global Market Characteristics
- Exhibits4: Executive Summary - Chart on Market By Geographical Landscape
- Exhibits5: Executive Summary - Chart on Market Segmentation by Application
- Exhibits6: Executive Summary - Chart on Market Segmentation by Type
- Exhibits7: Executive Summary - Chart on Market Segmentation by Material
- Exhibits8: Executive Summary - Chart on Incremental Growth
- Exhibits9: Executive Summary - Data Table on Incremental Growth
- Exhibits10: Executive Summary - Chart on Company Market Positioning
- Exhibits11: Analysis of price sensitivity, lifecycle, customer purchase basket, adoption rates, and purchase criteria
- Exhibits12: Overview on criticality of inputs and factors of differentiation
- Exhibits13: Overview on factors of disruption
- Exhibits14: Impact of drivers and challenges in 2024 and 2029
- Exhibits15: Parent Market
- Exhibits16: Data Table on - Parent Market
- Exhibits17: Market characteristics analysis
- Exhibits18: Value chain analysis
- Exhibits19: Offerings of companies included in the market definition
- Exhibits20: Market segments
- Exhibits21: Chart on Global - Market size and forecast 2024-2029 ($ million)
- Exhibits22: Data Table on Global - Market size and forecast 2024-2029 ($ million)
- Exhibits23: Chart on Global Market: Year-over-year growth 2024-2029 (%)
- Exhibits24: Data Table on Global Market: Year-over-year growth 2024-2029 (%)
- Exhibits25: Historic Market Size - Data Table on Global Hybrid Cooling Towers Market 2019 - 2023 ($ million)
- Exhibits26: Historic Market Size - Application Segment 2019 - 2023 ($ million)
- Exhibits27: Historic Market Size - Type Segment 2019 - 2023 ($ million)
- Exhibits28: Historic Market Size - Material Segment 2019 - 2023 ($ million)
- Exhibits29: Historic Market Size - Geography Segment 2019 - 2023 ($ million)
- Exhibits30: Historic Market Size - Country Segment 2019 - 2023 ($ million)
- Exhibits31: Five forces analysis - Comparison between 2024 and 2029
- Exhibits32: Bargaining power of buyers - Impact of key factors 2024 and 2029
- Exhibits33: Bargaining power of suppliers - Impact of key factors in 2024 and 2029
- Exhibits34: Threat of new entrants - Impact of key factors in 2024 and 2029
- Exhibits35: Threat of substitutes - Impact of key factors in 2024 and 2029
- Exhibits36: Threat of rivalry - Impact of key factors in 2024 and 2029
- Exhibits37: Chart on Market condition - Five forces 2024 and 2029
- Exhibits38: Chart on Application - Market share 2024-2029 (%)
- Exhibits39: Data Table on Application - Market share 2024-2029 (%)
- Exhibits40: Chart on Comparison by Application
- Exhibits41: Data Table on Comparison by Application
- Exhibits42: Chart on Power generation - Market size and forecast 2024-2029 ($ million)
- Exhibits43: Data Table on Power generation - Market size and forecast 2024-2029 ($ million)
- Exhibits44: Chart on Power generation - Year-over-year growth 2024-2029 (%)
- Exhibits45: Data Table on Power generation - Year-over-year growth 2024-2029 (%)
- Exhibits46: Chart on HVAC - Market size and forecast 2024-2029 ($ million)
- Exhibits47: Data Table on HVAC - Market size and forecast 2024-2029 ($ million)
- Exhibits48: Chart on HVAC - Year-over-year growth 2024-2029 (%)
- Exhibits49: Data Table on HVAC - Year-over-year growth 2024-2029 (%)
- Exhibits50: Chart on Oil and gas - Market size and forecast 2024-2029 ($ million)
- Exhibits51: Data Table on Oil and gas - Market size and forecast 2024-2029 ($ million)
- Exhibits52: Chart on Oil and gas - Year-over-year growth 2024-2029 (%)
- Exhibits53: Data Table on Oil and gas - Year-over-year growth 2024-2029 (%)
- Exhibits54: Chart on Chemical and petrochemical - Market size and forecast 2024-2029 ($ million)
- Exhibits55: Data Table on Chemical and petrochemical - Market size and forecast 2024-2029 ($ million)
- Exhibits56: Chart on Chemical and petrochemical - Year-over-year growth 2024-2029 (%)
- Exhibits57: Data Table on Chemical and petrochemical - Year-over-year growth 2024-2029 (%)
- Exhibits58: Chart on Others - Market size and forecast 2024-2029 ($ million)
- Exhibits59: Data Table on Others - Market size and forecast 2024-2029 ($ million)
- Exhibits60: Chart on Others - Year-over-year growth 2024-2029 (%)
- Exhibits61: Data Table on Others - Year-over-year growth 2024-2029 (%)
- Exhibits62: Market opportunity by Application ($ million)
- Exhibits63: Data Table on Market opportunity by Application ($ million)
- Exhibits64: Chart on Type - Market share 2024-2029 (%)
- Exhibits65: Data Table on Type - Market share 2024-2029 (%)
- Exhibits66: Chart on Comparison by Type
- Exhibits67: Data Table on Comparison by Type
- Exhibits68: Chart on Direct contact - Market size and forecast 2024-2029 ($ million)
- Exhibits69: Data Table on Direct contact - Market size and forecast 2024-2029 ($ million)
- Exhibits70: Chart on Direct contact - Year-over-year growth 2024-2029 (%)
- Exhibits71: Data Table on Direct contact - Year-over-year growth 2024-2029 (%)
- Exhibits72: Chart on Closed circuit - Market size and forecast 2024-2029 ($ million)
- Exhibits73: Data Table on Closed circuit - Market size and forecast 2024-2029 ($ million)
- Exhibits74: Chart on Closed circuit - Year-over-year growth 2024-2029 (%)
- Exhibits75: Data Table on Closed circuit - Year-over-year growth 2024-2029 (%)
- Exhibits76: Market opportunity by Type ($ million)
- Exhibits77: Data Table on Market opportunity by Type ($ million)
- Exhibits78: Chart on Material - Market share 2024-2029 (%)
- Exhibits79: Data Table on Material - Market share 2024-2029 (%)
- Exhibits80: Chart on Comparison by Material
- Exhibits81: Data Table on Comparison by Material
- Exhibits82: Chart on Steel - Market size and forecast 2024-2029 ($ million)
- Exhibits83: Data Table on Steel - Market size and forecast 2024-2029 ($ million)
- Exhibits84: Chart on Steel - Year-over-year growth 2024-2029 (%)
- Exhibits85: Data Table on Steel - Year-over-year growth 2024-2029 (%)
- Exhibits86: Chart on Concrete - Market size and forecast 2024-2029 ($ million)
- Exhibits87: Data Table on Concrete - Market size and forecast 2024-2029 ($ million)
- Exhibits88: Chart on Concrete - Year-over-year growth 2024-2029 (%)
- Exhibits89: Data Table on Concrete - Year-over-year growth 2024-2029 (%)
- Exhibits90: Chart on FRP - Market size and forecast 2024-2029 ($ million)
- Exhibits91: Data Table on FRP - Market size and forecast 2024-2029 ($ million)
- Exhibits92: Chart on FRP - Year-over-year growth 2024-2029 (%)
- Exhibits93: Data Table on FRP - Year-over-year growth 2024-2029 (%)
- Exhibits94: Market opportunity by Material ($ million)
- Exhibits95: Data Table on Market opportunity by Material ($ million)
- Exhibits96: Analysis of price sensitivity, lifecycle, customer purchase basket, adoption rates, and purchase criteria
- Exhibits97: Chart on Market share By Geographical Landscape 2024-2029 (%)
- Exhibits98: Data Table on Market share By Geographical Landscape 2024-2029 (%)
- Exhibits99: Chart on Geographic comparison
- Exhibits100: Data Table on Geographic comparison
- Exhibits101: Chart on APAC - Market size and forecast 2024-2029 ($ million)
- Exhibits102: Data Table on APAC - Market size and forecast 2024-2029 ($ million)
- Exhibits103: Chart on APAC - Year-over-year growth 2024-2029 (%)
- Exhibits104: Data Table on APAC - Year-over-year growth 2024-2029 (%)
- Exhibits105: Chart on Europe - Market size and forecast 2024-2029 ($ million)
- Exhibits106: Data Table on Europe - Market size and forecast 2024-2029 ($ million)
- Exhibits107: Chart on Europe - Year-over-year growth 2024-2029 (%)
- Exhibits108: Data Table on Europe - Year-over-year growth 2024-2029 (%)
- Exhibits109: Chart on North America - Market size and forecast 2024-2029 ($ million)
- Exhibits110: Data Table on North America - Market size and forecast 2024-2029 ($ million)
- Exhibits111: Chart on North America - Year-over-year growth 2024-2029 (%)
- Exhibits112: Data Table on North America - Year-over-year growth 2024-2029 (%)
- Exhibits113: Chart on Middle East and Africa - Market size and forecast 2024-2029 ($ million)
- Exhibits114: Data Table on Middle East and Africa - Market size and forecast 2024-2029 ($ million)
- Exhibits115: Chart on Middle East and Africa - Year-over-year growth 2024-2029 (%)
- Exhibits116: Data Table on Middle East and Africa - Year-over-year growth 2024-2029 (%)
- Exhibits117: Chart on South America - Market size and forecast 2024-2029 ($ million)
- Exhibits118: Data Table on South America - Market size and forecast 2024-2029 ($ million)
- Exhibits119: Chart on South America - Year-over-year growth 2024-2029 (%)
- Exhibits120: Data Table on South America - Year-over-year growth 2024-2029 (%)
- Exhibits121: Chart on US - Market size and forecast 2024-2029 ($ million)
- Exhibits122: Data Table on US - Market size and forecast 2024-2029 ($ million)
- Exhibits123: Chart on US - Year-over-year growth 2024-2029 (%)
- Exhibits124: Data Table on US - Year-over-year growth 2024-2029 (%)
- Exhibits125: Chart on China - Market size and forecast 2024-2029 ($ million)
- Exhibits126: Data Table on China - Market size and forecast 2024-2029 ($ million)
- Exhibits127: Chart on China - Year-over-year growth 2024-2029 (%)
- Exhibits128: Data Table on China - Year-over-year growth 2024-2029 (%)
- Exhibits129: Chart on Japan - Market size and forecast 2024-2029 ($ million)
- Exhibits130: Data Table on Japan - Market size and forecast 2024-2029 ($ million)
- Exhibits131: Chart on Japan - Year-over-year growth 2024-2029 (%)
- Exhibits132: Data Table on Japan - Year-over-year growth 2024-2029 (%)
- Exhibits133: Chart on India - Market size and forecast 2024-2029 ($ million)
- Exhibits134: Data Table on India - Market size and forecast 2024-2029 ($ million)
- Exhibits135: Chart on India - Year-over-year growth 2024-2029 (%)
- Exhibits136: Data Table on India - Year-over-year growth 2024-2029 (%)
- Exhibits137: Chart on UK - Market size and forecast 2024-2029 ($ million)
- Exhibits138: Data Table on UK - Market size and forecast 2024-2029 ($ million)
- Exhibits139: Chart on UK - Year-over-year growth 2024-2029 (%)
- Exhibits140: Data Table on UK - Year-over-year growth 2024-2029 (%)
- Exhibits141: Chart on Germany - Market size and forecast 2024-2029 ($ million)
- Exhibits142: Data Table on Germany - Market size and forecast 2024-2029 ($ million)
- Exhibits143: Chart on Germany - Year-over-year growth 2024-2029 (%)
- Exhibits144: Data Table on Germany - Year-over-year growth 2024-2029 (%)
- Exhibits145: Chart on South Korea - Market size and forecast 2024-2029 ($ million)
- Exhibits146: Data Table on South Korea - Market size and forecast 2024-2029 ($ million)
- Exhibits147: Chart on South Korea - Year-over-year growth 2024-2029 (%)
- Exhibits148: Data Table on South Korea - Year-over-year growth 2024-2029 (%)
- Exhibits149: Chart on Canada - Market size and forecast 2024-2029 ($ million)
- Exhibits150: Data Table on Canada - Market size and forecast 2024-2029 ($ million)
- Exhibits151: Chart on Canada - Year-over-year growth 2024-2029 (%)
- Exhibits152: Data Table on Canada - Year-over-year growth 2024-2029 (%)
- Exhibits153: Chart on France - Market size and forecast 2024-2029 ($ million)
- Exhibits154: Data Table on France - Market size and forecast 2024-2029 ($ million)
- Exhibits155: Chart on France - Year-over-year growth 2024-2029 (%)
- Exhibits156: Data Table on France - Year-over-year growth 2024-2029 (%)
- Exhibits157: Chart on Italy - Market size and forecast 2024-2029 ($ million)
- Exhibits158: Data Table on Italy - Market size and forecast 2024-2029 ($ million)
- Exhibits159: Chart on Italy - Year-over-year growth 2024-2029 (%)
- Exhibits160: Data Table on Italy - Year-over-year growth 2024-2029 (%)
- Exhibits161: Market opportunity By Geographical Landscape ($ million)
- Exhibits162: Data Tables on Market opportunity By Geographical Landscape ($ million)
- Exhibits163: Impact of drivers and challenges in 2024 and 2029
- Exhibits164: Overview on criticality of inputs and factors of differentiation
- Exhibits165: Overview on factors of disruption
- Exhibits166: Impact of key risks on business
- Exhibits167: Companies covered
- Exhibits168: Company ranking index
- Exhibits169: Matrix on companies position and classification
- Exhibits170: Babcock and Wilcox Enterprises Inc. - Overview
- Exhibits171: Babcock and Wilcox Enterprises Inc. - Business segments
- Exhibits172: Babcock and Wilcox Enterprises Inc. - Key news
- Exhibits173: Babcock and Wilcox Enterprises Inc. - Key offerings
- Exhibits174: Babcock and Wilcox Enterprises Inc. - Segment focus
- Exhibits175: SWOT
- Exhibits176: Baltimore Aircoil Co. - Overview
- Exhibits177: Baltimore Aircoil Co. - Product / Service
- Exhibits178: Baltimore Aircoil Co. - Key offerings
- Exhibits179: SWOT
- Exhibits180: Composite Cooling Solutions LP - Overview
- Exhibits181: Composite Cooling Solutions LP - Product / Service
- Exhibits182: Composite Cooling Solutions LP - Key offerings
- Exhibits183: SWOT
- Exhibits184: Delta Cooling Towers Inc. - Overview
- Exhibits185: Delta Cooling Towers Inc. - Product / Service
- Exhibits186: Delta Cooling Towers Inc. - Key offerings
- Exhibits187: SWOT
- Exhibits188: ENEXIO Management GmbH - Overview
- Exhibits189: ENEXIO Management GmbH - Product / Service
- Exhibits190: ENEXIO Management GmbH - Key offerings
- Exhibits191: SWOT
- Exhibits192: EUROCONFORT GROUP LLC - Overview
- Exhibits193: EUROCONFORT GROUP LLC - Product / Service
- Exhibits194: EUROCONFORT GROUP LLC - Key offerings
- Exhibits195: SWOT
- Exhibits196: EVAPCO Inc. - Overview
- Exhibits197: EVAPCO Inc. - Product / Service
- Exhibits198: EVAPCO Inc. - Key offerings
- Exhibits199: SWOT
- Exhibits200: FANS AS - Overview
- Exhibits201: FANS AS - Product / Service
- Exhibits202: FANS AS - Key offerings
- Exhibits203: SWOT
- Exhibits204: Hamon S.A. - Overview
- Exhibits205: Hamon S.A. - Product / Service
- Exhibits206: Hamon S.A. - Key offerings
- Exhibits207: SWOT
- Exhibits208: Harrison Cooling Towers Pvt. Ltd. - Overview
- Exhibits209: Harrison Cooling Towers Pvt. Ltd. - Product / Service
- Exhibits210: Harrison Cooling Towers Pvt. Ltd. - Key offerings
- Exhibits211: SWOT
- Exhibits212: Konuk Isi - Overview
- Exhibits213: Konuk Isi - Product / Service
- Exhibits214: Konuk Isi - Key offerings
- Exhibits215: SWOT
- Exhibits216: Kuken Kogyo Co. Ltd. - Overview
- Exhibits217: Kuken Kogyo Co. Ltd. - Product / Service
- Exhibits218: Kuken Kogyo Co. Ltd. - Key offerings
- Exhibits219: SWOT
- Exhibits220: MITA Cooling Technologies Srl - Overview
- Exhibits221: MITA Cooling Technologies Srl - Product / Service
- Exhibits222: MITA Cooling Technologies Srl - Key offerings
- Exhibits223: SWOT
- Exhibits224: North Street Cooling Towers Pvt. Ltd. - Overview
- Exhibits225: North Street Cooling Towers Pvt. Ltd. - Product / Service
- Exhibits226: North Street Cooling Towers Pvt. Ltd. - Key offerings
- Exhibits227: SWOT
- Exhibits228: SPX Technologies Inc. - Overview
- Exhibits229: SPX Technologies Inc. - Business segments
- Exhibits230: SPX Technologies Inc. - Key news
- Exhibits231: SPX Technologies Inc. - Key offerings
- Exhibits232: SPX Technologies Inc. - Segment focus
- Exhibits233: SWOT
- Exhibits234: Inclusions checklist
- Exhibits235: Exclusions checklist
- Exhibits236: Currency conversion rates for US$
- Exhibits237: Research methodology
- Exhibits238: Information sources
- Exhibits239: Data validation
- Exhibits240: Validation techniques employed for market sizing
- Exhibits241: Data synthesis
- Exhibits242: 360 degree market analysis
- Exhibits243: List of abbreviations
The hybrid cooling towers market is forecasted to grow by USD 244.6 mn during 2024-2029, accelerating at a CAGR of 4.6% during the forecast period. The report on the hybrid cooling towers market provides a holistic analysis, market size and forecast, trends, growth drivers, and challenges, as well as vendor analysis covering around 25 vendors.
The report offers an up-to-date analysis regarding the current market scenario, the latest trends and drivers, and the overall market environment. The market is driven by increase in construction of data centers, increasing need to reduce environmental impact, and growing number of nuclear power plants.
| Market Scope | |
|---|---|
| Base Year | 2025 |
| End Year | 2029 |
| Series Year | 2025-2029 |
| Growth Momentum | Accelerate |
| YOY 2025 | 4.3% |
| CAGR | 4.6% |
| Incremental Value | $244.6 mn |
The study was conducted using an objective combination of primary and secondary information including inputs from key participants in the industry. The report contains a comprehensive market size data, segment with regional analysis and vendor landscape in addition to an analysis of the key companies. Reports have historic and forecast data.
Technavio's hybrid cooling towers market is segmented as below:
By Application
- Power generation
- HVAC
- Oil and gas
- Chemical and petrochemical
- Others
By Type
- Direct contact
- Closed circuit
By Material
- Steel
- Concrete
- FRP
By Geographical Landscape
- APAC
- Europe
- North America
- Middle East and Africa
- South America
This study identifies the emergence of hybrid closed-circuit cooling towers as one of the prime reasons driving the hybrid cooling towers market growth during the next few years. Also, availability of rental hybrid cooling towers and incorporation of IoT with hybrid cooling towers will lead to sizable demand in the market.
The report on the hybrid cooling towers market covers the following areas:
- Hybrid Cooling Towers Market sizing
- Hybrid Cooling Towers Market forecast
- Hybrid Cooling Towers Market industry analysis
The robust vendor analysis is designed to help clients improve their market position, and in line with this, this report provides a detailed analysis of several leading hybrid cooling towers market vendors that include Babcock and Wilcox Enterprises Inc., Baltimore Aircoil Co., Composite Cooling Solutions LP, Delta Cooling Towers Inc., ENEXIO Management GmbH, EUROCONFORT GROUP LLC, EVAPCO Inc., FANS AS, Hamon S.A., Harrison Cooling Towers Pvt. Ltd., Konuk Isi, Kuken Kogyo Co. Ltd., MITA Cooling Technologies Srl, North Street Cooling Towers Pvt. Ltd., Paharpur Cooling Towers Ltd., Seagull Cooling Tower Co. Ltd, SPX Technologies Inc., and Thermal Care Inc.. Also, the hybrid cooling towers market analysis report includes information on upcoming trends and challenges that will influence market growth. This is to help companies strategize and leverage all forthcoming growth opportunities.
The publisher presents a detailed picture of the market by the way of study, synthesis, and summation of data from multiple sources by an analysis of key parameters such as profit, pricing, competition, and promotions. It presents various market facets by identifying the key industry influencers. The data presented is comprehensive, reliable, and a result of extensive primary and secondary research. The market research reports provide a complete competitive landscape and an in-depth vendor selection methodology and analysis using qualitative and quantitative research to forecast accurate market growth.
Table of Contents
1 Executive Summary
- 1.1 Market overview
- Executive Summary - Chart on Market Overview
- Executive Summary - Data Table on Market Overview
- Executive Summary - Chart on Global Market Characteristics
- Executive Summary - Chart on Market By Geographical Landscape
- Executive Summary - Chart on Market Segmentation by Application
- Executive Summary - Chart on Market Segmentation by Type
- Executive Summary - Chart on Market Segmentation by Material
- Executive Summary - Chart on Incremental Growth
- Executive Summary - Data Table on Incremental Growth
- Executive Summary - Chart on Company Market Positioning
2 Technavio Analysis
- 2.1 Analysis of price sensitivity, lifecycle, customer purchase basket, adoption rates, and purchase criteria
- Analysis of price sensitivity, lifecycle, customer purchase basket, adoption rates, and purchase criteria
- 2.2 Criticality of inputs and Factors of differentiation
- Overview on criticality of inputs and factors of differentiation
- 2.3 Factors of disruption
- Overview on factors of disruption
- 2.4 Impact of drivers and challenges
- Impact of drivers and challenges in 2024 and 2029
3 Market Landscape
- 3.1 Market ecosystem
- Parent Market
- Data Table on - Parent Market
- 3.2 Market characteristics
- Market characteristics analysis
- 3.3 Value chain analysis
- Value chain analysis
4 Market Sizing
- 4.1 Market definition
- Offerings of companies included in the market definition
- 4.2 Market segment analysis
- Market segments
- 4.3 Market size 2024
- 4.4 Market outlook: Forecast for 2024-2029
- Chart on Global - Market size and forecast 2024-2029 ($ million)
- Data Table on Global - Market size and forecast 2024-2029 ($ million)
- Chart on Global Market: Year-over-year growth 2024-2029 (%)
- Data Table on Global Market: Year-over-year growth 2024-2029 (%)
5 Historic Market Size
- 5.1 Global Hybrid Cooling Towers Market 2019 - 2023
- Historic Market Size - Data Table on Global Hybrid Cooling Towers Market 2019 - 2023 ($ million)
- 5.2 Application segment analysis 2019 - 2023
- Historic Market Size - Application Segment 2019 - 2023 ($ million)
- 5.3 Type segment analysis 2019 - 2023
- Historic Market Size - Type Segment 2019 - 2023 ($ million)
- 5.4 Material segment analysis 2019 - 2023
- Historic Market Size - Material Segment 2019 - 2023 ($ million)
- 5.5 Geography segment analysis 2019 - 2023
- Historic Market Size - Geography Segment 2019 - 2023 ($ million)
- 5.6 Country segment analysis 2019 - 2023
- Historic Market Size - Country Segment 2019 - 2023 ($ million)
6 Qualitative Analysis
- 6.1 The AI impact on Global Hybrid Cooling Towers Market
7 Five Forces Analysis
- 7.1 Five forces summary
- Five forces analysis - Comparison between 2024 and 2029
- 7.2 Bargaining power of buyers
- Bargaining power of buyers - Impact of key factors 2024 and 2029
- 7.3 Bargaining power of suppliers
- Bargaining power of suppliers - Impact of key factors in 2024 and 2029
- 7.4 Threat of new entrants
- Threat of new entrants - Impact of key factors in 2024 and 2029
- 7.5 Threat of substitutes
- Threat of substitutes - Impact of key factors in 2024 and 2029
- 7.6 Threat of rivalry
- Threat of rivalry - Impact of key factors in 2024 and 2029
- 7.7 Market condition
- Chart on Market condition - Five forces 2024 and 2029
8 Market Segmentation by Application
- 8.1 Market segments
- Chart on Application - Market share 2024-2029 (%)
- Data Table on Application - Market share 2024-2029 (%)
- 8.2 Comparison by Application
- Chart on Comparison by Application
- Data Table on Comparison by Application
- 8.3 Power generation - Market size and forecast 2024-2029
- Chart on Power generation - Market size and forecast 2024-2029 ($ million)
- Data Table on Power generation - Market size and forecast 2024-2029 ($ million)
- Chart on Power generation - Year-over-year growth 2024-2029 (%)
- Data Table on Power generation - Year-over-year growth 2024-2029 (%)
- 8.4 HVAC - Market size and forecast 2024-2029
- Chart on HVAC - Market size and forecast 2024-2029 ($ million)
- Data Table on HVAC - Market size and forecast 2024-2029 ($ million)
- Chart on HVAC - Year-over-year growth 2024-2029 (%)
- Data Table on HVAC - Year-over-year growth 2024-2029 (%)
- 8.5 Oil and gas - Market size and forecast 2024-2029
- Chart on Oil and gas - Market size and forecast 2024-2029 ($ million)
- Data Table on Oil and gas - Market size and forecast 2024-2029 ($ million)
- Chart on Oil and gas - Year-over-year growth 2024-2029 (%)
- Data Table on Oil and gas - Year-over-year growth 2024-2029 (%)
- 8.6 Chemical and petrochemical - Market size and forecast 2024-2029
- Chart on Chemical and petrochemical - Market size and forecast 2024-2029 ($ million)
- Data Table on Chemical and petrochemical - Market size and forecast 2024-2029 ($ million)
- Chart on Chemical and petrochemical - Year-over-year growth 2024-2029 (%)
- Data Table on Chemical and petrochemical - Year-over-year growth 2024-2029 (%)
- 8.7 Others - Market size and forecast 2024-2029
- Chart on Others - Market size and forecast 2024-2029 ($ million)
- Data Table on Others - Market size and forecast 2024-2029 ($ million)
- Chart on Others - Year-over-year growth 2024-2029 (%)
- Data Table on Others - Year-over-year growth 2024-2029 (%)
- 8.8 Market opportunity by Application
- Market opportunity by Application ($ million)
- Data Table on Market opportunity by Application ($ million)
9 Market Segmentation by Type
- 9.1 Market segments
- Chart on Type - Market share 2024-2029 (%)
- Data Table on Type - Market share 2024-2029 (%)
- 9.2 Comparison by Type
- Chart on Comparison by Type
- Data Table on Comparison by Type
- 9.3 Direct contact - Market size and forecast 2024-2029
- Chart on Direct contact - Market size and forecast 2024-2029 ($ million)
- Data Table on Direct contact - Market size and forecast 2024-2029 ($ million)
- Chart on Direct contact - Year-over-year growth 2024-2029 (%)
- Data Table on Direct contact - Year-over-year growth 2024-2029 (%)
- 9.4 Closed circuit - Market size and forecast 2024-2029
- Chart on Closed circuit - Market size and forecast 2024-2029 ($ million)
- Data Table on Closed circuit - Market size and forecast 2024-2029 ($ million)
- Chart on Closed circuit - Year-over-year growth 2024-2029 (%)
- Data Table on Closed circuit - Year-over-year growth 2024-2029 (%)
- 9.5 Market opportunity by Type
- Market opportunity by Type ($ million)
- Data Table on Market opportunity by Type ($ million)
10 Market Segmentation by Material
- 10.1 Market segments
- Chart on Material - Market share 2024-2029 (%)
- Data Table on Material - Market share 2024-2029 (%)
- 10.2 Comparison by Material
- Chart on Comparison by Material
- Data Table on Comparison by Material
- 10.3 Steel - Market size and forecast 2024-2029
- Chart on Steel - Market size and forecast 2024-2029 ($ million)
- Data Table on Steel - Market size and forecast 2024-2029 ($ million)
- Chart on Steel - Year-over-year growth 2024-2029 (%)
- Data Table on Steel - Year-over-year growth 2024-2029 (%)
- 10.4 Concrete - Market size and forecast 2024-2029
- Chart on Concrete - Market size and forecast 2024-2029 ($ million)
- Data Table on Concrete - Market size and forecast 2024-2029 ($ million)
- Chart on Concrete - Year-over-year growth 2024-2029 (%)
- Data Table on Concrete - Year-over-year growth 2024-2029 (%)
- 10.5 FRP - Market size and forecast 2024-2029
- Chart on FRP - Market size and forecast 2024-2029 ($ million)
- Data Table on FRP - Market size and forecast 2024-2029 ($ million)
- Chart on FRP - Year-over-year growth 2024-2029 (%)
- Data Table on FRP - Year-over-year growth 2024-2029 (%)
- 10.6 Market opportunity by Material
- Market opportunity by Material ($ million)
- Data Table on Market opportunity by Material ($ million)
11 Customer Landscape
- 11.1 Customer landscape overview
- Analysis of price sensitivity, lifecycle, customer purchase basket, adoption rates, and purchase criteria
12 Geographic Landscape
- 12.1 Geographic segmentation
- Chart on Market share By Geographical Landscape 2024-2029 (%)
- Data Table on Market share By Geographical Landscape 2024-2029 (%)
- 12.2 Geographic comparison
- Chart on Geographic comparison
- Data Table on Geographic comparison
- 12.3 APAC - Market size and forecast 2024-2029
- Chart on APAC - Market size and forecast 2024-2029 ($ million)
- Data Table on APAC - Market size and forecast 2024-2029 ($ million)
- Chart on APAC - Year-over-year growth 2024-2029 (%)
- Data Table on APAC - Year-over-year growth 2024-2029 (%)
- 12.4 Europe - Market size and forecast 2024-2029
- Chart on Europe - Market size and forecast 2024-2029 ($ million)
- Data Table on Europe - Market size and forecast 2024-2029 ($ million)
- Chart on Europe - Year-over-year growth 2024-2029 (%)
- Data Table on Europe - Year-over-year growth 2024-2029 (%)
- 12.5 North America - Market size and forecast 2024-2029
- Chart on North America - Market size and forecast 2024-2029 ($ million)
- Data Table on North America - Market size and forecast 2024-2029 ($ million)
- Chart on North America - Year-over-year growth 2024-2029 (%)
- Data Table on North America - Year-over-year growth 2024-2029 (%)
- 12.6 Middle East and Africa - Market size and forecast 2024-2029
- Chart on Middle East and Africa - Market size and forecast 2024-2029 ($ million)
- Data Table on Middle East and Africa - Market size and forecast 2024-2029 ($ million)
- Chart on Middle East and Africa - Year-over-year growth 2024-2029 (%)
- Data Table on Middle East and Africa - Year-over-year growth 2024-2029 (%)
- 12.7 South America - Market size and forecast 2024-2029
- Chart on South America - Market size and forecast 2024-2029 ($ million)
- Data Table on South America - Market size and forecast 2024-2029 ($ million)
- Chart on South America - Year-over-year growth 2024-2029 (%)
- Data Table on South America - Year-over-year growth 2024-2029 (%)
- 12.8 US - Market size and forecast 2024-2029
- Chart on US - Market size and forecast 2024-2029 ($ million)
- Data Table on US - Market size and forecast 2024-2029 ($ million)
- Chart on US - Year-over-year growth 2024-2029 (%)
- Data Table on US - Year-over-year growth 2024-2029 (%)
- 12.9 China - Market size and forecast 2024-2029
- Chart on China - Market size and forecast 2024-2029 ($ million)
- Data Table on China - Market size and forecast 2024-2029 ($ million)
- Chart on China - Year-over-year growth 2024-2029 (%)
- Data Table on China - Year-over-year growth 2024-2029 (%)
- 12.10 Japan - Market size and forecast 2024-2029
- Chart on Japan - Market size and forecast 2024-2029 ($ million)
- Data Table on Japan - Market size and forecast 2024-2029 ($ million)
- Chart on Japan - Year-over-year growth 2024-2029 (%)
- Data Table on Japan - Year-over-year growth 2024-2029 (%)
- 12.11 India - Market size and forecast 2024-2029
- Chart on India - Market size and forecast 2024-2029 ($ million)
- Data Table on India - Market size and forecast 2024-2029 ($ million)
- Chart on India - Year-over-year growth 2024-2029 (%)
- Data Table on India - Year-over-year growth 2024-2029 (%)
- 12.12 UK - Market size and forecast 2024-2029
- Chart on UK - Market size and forecast 2024-2029 ($ million)
- Data Table on UK - Market size and forecast 2024-2029 ($ million)
- Chart on UK - Year-over-year growth 2024-2029 (%)
- Data Table on UK - Year-over-year growth 2024-2029 (%)
- 12.13 Germany - Market size and forecast 2024-2029
- Chart on Germany - Market size and forecast 2024-2029 ($ million)
- Data Table on Germany - Market size and forecast 2024-2029 ($ million)
- Chart on Germany - Year-over-year growth 2024-2029 (%)
- Data Table on Germany - Year-over-year growth 2024-2029 (%)
- 12.14 South Korea - Market size and forecast 2024-2029
- Chart on South Korea - Market size and forecast 2024-2029 ($ million)
- Data Table on South Korea - Market size and forecast 2024-2029 ($ million)
- Chart on South Korea - Year-over-year growth 2024-2029 (%)
- Data Table on South Korea - Year-over-year growth 2024-2029 (%)
- 12.15 Canada - Market size and forecast 2024-2029
- Chart on Canada - Market size and forecast 2024-2029 ($ million)
- Data Table on Canada - Market size and forecast 2024-2029 ($ million)
- Chart on Canada - Year-over-year growth 2024-2029 (%)
- Data Table on Canada - Year-over-year growth 2024-2029 (%)
- 12.16 France - Market size and forecast 2024-2029
- Chart on France - Market size and forecast 2024-2029 ($ million)
- Data Table on France - Market size and forecast 2024-2029 ($ million)
- Chart on France - Year-over-year growth 2024-2029 (%)
- Data Table on France - Year-over-year growth 2024-2029 (%)
- 12.17 Italy - Market size and forecast 2024-2029
- Chart on Italy - Market size and forecast 2024-2029 ($ million)
- Data Table on Italy - Market size and forecast 2024-2029 ($ million)
- Chart on Italy - Year-over-year growth 2024-2029 (%)
- Data Table on Italy - Year-over-year growth 2024-2029 (%)
- 12.18 Market opportunity By Geographical Landscape
- Market opportunity By Geographical Landscape ($ million)
- Data Tables on Market opportunity By Geographical Landscape ($ million)
13 Drivers, Challenges, and Opportunity/Restraints
- 13.1 Market drivers
- 13.2 Market challenges
- 13.3 Impact of drivers and challenges
- Impact of drivers and challenges in 2024 and 2029
- 13.4 Market opportunities/restraints
14 Competitive Landscape
- 14.1 Overview
- 14.2 Competitive Landscape
- Overview on criticality of inputs and factors of differentiation
- 14.3 Landscape disruption
- Overview on factors of disruption
- 14.4 Industry risks
- Impact of key risks on business
15 Competitive Analysis
- 15.1 Companies profiled
- Companies covered
- 15.2 Company ranking index
- Company ranking index
- 15.3 Market positioning of companies
- Matrix on companies position and classification
- 15.4 Babcock and Wilcox Enterprises Inc.
- Babcock and Wilcox Enterprises Inc. - Overview
- Babcock and Wilcox Enterprises Inc. - Business segments
- Babcock and Wilcox Enterprises Inc. - Key news
- Babcock and Wilcox Enterprises Inc. - Key offerings
- Babcock and Wilcox Enterprises Inc. - Segment focus
- SWOT
- 15.5 Baltimore Aircoil Co.
- Baltimore Aircoil Co. - Overview
- Baltimore Aircoil Co. - Product / Service
- Baltimore Aircoil Co. - Key offerings
- SWOT
- 15.6 Composite Cooling Solutions LP
- Composite Cooling Solutions LP - Overview
- Composite Cooling Solutions LP - Product / Service
- Composite Cooling Solutions LP - Key offerings
- SWOT
- 15.7 Delta Cooling Towers Inc.
- Delta Cooling Towers Inc. - Overview
- Delta Cooling Towers Inc. - Product / Service
- Delta Cooling Towers Inc. - Key offerings
- SWOT
- 15.8 ENEXIO Management GmbH
- ENEXIO Management GmbH - Overview
- ENEXIO Management GmbH - Product / Service
- ENEXIO Management GmbH - Key offerings
- SWOT
- 15.9 EUROCONFORT GROUP LLC
- EUROCONFORT GROUP LLC - Overview
- EUROCONFORT GROUP LLC - Product / Service
- EUROCONFORT GROUP LLC - Key offerings
- SWOT
- 15.10 EVAPCO Inc.
- EVAPCO Inc. - Overview
- EVAPCO Inc. - Product / Service
- EVAPCO Inc. - Key offerings
- SWOT
- 15.11 FANS AS
- FANS AS - Overview
- FANS AS - Product / Service
- FANS AS - Key offerings
- SWOT
- 15.12 Hamon S.A.
- Hamon S.A. - Overview
- Hamon S.A. - Product / Service
- Hamon S.A. - Key offerings
- SWOT
- 15.13 Harrison Cooling Towers Pvt. Ltd.
- Harrison Cooling Towers Pvt. Ltd. - Overview
- Harrison Cooling Towers Pvt. Ltd. - Product / Service
- Harrison Cooling Towers Pvt. Ltd. - Key offerings
- SWOT
- 15.14 Konuk Isi
- Konuk Isi - Overview
- Konuk Isi - Product / Service
- Konuk Isi - Key offerings
- SWOT
- 15.15 Kuken Kogyo Co. Ltd.
- Kuken Kogyo Co. Ltd. - Overview
- Kuken Kogyo Co. Ltd. - Product / Service
- Kuken Kogyo Co. Ltd. - Key offerings
- SWOT
- 15.16 MITA Cooling Technologies Srl
- MITA Cooling Technologies Srl - Overview
- MITA Cooling Technologies Srl - Product / Service
- MITA Cooling Technologies Srl - Key offerings
- SWOT
- 15.17 North Street Cooling Towers Pvt. Ltd.
- North Street Cooling Towers Pvt. Ltd. - Overview
- North Street Cooling Towers Pvt. Ltd. - Product / Service
- North Street Cooling Towers Pvt. Ltd. - Key offerings
- SWOT
- 15.18 SPX Technologies Inc.
- SPX Technologies Inc. - Overview
- SPX Technologies Inc. - Business segments
- SPX Technologies Inc. - Key news
- SPX Technologies Inc. - Key offerings
- SPX Technologies Inc. - Segment focus
- SWOT
16 Appendix
- 16.1 Scope of the report
- 16.2 Inclusions and exclusions checklist
- Inclusions checklist
- Exclusions checklist
- 16.3 Currency conversion rates for US$
- Currency conversion rates for US$
- 16.4 Research methodology
- Research methodology
- 16.5 Data procurement
- Information sources
- 16.6 Data validation
- Data validation
- 16.7 Validation techniques employed for market sizing
- Validation techniques employed for market sizing
- 16.8 Data synthesis
- Data synthesis
- 16.9 360 degree market analysis
- 360 degree market analysis
- 16.10 List of abbreviations
- List of abbreviations

