|
|
市場調査レポート
商品コード
1681264
スマート温室の世界市場 2025-2029年Global Smart Greenhouse Market 2025-2029 |
||||||
|
|||||||
カスタマイズ可能
|
|||||||


| スマート温室の世界市場 2025-2029年 |
|
出版日: 2025年02月27日
発行: TechNavio
ページ情報: 英文 221 Pages
納期: 即納可能
|

全表示
- 概要
- 目次
スマート温室市場は2024-2029年に15億5,200万米ドル、予測期間中のCAGRで10%の成長が予測されています。
当レポートでは、スマート温室市場の全体的な分析、市場規模・予測、動向、成長促進要因、課題、約25のベンダーを網羅したベンダー分析などを掲載しています。
現在の市場シナリオ、最新動向と促進要因、市場環境全体に関する最新分析を提供しています。市場は、生鮮食品への要求の高まり、従来の方法よりも高い収量、急速な都市化と耕地の利用可能性の低さによって牽引されています。
| 市場範囲 | |
|---|---|
| 基準年 | 2025 |
| 終了年 | 2029 |
| 予測期間 | 2025-2029 |
| 成長モメンタム | 加速 |
| 前年比2025年 | 9.3% |
| CAGR | 10% |
| 増分額 | 15億5,200万米ドル |
本調査は、業界の主要参加者からのインプットを含め、一次情報と二次情報を客観的に組み合わせて実施しました。レポートには、主要企業の分析に加え、包括的な市場規模データ、地域別分析によるセグメント、ベンダー情勢が含まれています。レポートには過去データと予測データがあります。
本調査では、今後数年間のスマート温室市場の成長を促進する主な要因の一つとして、屋上耕作の新たな動向を挙げています。また、スマート温室に関する認知度の向上と農業研究開発への投資の急増は、市場の大きな需要につながるでしょう。
目次
第1章 エグゼクティブサマリー
- 市場概要
第2章 Technavio分析
- 価格・ライフサイクル・顧客購入バスケット・採用率・購入基準の分析
- インプットの重要性と差別化の要因
- 混乱の要因
- 促進要因と課題の影響
第3章 市場情勢
- 市場エコシステム
- 市場の特徴
- バリューチェーン分析
第4章 市場規模
- 市場の定義
- 市場セグメント分析
- 市場規模 2024
- 市場の見通し 2024-2029
第5章 市場規模実績
- スマート温室の世界市場 2019-2023
- タイプ別セグメント分析 2019-2023
- コンポーネント別セグメント分析 2019-2023
- 作物タイプ別セグメント分析 2019-2023
- 技術別セグメント分析 2019-2023
- 地域別セグメント分析 2019-2023
- 国別セグメント分析 2019-2023
第6章 定性分析
- AIの影響:スマート温室の世界市場
第7章 ファイブフォース分析
- ファイブフォースの要約
- 買い手の交渉力
- 供給企業の交渉力
- 新規参入業者の脅威
- 代替品の脅威
- 競争の脅威
- 市況
第8章 市場セグメンテーション:タイプ別
- 市場セグメント
- 比較:タイプ別
- 水耕栽培:市場規模と予測 2024-2029
- 非水耕栽培:市場規模と予測 2024-2029
- 市場機会:タイプ別
第9章 市場セグメンテーション:コンポーネント別
- 市場セグメント
- 比較:コンポーネント別
- HVACシステム:市場規模と予測 2024-2029
- LEDグローライト:市場規模と予測 2024-2029
- 制御システム・センサー:市場規模と予測 2024-2029
- その他:市場規模と予測 2024-2029
- 市場機会:コンポーネント別
第10章 市場セグメンテーション:作物タイプ別
- 市場セグメント
- 比較:作物タイプ別
- 果物・野菜:市場規模と予測 2024-2029
- 花・観賞植物:市場規模と予測 2024-2029
- ハーブ・葉野菜:市場規模と予測 2024-2029
- その他:市場規模と予測 2024-2029
- 市場機会:作物タイプ別
第11章 市場セグメンテーション:技術別
- 市場セグメント
- 比較:技術別
- IoT対応温室:市場規模と予測 2024-2029
- 自動温室:市場規模と予測 2024-2029
- 市場機会:技術別
第12章 顧客情勢
- 顧客情勢の概要
第13章 地域別情勢
- 地域別セグメンテーション
- 地域別比較
- アジア太平洋:市場規模と予測 2024-2029
- 欧州:市場規模と予測 2024-2029
- 北米:市場規模と予測 2024-2029
- 南米:市場規模と予測 2024-2029
- 中東・アフリカ:市場規模と予測 2024-2029
- 中国:市場規模と予測 2024-2029
- インド:市場規模と予測 2024-2029
- 米国:市場規模と予測 2024-2029
- 日本:市場規模と予測 2024-2029
- ドイツ:市場規模と予測 2024-2029
- カナダ:市場規模と予測 2024-2029
- フランス:市場規模と予測 2024-2029
- 韓国:市場規模と予測 2024-2029
- 英国:市場規模と予測 2024-2029
- イタリア:市場規模と予測 2024-2029
- 市場機会:地域情勢別
第14章 促進要因・課題・機会・抑制要因
- 市場促進要因
- 市場の課題
- 促進要因と課題の影響
- 市場の機会・抑制要因
第15章 競合情勢
- 概要
- 競合情勢
- 混乱の状況
- 業界のリスク
第16章 競合分析
- 企業プロファイル
- 企業ランキング指数
- 企業の市場ポジショニング
- Ag Leader Technology
- AGCO Corp.
- Ceres Greenhouse Solutions
- Certhon Build B.V.
- Controlled Environments Ltd.
- Cultivar Ltd.
- Gibraltar Industries Inc.
- Green Automation Group Oy Ltd.
- Heliospectra AB
- LOGIQS B.V.
- Orbia Advance Corp. S.A.B. de C.V.
- Phonetics Inc.
- Richel Group SAS
- Signify NV
- Sollum Technologies inc.
第17章 付録
The smart greenhouse market is forecasted to grow by USD 1552 million during 2024-2029, accelerating at a CAGR of 10% during the forecast period. The report on the smart greenhouse market provides a holistic analysis, market size and forecast, trends, growth drivers, and challenges, as well as vendor analysis covering around 25 vendors.
The report offers an up-to-date analysis regarding the current market scenario, the latest trends and drivers, and the overall market environment. The market is driven by growing requirement for fresh food, higher yield than traditional methods, and rapid urbanization and low availability of arable land.
| Market Scope | |
|---|---|
| Base Year | 2025 |
| End Year | 2029 |
| Series Year | 2025-2029 |
| Growth Momentum | Accelerate |
| YOY 2025 | 9.3% |
| CAGR | 10% |
| Incremental Value | $1552 mn |
The study was conducted using an objective combination of primary and secondary information including inputs from key participants in the industry. The report contains a comprehensive market size data, segment with regional analysis and vendor landscape in addition to an analysis of the key companies. Reports have historic and forecast data.
Technavio's smart greenhouse market is segmented as below:
By Type
- Hydroponic
- Non-hydroponic
By Component
- HVAC systems
- LED grow lights
- Control systems and sensors
- Others
By Crop Type
- Fruits and vegetables
- Flowers and ornamentals
- Herbs and leafy greens
- Others
By Technology
- IOT-enabled greenhouse
- Automated greenhouse
By Geographical Landscape
- APAC
- Europe
- North America
- South America
- Middle East and Africa
This study identifies the emerging trend of rooftop farming as one of the prime reasons driving the smart greenhouse market growth during the next few years. Also, increasing awareness about smart greenhouse and surge in investments in agricultural research and development will lead to sizable demand in the market.
The report on the smart greenhouse market covers the following areas:
- Smart Greenhouse Market sizing
- Smart Greenhouse Market forecast
- Smart Greenhouse Market industry analysis
The robust vendor analysis is designed to help clients improve their market position, and in line with this, this report provides a detailed analysis of several leading smart greenhouse market vendors that include Ag Leader Technology, AGCO Corp., Agra Tech Inc., Ceres Greenhouse Solutions, Certhon Build B.V., CLAAS KGaA mBH, CNH Industrial NV, Controlled Environments Ltd., Cultivar Ltd., Deere and Co., Gibraltar Industries Inc., Green Automation Group Oy Ltd., Heliospectra AB, LOGIQS B.V., Orbia Advance Corp. S.A.B. de C.V., Phonetics Inc., Richel Group SAS, Signify NV, Sollum Technologies inc., and TSI Inc.. Also, the smart greenhouse market analysis report includes information on upcoming trends and challenges that will influence market growth. This is to help companies strategize and leverage all forthcoming growth opportunities.
The publisher presents a detailed picture of the market by the way of study, synthesis, and summation of data from multiple sources by an analysis of key parameters such as profit, pricing, competition, and promotions. It presents various market facets by identifying the key industry influencers. The data presented is comprehensive, reliable, and a result of extensive primary and secondary research. The market research reports provide a complete competitive landscape and an in-depth vendor selection methodology and analysis using qualitative and quantitative research to forecast accurate market growth.
Table of Contents
1 Executive Summary
- 1.1 Market overview
- Executive Summary - Chart on Market Overview
- Executive Summary - Data Table on Market Overview
- Executive Summary - Chart on Global Market Characteristics
- Executive Summary - Chart on Market By Geographical Landscape
- Executive Summary - Chart on Market Segmentation by Type
- Executive Summary - Chart on Market Segmentation by Component
- Executive Summary - Chart on Market Segmentation by Crop Type
- Executive Summary - Chart on Market Segmentation by Technology
- Executive Summary - Chart on Incremental Growth
- Executive Summary - Data Table on Incremental Growth
- Executive Summary - Chart on Company Market Positioning
2 Technavio Analysis
- 2.1 Analysis of price sensitivity, lifecycle, customer purchase basket, adoption rates, and purchase criteria
- Analysis of price sensitivity, lifecycle, customer purchase basket, adoption rates, and purchase criteria
- 2.2 Criticality of inputs and Factors of differentiation
- Overview on criticality of inputs and factors of differentiation
- 2.3 Factors of disruption
- Overview on factors of disruption
- 2.4 Impact of drivers and challenges
- Impact of drivers and challenges in 2024 and 2029
3 Market Landscape
- 3.1 Market ecosystem
- Parent Market
- Data Table on - Parent Market
- 3.2 Market characteristics
- Market characteristics analysis
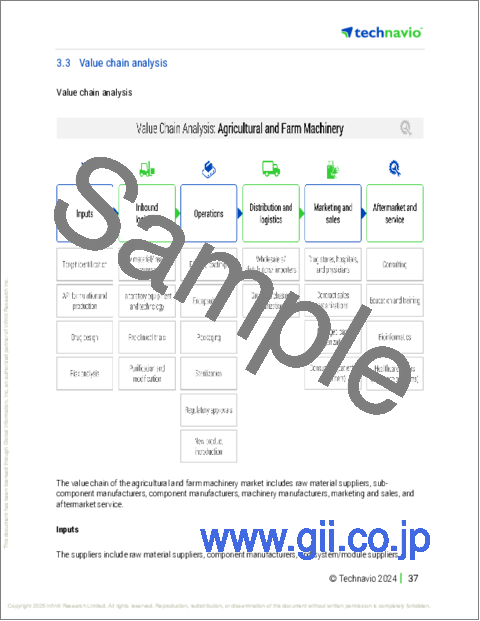
- 3.3 Value chain analysis
- Value chain analysis
4 Market Sizing
- 4.1 Market definition
- Offerings of companies included in the market definition
- 4.2 Market segment analysis
- Market segments
- 4.3 Market size 2024
- 4.4 Market outlook: Forecast for 2024-2029
- Chart on Global - Market size and forecast 2024-2029 ($ million)
- Data Table on Global - Market size and forecast 2024-2029 ($ million)
- Chart on Global Market: Year-over-year growth 2024-2029 (%)
- Data Table on Global Market: Year-over-year growth 2024-2029 (%)
5 Historic Market Size
- 5.1 Global Smart Greenhouse Market 2019 - 2023
- Historic Market Size - Data Table on Global Smart Greenhouse Market 2019 - 2023 ($ million)
- 5.2 Type segment analysis 2019 - 2023
- Historic Market Size - Type Segment 2019 - 2023 ($ million)
- 5.3 Component segment analysis 2019 - 2023
- Historic Market Size - Component Segment 2019 - 2023 ($ million)
- 5.4 Crop Type segment analysis 2019 - 2023
- Historic Market Size - Crop Type Segment 2019 - 2023 ($ million)
- 5.5 Technology segment analysis 2019 - 2023
- Historic Market Size - Technology Segment 2019 - 2023 ($ million)
- 5.6 Geography segment analysis 2019 - 2023
- Historic Market Size - Geography Segment 2019 - 2023 ($ million)
- 5.7 Country segment analysis 2019 - 2023
- Historic Market Size - Country Segment 2019 - 2023 ($ million)
6 Qualitative Analysis
- 6.1 Impact of AI on the Global Smart Greenhouse Market
7 Five Forces Analysis
- 7.1 Five forces summary
- Five forces analysis - Comparison between 2024 and 2029
- 7.2 Bargaining power of buyers
- Bargaining power of buyers - Impact of key factors 2024 and 2029
- 7.3 Bargaining power of suppliers
- Bargaining power of suppliers - Impact of key factors in 2024 and 2029
- 7.4 Threat of new entrants
- Threat of new entrants - Impact of key factors in 2024 and 2029
- 7.5 Threat of substitutes
- Threat of substitutes - Impact of key factors in 2024 and 2029
- 7.6 Threat of rivalry
- Threat of rivalry - Impact of key factors in 2024 and 2029
- 7.7 Market condition
- Chart on Market condition - Five forces 2024 and 2029
8 Market Segmentation by Type
- 8.1 Market segments
- Chart on Type - Market share 2024-2029 (%)
- Data Table on Type - Market share 2024-2029 (%)
- 8.2 Comparison by Type
- Chart on Comparison by Type
- Data Table on Comparison by Type
- 8.3 Hydroponic - Market size and forecast 2024-2029
- Chart on Hydroponic - Market size and forecast 2024-2029 ($ million)
- Data Table on Hydroponic - Market size and forecast 2024-2029 ($ million)
- Chart on Hydroponic - Year-over-year growth 2024-2029 (%)
- Data Table on Hydroponic - Year-over-year growth 2024-2029 (%)
- 8.4 Non-hydroponic - Market size and forecast 2024-2029
- Chart on Non-hydroponic - Market size and forecast 2024-2029 ($ million)
- Data Table on Non-hydroponic - Market size and forecast 2024-2029 ($ million)
- Chart on Non-hydroponic - Year-over-year growth 2024-2029 (%)
- Data Table on Non-hydroponic - Year-over-year growth 2024-2029 (%)
- 8.5 Market opportunity by Type
- Market opportunity by Type ($ million)
- Data Table on Market opportunity by Type ($ million)
9 Market Segmentation by Component
- 9.1 Market segments
- Chart on Component - Market share 2024-2029 (%)
- Data Table on Component - Market share 2024-2029 (%)
- 9.2 Comparison by Component
- Chart on Comparison by Component
- Data Table on Comparison by Component
- 9.3 HVAC systems - Market size and forecast 2024-2029
- Chart on HVAC systems - Market size and forecast 2024-2029 ($ million)
- Data Table on HVAC systems - Market size and forecast 2024-2029 ($ million)
- Chart on HVAC systems - Year-over-year growth 2024-2029 (%)
- Data Table on HVAC systems - Year-over-year growth 2024-2029 (%)
- 9.4 LED grow lights - Market size and forecast 2024-2029
- Chart on LED grow lights - Market size and forecast 2024-2029 ($ million)
- Data Table on LED grow lights - Market size and forecast 2024-2029 ($ million)
- Chart on LED grow lights - Year-over-year growth 2024-2029 (%)
- Data Table on LED grow lights - Year-over-year growth 2024-2029 (%)
- 9.5 Control systems and sensors - Market size and forecast 2024-2029
- Chart on Control systems and sensors - Market size and forecast 2024-2029 ($ million)
- Data Table on Control systems and sensors - Market size and forecast 2024-2029 ($ million)
- Chart on Control systems and sensors - Year-over-year growth 2024-2029 (%)
- Data Table on Control systems and sensors - Year-over-year growth 2024-2029 (%)
- 9.6 Others - Market size and forecast 2024-2029
- Chart on Others - Market size and forecast 2024-2029 ($ million)
- Data Table on Others - Market size and forecast 2024-2029 ($ million)
- Chart on Others - Year-over-year growth 2024-2029 (%)
- Data Table on Others - Year-over-year growth 2024-2029 (%)
- 9.7 Market opportunity by Component
- Market opportunity by Component ($ million)
- Data Table on Market opportunity by Component ($ million)
10 Market Segmentation by Crop Type
- 10.1 Market segments
- Chart on Crop Type - Market share 2024-2029 (%)
- Data Table on Crop Type - Market share 2024-2029 (%)
- 10.2 Comparison by Crop Type
- Chart on Comparison by Crop Type
- Data Table on Comparison by Crop Type
- 10.3 Fruits and vegetables - Market size and forecast 2024-2029
- Chart on Fruits and vegetables - Market size and forecast 2024-2029 ($ million)
- Data Table on Fruits and vegetables - Market size and forecast 2024-2029 ($ million)
- Chart on Fruits and vegetables - Year-over-year growth 2024-2029 (%)
- Data Table on Fruits and vegetables - Year-over-year growth 2024-2029 (%)
- 10.4 Flowers and ornamentals - Market size and forecast 2024-2029
- Chart on Flowers and ornamentals - Market size and forecast 2024-2029 ($ million)
- Data Table on Flowers and ornamentals - Market size and forecast 2024-2029 ($ million)
- Chart on Flowers and ornamentals - Year-over-year growth 2024-2029 (%)
- Data Table on Flowers and ornamentals - Year-over-year growth 2024-2029 (%)
- 10.5 Herbs and leafy greens - Market size and forecast 2024-2029
- Chart on Herbs and leafy greens - Market size and forecast 2024-2029 ($ million)
- Data Table on Herbs and leafy greens - Market size and forecast 2024-2029 ($ million)
- Chart on Herbs and leafy greens - Year-over-year growth 2024-2029 (%)
- Data Table on Herbs and leafy greens - Year-over-year growth 2024-2029 (%)
- 10.6 Others - Market size and forecast 2024-2029
- Chart on Others - Market size and forecast 2024-2029 ($ million)
- Data Table on Others - Market size and forecast 2024-2029 ($ million)
- Chart on Others - Year-over-year growth 2024-2029 (%)
- Data Table on Others - Year-over-year growth 2024-2029 (%)
- 10.7 Market opportunity by Crop Type
- Market opportunity by Crop Type ($ million)
- Data Table on Market opportunity by Crop Type ($ million)
11 Market Segmentation by Technology
- 11.1 Market segments
- Chart on Technology - Market share 2024-2029 (%)
- Data Table on Technology - Market share 2024-2029 (%)
- 11.2 Comparison by Technology
- Chart on Comparison by Technology
- Data Table on Comparison by Technology
- 11.3 IoT-enabled greenhouse - Market size and forecast 2024-2029
- Chart on IoT-enabled greenhouse - Market size and forecast 2024-2029 ($ million)
- Data Table on IoT-enabled greenhouse - Market size and forecast 2024-2029 ($ million)
- Chart on IoT-enabled greenhouse - Year-over-year growth 2024-2029 (%)
- Data Table on IoT-enabled greenhouse - Year-over-year growth 2024-2029 (%)
- 11.4 Automated greenhouse - Market size and forecast 2024-2029
- Chart on Automated greenhouse - Market size and forecast 2024-2029 ($ million)
- Data Table on Automated greenhouse - Market size and forecast 2024-2029 ($ million)
- Chart on Automated greenhouse - Year-over-year growth 2024-2029 (%)
- Data Table on Automated greenhouse - Year-over-year growth 2024-2029 (%)
- 11.5 Market opportunity by Technology
- Market opportunity by Technology ($ million)
- Data Table on Market opportunity by Technology ($ million)
12 Customer Landscape
- 12.1 Customer landscape overview
- Analysis of price sensitivity, lifecycle, customer purchase basket, adoption rates, and purchase criteria
13 Geographic Landscape
- 13.1 Geographic segmentation
- Chart on Market share By Geographical Landscape 2024-2029 (%)
- Data Table on Market share By Geographical Landscape 2024-2029 (%)
- 13.2 Geographic comparison
- Chart on Geographic comparison
- Data Table on Geographic comparison
- 13.3 APAC - Market size and forecast 2024-2029
- Chart on APAC - Market size and forecast 2024-2029 ($ million)
- Data Table on APAC - Market size and forecast 2024-2029 ($ million)
- Chart on APAC - Year-over-year growth 2024-2029 (%)
- Data Table on APAC - Year-over-year growth 2024-2029 (%)
- 13.4 Europe - Market size and forecast 2024-2029
- Chart on Europe - Market size and forecast 2024-2029 ($ million)
- Data Table on Europe - Market size and forecast 2024-2029 ($ million)
- Chart on Europe - Year-over-year growth 2024-2029 (%)
- Data Table on Europe - Year-over-year growth 2024-2029 (%)
- 13.5 North America - Market size and forecast 2024-2029
- Chart on North America - Market size and forecast 2024-2029 ($ million)
- Data Table on North America - Market size and forecast 2024-2029 ($ million)
- Chart on North America - Year-over-year growth 2024-2029 (%)
- Data Table on North America - Year-over-year growth 2024-2029 (%)
- 13.6 South America - Market size and forecast 2024-2029
- Chart on South America - Market size and forecast 2024-2029 ($ million)
- Data Table on South America - Market size and forecast 2024-2029 ($ million)
- Chart on South America - Year-over-year growth 2024-2029 (%)
- Data Table on South America - Year-over-year growth 2024-2029 (%)
- 13.7 Middle East and Africa - Market size and forecast 2024-2029
- Chart on Middle East and Africa - Market size and forecast 2024-2029 ($ million)
- Data Table on Middle East and Africa - Market size and forecast 2024-2029 ($ million)
- Chart on Middle East and Africa - Year-over-year growth 2024-2029 (%)
- Data Table on Middle East and Africa - Year-over-year growth 2024-2029 (%)
- 13.8 China - Market size and forecast 2024-2029
- Chart on China - Market size and forecast 2024-2029 ($ million)
- Data Table on China - Market size and forecast 2024-2029 ($ million)
- Chart on China - Year-over-year growth 2024-2029 (%)
- Data Table on China - Year-over-year growth 2024-2029 (%)
- 13.9 India - Market size and forecast 2024-2029
- Chart on India - Market size and forecast 2024-2029 ($ million)
- Data Table on India - Market size and forecast 2024-2029 ($ million)
- Chart on India - Year-over-year growth 2024-2029 (%)
- Data Table on India - Year-over-year growth 2024-2029 (%)
- 13.10 US - Market size and forecast 2024-2029
- Chart on US - Market size and forecast 2024-2029 ($ million)
- Data Table on US - Market size and forecast 2024-2029 ($ million)
- Chart on US - Year-over-year growth 2024-2029 (%)
- Data Table on US - Year-over-year growth 2024-2029 (%)
- 13.11 Japan - Market size and forecast 2024-2029
- Chart on Japan - Market size and forecast 2024-2029 ($ million)
- Data Table on Japan - Market size and forecast 2024-2029 ($ million)
- Chart on Japan - Year-over-year growth 2024-2029 (%)
- Data Table on Japan - Year-over-year growth 2024-2029 (%)
- 13.12 Germany - Market size and forecast 2024-2029
- Chart on Germany - Market size and forecast 2024-2029 ($ million)
- Data Table on Germany - Market size and forecast 2024-2029 ($ million)
- Chart on Germany - Year-over-year growth 2024-2029 (%)
- Data Table on Germany - Year-over-year growth 2024-2029 (%)
- 13.13 Canada - Market size and forecast 2024-2029
- Chart on Canada - Market size and forecast 2024-2029 ($ million)
- Data Table on Canada - Market size and forecast 2024-2029 ($ million)
- Chart on Canada - Year-over-year growth 2024-2029 (%)
- Data Table on Canada - Year-over-year growth 2024-2029 (%)
- 13.14 France - Market size and forecast 2024-2029
- Chart on France - Market size and forecast 2024-2029 ($ million)
- Data Table on France - Market size and forecast 2024-2029 ($ million)
- Chart on France - Year-over-year growth 2024-2029 (%)
- Data Table on France - Year-over-year growth 2024-2029 (%)
- 13.15 South Korea - Market size and forecast 2024-2029
- Chart on South Korea - Market size and forecast 2024-2029 ($ million)
- Data Table on South Korea - Market size and forecast 2024-2029 ($ million)
- Chart on South Korea - Year-over-year growth 2024-2029 (%)
- Data Table on South Korea - Year-over-year growth 2024-2029 (%)
- 13.16 UK - Market size and forecast 2024-2029
- Chart on UK - Market size and forecast 2024-2029 ($ million)
- Data Table on UK - Market size and forecast 2024-2029 ($ million)
- Chart on UK - Year-over-year growth 2024-2029 (%)
- Data Table on UK - Year-over-year growth 2024-2029 (%)
- 13.17 Italy - Market size and forecast 2024-2029
- Chart on Italy - Market size and forecast 2024-2029 ($ million)
- Data Table on Italy - Market size and forecast 2024-2029 ($ million)
- Chart on Italy - Year-over-year growth 2024-2029 (%)
- Data Table on Italy - Year-over-year growth 2024-2029 (%)
- 13.18 Market opportunity By Geographical Landscape
- Market opportunity By Geographical Landscape ($ million)
- Data Tables on Market opportunity By Geographical Landscape ($ million)
14 Drivers, Challenges, and Opportunity/Restraints
- 14.1 Market drivers
- 14.2 Market challenges
- 14.3 Impact of drivers and challenges
- Impact of drivers and challenges in 2024 and 2029
- 14.4 Market opportunities/restraints
15 Competitive Landscape
- 15.1 Overview
- 15.2 Competitive Landscape
- Overview on criticality of inputs and factors of differentiation
- 15.3 Landscape disruption
- Overview on factors of disruption
- 15.4 Industry risks
- Impact of key risks on business
16 Competitive Analysis
- 16.1 Companies profiled
- Companies covered
- 16.2 Company ranking index
- Company ranking index
- 16.3 Market positioning of companies
- Matrix on companies position and classification
- 16.4 Ag Leader Technology
- Ag Leader Technology - Overview
- Ag Leader Technology - Product / Service
- Ag Leader Technology - Key offerings
- SWOT
- 16.5 AGCO Corp.
- AGCO Corp. - Overview
- AGCO Corp. - Business segments
- AGCO Corp. - Key news
- AGCO Corp. - Key offerings
- AGCO Corp. - Segment focus
- SWOT
- 16.6 Ceres Greenhouse Solutions
- Ceres Greenhouse Solutions - Overview
- Ceres Greenhouse Solutions - Product / Service
- Ceres Greenhouse Solutions - Key offerings
- SWOT
- 16.7 Certhon Build B.V.
- Certhon Build B.V. - Overview
- Certhon Build B.V. - Product / Service
- Certhon Build B.V. - Key offerings
- SWOT
- 16.8 Controlled Environments Ltd.
- Controlled Environments Ltd. - Overview
- Controlled Environments Ltd. - Product / Service
- Controlled Environments Ltd. - Key offerings
- SWOT
- 16.9 Cultivar Ltd.
- Cultivar Ltd. - Overview
- Cultivar Ltd. - Product / Service
- Cultivar Ltd. - Key offerings
- SWOT
- 16.10 Gibraltar Industries Inc.
- Gibraltar Industries Inc. - Overview
- Gibraltar Industries Inc. - Business segments
- Gibraltar Industries Inc. - Key offerings
- Gibraltar Industries Inc. - Segment focus
- SWOT
- 16.11 Green Automation Group Oy Ltd.
- Green Automation Group Oy Ltd. - Overview
- Green Automation Group Oy Ltd. - Product / Service
- Green Automation Group Oy Ltd. - Key offerings
- SWOT
- 16.12 Heliospectra AB
- Heliospectra AB - Overview
- Heliospectra AB - Product / Service
- Heliospectra AB - Key offerings
- SWOT
- 16.13 LOGIQS B.V.
- LOGIQS B.V. - Overview
- LOGIQS B.V. - Product / Service
- LOGIQS B.V. - Key offerings
- SWOT
- 16.14 Orbia Advance Corp. S.A.B. de C.V.
- Orbia Advance Corp. S.A.B. de C.V. - Overview
- Orbia Advance Corp. S.A.B. de C.V. - Business segments
- Orbia Advance Corp. S.A.B. de C.V. - Key offerings
- Orbia Advance Corp. S.A.B. de C.V. - Segment focus
- SWOT
- 16.15 Phonetics Inc.
- Phonetics Inc. - Overview
- Phonetics Inc. - Product / Service
- Phonetics Inc. - Key offerings
- SWOT
- 16.16 Richel Group SAS
- Richel Group SAS - Overview
- Richel Group SAS - Product / Service
- Richel Group SAS - Key offerings
- SWOT
- 16.17 Signify NV
- Signify NV - Overview
- Signify NV - Business segments
- Signify NV - Key news
- Signify NV - Key offerings
- Signify NV - Segment focus
- SWOT
- 16.18 Sollum Technologies inc.
- Sollum Technologies inc. - Overview
- Sollum Technologies inc. - Product / Service
- Sollum Technologies inc. - Key offerings
- SWOT
17 Appendix
- 17.1 Scope of the report
- 17.2 Inclusions and exclusions checklist
- Inclusions checklist
- Exclusions checklist
- 17.3 Currency conversion rates for US$
- Currency conversion rates for US$
- 17.4 Research methodology
- Research methodology
- 17.5 Data procurement
- Information sources
- 17.6 Data validation
- Data validation
- 17.7 Validation techniques employed for market sizing
- Validation techniques employed for market sizing
- 17.8 Data synthesis
- Data synthesis
- 17.9 360 degree market analysis
- 360 degree market analysis
- 17.10 List of abbreviations
- List of abbreviations

