|
|
市場調査レポート
商品コード
1911033
世界の反射材市場2026-2030年Global Reflective Materials Market 2026-2030 |
||||||
|
|||||||
カスタマイズ可能
|
|||||||

| 世界の反射材市場2026-2030年 |
|
出版日: 2026年01月14日
発行: TechNavio
ページ情報: 英文 309 Pages
納期: 即納可能
|

概要
世界の反射材市場は、2025年から2030年の間に93億7,900万米ドルの成長が見込まれ、予測期間中のCAGRは5.8%と予測されています。
本報告書では、世界の反射材市場に関する包括的な分析、市場規模と予測、動向、成長要因、課題に加え、約25社のベンダー分析を提供しております。
本レポートは、現在の市場状況、最新の市場動向と促進要因、市場環境全般に関する最新の分析を提供します。市場の成長は、安全用途への注目の高まり、主要なマーケットカタリストとしての厳格な政府安全規制、需要を促進する建設・自動車産業の拡大によって牽引されています。
本調査は、業界の主要関係者からの情報をはじめとする一次情報と二次情報を客観的に組み合わせて実施されました。本レポートには、主要企業の分析に加え、包括的な市場規模データ、地域別分析を伴うセグメント、ベンダー情勢が含まれています。レポートには過去データと予測データが掲載されています。
| 市場範囲 | |
|---|---|
| 基準年 | 2026年 |
| 終了年 | 2030年 |
| 予測期間 | 2026-2030 |
| 成長モメンタム | 加速 |
| 前年比2026年 | 5.3% |
| CAGR | 5.8% |
| 増分額 | 93億7,900万米ドル |
本調査では、今後数年間における世界の反射材市場の成長を牽引する主な要因の一つとして、より厳格化する世界の安全規制や基準による需要の増加を挙げております。また、建設・インフラ分野の拡大および反射材の技術的進歩が、市場における相当な需要を生み出すものと見込まれます。
目次
第1章 エグゼクティブサマリー
- 市場概要
第2章 Technavio分析
- 価格・ライフサイクル・顧客購入バスケット・採用率・購入基準の分析
- インプットの重要性と差別化の要因
- 混乱の要因
- 促進要因と課題の影響
第3章 市場情勢
- 市場エコシステム
- 市場の特徴
- バリューチェーン分析
第4章 市場規模
- 市場の定義
- 市場セグメント分析
- 市場規模 2025
- 市場の見通し 2025-2030
第5章 市場規模実績
- 世界の反射材市場 2020-2024
- 製品セグメント分析 2020-2024
- エンドユーザーセグメント分析 2020-2024
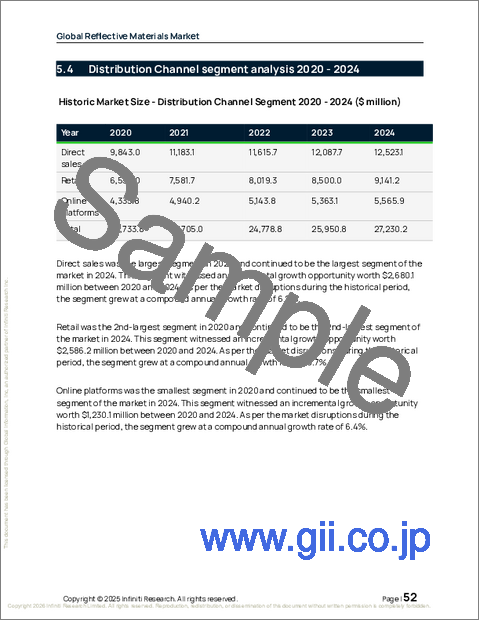
- 流通チャネルセグメント分析 2020-2024
- 地域別セグメント分析 2020-2024
- 国別セグメント分析 2020-2024
第6章 定性分析
- AIの影響:世界の反射材市場
第7章 ファイブフォース分析
- ファイブフォースの要約
- 買い手の交渉力
- 供給企業の交渉力
- 新規参入業者の脅威
- 代替品の脅威
- 競争の脅威
- 市況
第8章 市場セグメンテーション:製品別
- 市場セグメント
- 比較:製品別
- コーティング:市場規模と予測 2025-2030
- ファブリック:市場規模と予測 2025-2030
- シート:市場規模と予測 2025-2030
- 塗料・インク:市場規模と予測 2025-2030
- その他:市場規模と予測 2025-2030
- 市場機会:製品別
第9章 市場セグメンテーション:エンドユーザー別
- 市場セグメント
- 比較:エンドユーザー別
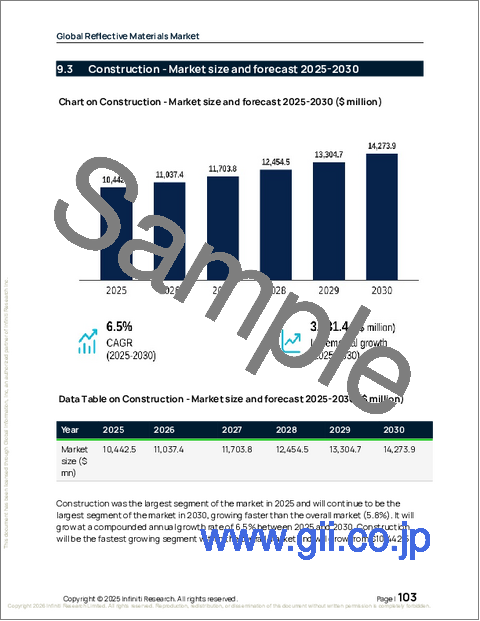
- 建設:市場規模と予測 2025-2030
- 自動車:市場規模と予測 2025-2030
- 繊維産業:市場規模と予測 2025-2030
- 電子機器:市場規模と予測 2025-2030
- 市場機会:エンドユーザー別
第10章 市場セグメンテーション:流通チャネル別
- 市場セグメント
- 比較:流通チャネル別
- 直接販売:市場規模と予測 2025-2030
- 小売り:市場規模と予測 2025-2030
- オンラインプラットフォーム:市場規模と予測 2025-2030
- 市場機会:流通チャネル別
第11章 顧客情勢
- 顧客情勢の概要
第12章 地域別情勢
- 地域別セグメンテーション
- 地域別比較
- アジア太平洋:市場規模と予測 2025-2030
- 北米:市場規模と予測 2025-2030
- 欧州:市場規模と予測 2025-2030
- 中東・アフリカ:市場規模と予測 2025-2030
- 南米:市場規模と予測 2025-2030
- 市場機会:地域別
第13章 促進要因、課題、および機会
- 市場促進要因
- 市場の課題
- 促進要因と課題の影響
- 市場機会
第14章 競合情勢
- 概要
- 競合情勢
- 混乱の状況
- 業界のリスク
第15章 競合分析
- 企業プロファイル
- 企業ランキング指標
- 企業の市場ポジショニング
- 3M Co.
- Avery Dennison Corp.
- Coats Group PLC
- Daoming Optics and Chemical Co. Ltd.
- Jinsung Co. Ltd.
- Nippon Carbide Industries Co. Ltd.
- ORAFOL Europe GmbH
- Paiho Shih Holdings Corp.
- PPG Industries Inc.
- REFLOMAX Co. Ltd.
- SKC
- S.V.G.I. OPT S.r.l.
- Unitika Ltd.
- Viz Reflectives
- Yeshili Reflective Material Co. Ltd.

