|
|
市場調査レポート
商品コード
1660820
日本の保険市場 2025~2029年Insurance Market in Japan 2025-2029 |
||||||

|
|||||||
カスタマイズ可能
|
|||||||

| 日本の保険市場 2025~2029年 |
|
出版日: 2025年02月15日
発行: TechNavio
ページ情報: 英文 159 Pages
納期: 即納可能
|

全表示
- 概要
- 目次
日本の保険市場は2024-2029年に467億米ドル、予測期間中のCAGRは3%で成長すると予測されます。
当レポートでは、日本の保険市場について、市場規模・予測、動向、成長促進要因、課題、約25のベンダーを網羅した総合的な分析を掲載しています。
現在の市場シナリオ、最新動向と促進要因、市場環境全般に関する最新分析を提供しています。市場は、日本における高齢者人口の増加、自然災害への恐怖、短期保険への注目度の高さによって牽引されています。
本調査は、業界の主要参加者からのインプットを含め、一次情報と二次情報を客観的に組み合わせて実施しました。本レポートには、主要企業の分析に加え、包括的な市場規模データ、地域別分析によるセグメント、ベンダー情勢が含まれています。レポートには過去データと予測データを掲載しています。
| 市場範囲 | |
|---|---|
| 基準年 | 2025 |
| 終了年 | 2029 |
| 予測期間 | 2025-2029 |
| 成長モメンタム | 加速 |
| 前年比2025年 | 2.8% |
| CAGR | 3% |
| 増分額 | 467億米ドル |
本調査では、ITと分析ソリューションの統合が、今後数年間における日本の保険市場の成長を牽引する主要因のひとつであると分析しています。また、保険加入のためのデジタル・プラットフォームの利用や自動車保険への需要の高まりも、市場の大きな需要につながります。
目次
第1章 エグゼクティブサマリー
- 市場概要
第2章 Technavio別分析
- 価格・ライフサイクル・顧客購入バスケット・採用率・購入基準の分析
- インプットの重要性と差別化の要因
- 混乱の要因
- 促進要因と課題の影響
第3章 市場情勢
- 市場エコシステム
- 市場の特徴
- バリューチェーン分析
第4章 市場規模
- 市場の定義
- 市場セグメント分析
- 市場規模 2024
- 市場の見通し 2024-2029
第5章 市場規模実績
- 日本の保険市場 2019-2023
- タイプ別セグメント分析 2019-2023
- チャネル別セグメント分析 2019-2023
- セクター別セグメント分析 2019-2023
第6章 定性分析
- AIの影響:日本の保険市場
第7章 ファイブフォース分析
- ファイブフォースの要約
- 買い手の交渉力
- 供給企業の交渉力
- 新規参入業者の脅威
- 代替品の脅威
- 競争の脅威
- 市況
第8章 市場セグメンテーション:タイプ別
- 市場セグメント
- 比較:タイプ別
- 生命保険:市場規模と予測 2024-2029
- 損害保険:市場規模と予測 2024-2029
- 市場機会:タイプ別
第9章 市場セグメンテーション:チャネル別
- 市場セグメント
- 比較:チャネル別
- 営業担当者:市場規模と予測 2024-2029
- 保険代理店:市場規模と予測 2024-2029
- 市場機会:チャネル別
第10章 市場セグメンテーション:セクター別
- 市場セグメント
- 比較:セクター別
- 公的保険会社:市場規模と予測 2024-2029
- 民間保険会社:市場規模と予測 2024-2029
- 市場機会:セクター別
第11章 顧客情勢
- 顧客情勢の概要
第12章 促進要因・課題・機会・抑制要因
- 市場促進要因
- 市場の課題
- 促進要因と課題の影響
- 市場の機会・抑制要因
第13章 競合情勢
- 概要
- 競合情勢
- 混乱の状況
- 業界のリスク
第14章 競合分析
- 企業プロファイル
- 企業ランキング指数
- 企業の市場ポジショニング
- AFLAC Inc.
- Allianz SE
- Asahi Mutual Life Insurance Co.
- Dai ichi Life Holdings Inc.
- JAPAN POST INSURANCE Co., Ltd.
- Lifenet Insurance Co. Ltd.
- Manulife Financial Corp.
- Meiji Yasuda Life Insurance Co.
- Metlife Inc.
- MS and AD Insurance Group Holdings Inc.
- Nippon Life Insurance Co.
- Rakuten Group Inc.
- Sompo Holdings Inc.
- Sony Financial Group Inc.
- Zurich Insurance Co. Ltd.
第15章 付録
The insurance market in Japan is forecasted to grow by USD 46.7 billion during 2024-2029, accelerating at a CAGR of 3% during the forecast period. The report on the insurance market in Japan provides a holistic analysis, market size and forecast, trends, growth drivers, and challenges, as well as vendor analysis covering around 25 vendors.
The report offers an up-to-date analysis regarding the current market scenario, the latest trends and drivers, and the overall market environment. The market is driven by the growing geriatric population in Japan, fear of natural disasters, and high focus of short-term insurance.
The study was conducted using an objective combination of primary and secondary information including inputs from key participants in the industry. The report contains a comprehensive market size data, segment with regional analysis and vendor landscape in addition to an analysis of the key companies. Reports have historic and forecast data.
| Market Scope | |
|---|---|
| Base Year | 2025 |
| End Year | 2029 |
| Series Year | 2025-2029 |
| Growth Momentum | Accelerate |
| YOY 2025 | 2.8% |
| CAGR | 3% |
| Incremental Value | $46.7 bn |
Technavio's insurance market in Japan is segmented as below:
By Type
- Life
- Non-life
By Channel
- Sales personnel
- Insurance agencies
By Sector
- Public/government insurance companies
- Private insurance companies
By Geographical Landscape
- APAC
This study identifies the integration of it and analytic solutions as one of the prime reasons driving the insurance market in Japan growth during the next few years. Also, use of digital platforms to purchase insurance and increasing demand for automotive insurance will lead to sizable demand in the market.
The report on the insurance market in Japan covers the following areas:
- Insurance Market in Japan sizing
- Insurance Market in Japan forecast
- Insurance Market in Japan industry analysis
The robust vendor analysis is designed to help clients improve their market position, and in line with this, this report provides a detailed analysis of several leading insurance market in Japan vendors that include AFLAC Inc., Allianz SE, Asahi Mutual Life Insurance Co., Dai ichi Life Holdings Inc., Japan POST INSURANCE Co., Ltd., Lifenet Insurance Co. Ltd., Manulife Financial Corp., Medicare Life Insurance Co., Ltd., Meiji Yasuda Life Insurance Co., Metlife Inc., MS and AD Insurance Group Holdings Inc., Nippon Life Insurance Co., Orix Corp., Pruco Life Insurance Company, Rakuten Group Inc., SBI Insurance Group Co., Ltd., Sompo Holdings Inc., Sony Financial Group Inc., Tokio Marine Holdings Inc., and Zurich Insurance Co. Ltd.. Also, the insurance market in Japan analysis report includes information on upcoming trends and challenges that will influence market growth. This is to help companies strategize and leverage all forthcoming growth opportunities.
The publisher presents a detailed picture of the market by the way of study, synthesis, and summation of data from multiple sources by an analysis of key parameters such as profit, pricing, competition, and promotions. It presents various market facets by identifying the key industry influencers. The data presented is comprehensive, reliable, and a result of extensive primary and secondary research. The market research reports provide a complete competitive landscape and an in-depth vendor selection methodology and analysis using qualitative and quantitative research to forecast accurate market growth.
Table of Contents
1 Executive Summary
- 1.1 Market overview
- Executive Summary - Chart on Market Overview
- Executive Summary - Data Table on Market Overview
- Executive Summary - Chart on Country Market Characteristics
- Executive Summary - Chart on Market Segmentation by Type
- Executive Summary - Chart on Market Segmentation by Channel
- Executive Summary - Chart on Market Segmentation by Sector
- Executive Summary - Chart on Company Market Positioning
2 Technavio Analysis
- 2.1 Analysis of price sensitivity, lifecycle, customer purchase basket, adoption rates, and purchase criteria
- Analysis of price sensitivity, lifecycle, customer purchase basket, adoption rates, and purchase criteria
- 2.2 Criticality of inputs and Factors of differentiation
- Overview on criticality of inputs and factors of differentiation
- 2.3 Factors of disruption
- Overview on factors of disruption
- 2.4 Impact of drivers and challenges
- Impact of drivers and challenges in 2024 and 2029
3 Market Landscape
- 3.1 Market ecosystem
- Parent Market
- Data Table on - Parent Market
- 3.2 Market characteristics
- Market characteristics analysis
- 3.3 Value chain analysis
- Value chain analysis
4 Market Sizing
- 4.1 Market definition
- Offerings of companies included in the market definition
- 4.2 Market segment analysis
- Market segments
- 4.3 Market size 2024
- 4.4 Market outlook: Forecast for 2024-2029
- Chart on Japan - Market size and forecast 2024-2029 ($ billion)
- Data Table on Japan - Market size and forecast 2024-2029 ($ billion)
- Chart on Japan: Year-over-year growth 2024-2029 (%)
- Data Table on Japan: Year-over-year growth 2024-2029 (%)
5 Historic Market Size
- 5.1 Insurance Market in Japan 2019 - 2023
- Historic Market Size - Data Table on Insurance Market in Japan 2019 - 2023 ($ billion)
- 5.2 Type segment analysis 2019 - 2023
- Historic Market Size - Type Segment 2019 - 2023 ($ billion)
- 5.3 Channel segment analysis 2019 - 2023
- Historic Market Size - Channel Segment 2019 - 2023 ($ billion)
- 5.4 Sector segment analysis 2019 - 2023
- Historic Market Size - Sector Segment 2019 - 2023 ($ billion)
6 Qualitative Analysis
- 6.1 Impact of AI on insurance market in Japan
7 Five Forces Analysis
- 7.1 Five forces summary
- Five forces analysis - Comparison between 2024 and 2029
- 7.2 Bargaining power of buyers
- Bargaining power of buyers - Impact of key factors 2024 and 2029
- 7.3 Bargaining power of suppliers
- Bargaining power of suppliers - Impact of key factors in 2024 and 2029
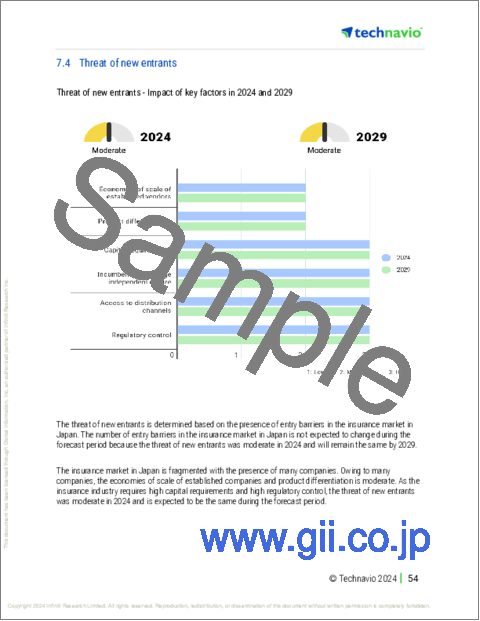
- 7.4 Threat of new entrants
- Threat of new entrants - Impact of key factors in 2024 and 2029
- 7.5 Threat of substitutes
- Threat of substitutes - Impact of key factors in 2024 and 2029
- 7.6 Threat of rivalry
- Threat of rivalry - Impact of key factors in 2024 and 2029
- 7.7 Market condition
- Chart on Market condition - Five forces 2024 and 2029
8 Market Segmentation by Type
- 8.1 Market segments
- Chart on Type - Market share 2024-2029 (%)
- Data Table on Type - Market share 2024-2029 (%)
- 8.2 Comparison by Type
- Chart on Comparison by Type
- Data Table on Comparison by Type
- 8.3 Life - Market size and forecast 2024-2029
- Chart on Life - Market size and forecast 2024-2029 ($ billion)
- Data Table on Life - Market size and forecast 2024-2029 ($ billion)
- Chart on Life - Year-over-year growth 2024-2029 (%)
- Data Table on Life - Year-over-year growth 2024-2029 (%)
- 8.4 Non-life - Market size and forecast 2024-2029
- Chart on Non-life - Market size and forecast 2024-2029 ($ billion)
- Data Table on Non-life - Market size and forecast 2024-2029 ($ billion)
- Chart on Non-life - Year-over-year growth 2024-2029 (%)
- Data Table on Non-life - Year-over-year growth 2024-2029 (%)
- 8.5 Market opportunity by Type
- Market opportunity by Type ($ billion)
- Data Table on Market opportunity by Type ($ billion)
9 Market Segmentation by Channel
- 9.1 Market segments
- Chart on Channel - Market share 2024-2029 (%)
- Data Table on Channel - Market share 2024-2029 (%)
- 9.2 Comparison by Channel
- Chart on Comparison by Channel
- Data Table on Comparison by Channel
- 9.3 Sales personnel - Market size and forecast 2024-2029
- Chart on Sales personnel - Market size and forecast 2024-2029 ($ billion)
- Data Table on Sales personnel - Market size and forecast 2024-2029 ($ billion)
- Chart on Sales personnel - Year-over-year growth 2024-2029 (%)
- Data Table on Sales personnel - Year-over-year growth 2024-2029 (%)
- 9.4 Insurance agencies - Market size and forecast 2024-2029
- Chart on Insurance agencies - Market size and forecast 2024-2029 ($ billion)
- Data Table on Insurance agencies - Market size and forecast 2024-2029 ($ billion)
- Chart on Insurance agencies - Year-over-year growth 2024-2029 (%)
- Data Table on Insurance agencies - Year-over-year growth 2024-2029 (%)
- 9.5 Market opportunity by Channel
- Market opportunity by Channel ($ billion)
- Data Table on Market opportunity by Channel ($ billion)
10 Market Segmentation by Sector
- 10.1 Market segments
- Chart on Sector - Market share 2024-2029 (%)
- Data Table on Sector - Market share 2024-2029 (%)
- 10.2 Comparison by Sector
- Chart on Comparison by Sector
- Data Table on Comparison by Sector
- 10.3 Public/government insurance companies - Market size and forecast 2024-2029
- Chart on Public/government insurance companies - Market size and forecast 2024-2029 ($ billion)
- Data Table on Public/government insurance companies - Market size and forecast 2024-2029 ($ billion)
- Chart on Public/government insurance companies - Year-over-year growth 2024-2029 (%)
- Data Table on Public/government insurance companies - Year-over-year growth 2024-2029 (%)
- 10.4 Private insurance companies - Market size and forecast 2024-2029
- Chart on Private insurance companies - Market size and forecast 2024-2029 ($ billion)
- Data Table on Private insurance companies - Market size and forecast 2024-2029 ($ billion)
- Chart on Private insurance companies - Year-over-year growth 2024-2029 (%)
- Data Table on Private insurance companies - Year-over-year growth 2024-2029 (%)
- 10.5 Market opportunity by Sector
- Market opportunity by Sector ($ billion)
- Data Table on Market opportunity by Sector ($ billion)
11 Customer Landscape
- 11.1 Customer landscape overview
- Analysis of price sensitivity, lifecycle, customer purchase basket, adoption rates, and purchase criteria
12 Drivers, Challenges, and Opportunity/Restraints
- 12.1 Market drivers
- 12.2 Market challenges
- 12.3 Impact of drivers and challenges
- Impact of drivers and challenges in 2024 and 2029
- 12.4 Market opportunities/restraints
13 Competitive Landscape
- 13.1 Overview
- 13.2 Competitive Landscape
- Overview on criticality of inputs and factors of differentiation
- 13.3 Landscape disruption
- Overview on factors of disruption
- 13.4 Industry risks
- Impact of key risks on business
14 Competitive Analysis
- 14.1 Companies profiled
- Companies covered
- 14.2 Company ranking index
- Company ranking index
- 14.3 Market positioning of companies
- Matrix on companies position and classification
- 14.4 AFLAC Inc.
- AFLAC Inc. - Overview
- AFLAC Inc. - Business segments
- AFLAC Inc. - Key offerings
- AFLAC Inc. - Segment focus
- SWOT
- 14.5 Allianz SE
- Allianz SE - Overview
- Allianz SE - Business segments
- Allianz SE - Key news
- Allianz SE - Key offerings
- Allianz SE - Segment focus
- SWOT
- 14.6 Asahi Mutual Life Insurance Co.
- Asahi Mutual Life Insurance Co. - Overview
- Asahi Mutual Life Insurance Co. - Product / Service
- Asahi Mutual Life Insurance Co. - Key offerings
- SWOT
- 14.7 Dai ichi Life Holdings Inc.
- Dai ichi Life Holdings Inc. - Overview
- Dai ichi Life Holdings Inc. - Business segments
- Dai ichi Life Holdings Inc. - Key offerings
- Dai ichi Life Holdings Inc. - Segment focus
- SWOT
- 14.8 JAPAN POST INSURANCE Co., Ltd.
- JAPAN POST INSURANCE Co., Ltd. - Overview
- JAPAN POST INSURANCE Co., Ltd. - Product / Service
- JAPAN POST INSURANCE Co., Ltd. - Key offerings
- SWOT
- 14.9 Lifenet Insurance Co. Ltd.
- Lifenet Insurance Co. Ltd. - Overview
- Lifenet Insurance Co. Ltd. - Product / Service
- Lifenet Insurance Co. Ltd. - Key offerings
- SWOT
- 14.10 Manulife Financial Corp.
- Manulife Financial Corp. - Overview
- Manulife Financial Corp. - Business segments
- Manulife Financial Corp. - Key offerings
- Manulife Financial Corp. - Segment focus
- SWOT
- 14.11 Meiji Yasuda Life Insurance Co.
- Meiji Yasuda Life Insurance Co. - Overview
- Meiji Yasuda Life Insurance Co. - Product / Service
- Meiji Yasuda Life Insurance Co. - Key offerings
- SWOT
- 14.12 Metlife Inc.
- Metlife Inc. - Overview
- Metlife Inc. - Business segments
- Metlife Inc. - Key offerings
- Metlife Inc. - Segment focus
- SWOT
- 14.13 MS and AD Insurance Group Holdings Inc.
- MS and AD Insurance Group Holdings Inc. - Overview
- MS and AD Insurance Group Holdings Inc. - Business segments
- MS and AD Insurance Group Holdings Inc. - Key news
- MS and AD Insurance Group Holdings Inc. - Key offerings
- MS and AD Insurance Group Holdings Inc. - Segment focus
- SWOT
- 14.14 Nippon Life Insurance Co.
- Nippon Life Insurance Co. - Overview
- Nippon Life Insurance Co. - Business segments
- Nippon Life Insurance Co. - Key offerings
- Nippon Life Insurance Co. - Segment focus
- SWOT
- 14.15 Rakuten Group Inc.
- Rakuten Group Inc. - Overview
- Rakuten Group Inc. - Business segments
- Rakuten Group Inc. - Key news
- Rakuten Group Inc. - Key offerings
- Rakuten Group Inc. - Segment focus
- SWOT
- 14.16 Sompo Holdings Inc.
- Sompo Holdings Inc. - Overview
- Sompo Holdings Inc. - Business segments
- Sompo Holdings Inc. - Key offerings
- Sompo Holdings Inc. - Segment focus
- SWOT
- 14.17 Sony Financial Group Inc.
- Sony Financial Group Inc. - Overview
- Sony Financial Group Inc. - Business segments
- Sony Financial Group Inc. - Key offerings
- Sony Financial Group Inc. - Segment focus
- SWOT
- 14.18 Zurich Insurance Co. Ltd.
- Zurich Insurance Co. Ltd. - Overview
- Zurich Insurance Co. Ltd. - Business segments
- Zurich Insurance Co. Ltd. - Key news
- Zurich Insurance Co. Ltd. - Key offerings
- Zurich Insurance Co. Ltd. - Segment focus
- SWOT
15 Appendix
- 15.1 Scope of the report
- 15.2 Inclusions and exclusions checklist
- Inclusions checklist
- Exclusions checklist
- 15.3 Currency conversion rates for US$
- Currency conversion rates for US$
- 15.4 Research methodology
- Research methodology
- 15.5 Data procurement
- Information sources
- 15.6 Data validation
- Data validation
- 15.7 Validation techniques employed for market sizing
- Validation techniques employed for market sizing
- 15.8 Data synthesis
- Data synthesis
- 15.9 360 degree market analysis
- 360 degree market analysis
- 15.10 List of abbreviations
- List of abbreviations

