|
|
市場調査レポート
商品コード
1583100
石油・ガス産業のプロセス安全システムの世界市場 2024-2028年Global Process Safety System Market in The Oil and Gas Industry 2024-2028 |
||||||

|
|||||||
カスタマイズ可能
|
|||||||


| 石油・ガス産業のプロセス安全システムの世界市場 2024-2028年 |
|
出版日: 2024年10月12日
発行: TechNavio
ページ情報: 英文 184 Pages
納期: 即納可能
|

全表示
- 概要
- 図表
- 目次
石油・ガス産業のプロセス安全システム市場 2024-2028年
石油・ガス産業のプロセス安全システム市場は、2023-2028年に1億5,190万米ドル、予測期間中のCAGRは3.2%で成長すると予測されます。当レポートでは、石油・ガス産業のプロセス安全システム市場の全体的な分析、市場規模・予測、動向、成長促進要因、25社前後のベンダー分析などを掲載しています。
現在の市場シナリオ、最新動向と促進要因、市場環境全体に関する最新分析を提供しています。市場は、業務効率の改善、安全基準の改善と関連市場開拓、企業の社会的責任の重視の高まりによって牽引されています。
| 市場範囲 | |
|---|---|
| 基準年 | 2024 |
| 終了年 | 2028 |
| 予測期間 | 2024-2028 |
| 成長モメンタム | 加速 |
| 前年比2024年 | 3.1% |
| CAGR | 3.2% |
| 増分額 | 1億5,190万米ドル |
本調査では、カスタマイズされた安全システムの開拓が、今後数年間の石油・ガス産業のプロセス安全システム市場の成長を促進する主な要因の1つであるとしています。また、危険作業におけるロボットによるプロセス自動化の出現と、後付けアプリケーションにおける新しい安全制御システムの採用は、市場の大きな需要につながります。
目次
第1章 エグゼクティブサマリー
- 市場概要
第2章 市場情勢
- 市場エコシステム
- 市場の特徴
- バリューチェーン分析
第3章 市場規模の評価
- 市場の定義
- 市場セグメント分析
- 市場規模 2023
- 市場の見通し 2023-2028
第4章 市場規模実績
- 石油・ガス産業のプロセス安全システムの世界市場 2018-2022
- 用途別セグメント分析 2018-2022
- 製品別セグメント分析 2018-2022
- 地域別セグメント分析 2018-2022
- 国別セグメント分析 2018-2022
第5章 ファイブフォース分析
- ファイブフォースの要約
- 買い手の交渉力
- 供給企業の交渉力
- 新規参入業者の脅威
- 代替品の脅威
- 競争の脅威
- 市況
第6章 市場セグメンテーション:用途別
- 市場セグメンテーション
- 比較:用途別
- オンショア:市場規模と予測 2023-2028
- オフショア:市場規模と予測 2023-2028
- 用途別の市場機会
第7章 市場セグメンテーション:製品別
- 市場セグメンテーション
- 比較:製品別
- ハードウェア:市場規模と予測 2023-2028
- ソフトウェア:市場規模と予測 2023-2028
- サービス:市場規模と予測 2023-2028
- 製品別の市場機会
第8章 顧客情勢
- 顧客情勢の概要
第9章 地域別情勢
- 地域別セグメンテーション
- 地域別比較
- 北米:市場規模と予測 2023-2028
- アジア太平洋:市場規模と予測 2023-2028
- 欧州:市場規模と予測 2023-2028
- 中東・アフリカ:市場規模と予測 2023-2028
- 南米:市場規模と予測 2023-2028
- 米国:市場規模と予測 2023-2028
- 中国:市場規模と予測 2023-2028
- ロシア:市場規模と予測 2023-2028
- カナダ:市場規模と予測 2023-2028
- サウジアラビア:市場規模と予測 2023-2028
- 地域情勢別市場機会
第10章 促進要因・課題・機会・抑制要因
- 市場促進要因
- 市場の課題
- 促進要因と課題の影響
- 市場の機会・抑制要因
第11章 競合情勢
- 概要
- 競合情勢
- 混乱の状況
- 業界のリスク
第12章 競合分析
- 企業プロファイル
- 企業の市場ポジショニング
- ABB
- Bureau Veritas SA
- Emerson Electric Co.
- General Electric Co.
- Halma Plc
- Honeywell International Inc.
- Johnson Controls International Plc.
- OMRON Corp.
- Pentair Plc
- Primatech Inc
- Rockwell Automation Inc.
- RTP Co.
- Schneider Electric SE
- Siemens AG
- Yokogawa Electric Corp.
第13章 付録
Exhibits:
- Exhibits1: Executive Summary - Chart on Market Overview
- Exhibits2: Executive Summary - Data Table on Market Overview
- Exhibits3: Executive Summary - Chart on Global Market Characteristics
- Exhibits4: Executive Summary - Chart on Market By Geographical Landscape
- Exhibits5: Executive Summary - Chart on Market Segmentation by Application
- Exhibits6: Executive Summary - Chart on Market Segmentation by Product
- Exhibits7: Executive Summary - Chart on Incremental Growth
- Exhibits8: Executive Summary - Data Table on Incremental Growth
- Exhibits9: Executive Summary - Chart on Company Market Positioning
- Exhibits10: Parent Market
- Exhibits11: Data Table on - Parent Market
- Exhibits12: Market characteristics analysis
- Exhibits13: Value Chain Analysis
- Exhibits14: Offerings of companies included in the market definition
- Exhibits15: Market segments
- Exhibits16: Chart on Global - Market size and forecast 2023-2028 ($ million)
- Exhibits17: Data Table on Global - Market size and forecast 2023-2028 ($ million)
- Exhibits18: Chart on Global Market: Year-over-year growth 2023-2028 (%)
- Exhibits19: Data Table on Global Market: Year-over-year growth 2023-2028 (%)
- Exhibits20: Historic Market Size - Data Table on Global Process Safety System Market In The Oil And Gas Industry 2018 - 2022 ($ million)
- Exhibits21: Historic Market Size - Application Segment 2018 - 2022 ($ million)
- Exhibits22: Historic Market Size - Product Segment 2018 - 2022 ($ million)
- Exhibits23: Historic Market Size - Geography Segment 2018 - 2022 ($ million)
- Exhibits24: Historic Market Size - Country Segment 2018 - 2022 ($ million)
- Exhibits25: Five forces analysis - Comparison between 2023 and 2028
- Exhibits26: Bargaining power of buyers - Impact of key factors 2023 and 2028
- Exhibits27: Bargaining power of suppliers - Impact of key factors in 2023 and 2028
- Exhibits28: Threat of new entrants - Impact of key factors in 2023 and 2028
- Exhibits29: Threat of substitutes - Impact of key factors in 2023 and 2028
- Exhibits30: Threat of rivalry - Impact of key factors in 2023 and 2028
- Exhibits31: Chart on Market condition - Five forces 2023 and 2028
- Exhibits32: Chart on Application - Market share 2023-2028 (%)
- Exhibits33: Data Table on Application - Market share 2023-2028 (%)
- Exhibits34: Chart on Comparison by Application
- Exhibits35: Data Table on Comparison by Application
- Exhibits36: Chart on Onshore - Market size and forecast 2023-2028 ($ million)
- Exhibits37: Data Table on Onshore - Market size and forecast 2023-2028 ($ million)
- Exhibits38: Chart on Onshore - Year-over-year growth 2023-2028 (%)
- Exhibits39: Data Table on Onshore - Year-over-year growth 2023-2028 (%)
- Exhibits40: Chart on Offshore - Market size and forecast 2023-2028 ($ million)
- Exhibits41: Data Table on Offshore - Market size and forecast 2023-2028 ($ million)
- Exhibits42: Chart on Offshore - Year-over-year growth 2023-2028 (%)
- Exhibits43: Data Table on Offshore - Year-over-year growth 2023-2028 (%)
- Exhibits44: Market opportunity by Application ($ million)
- Exhibits45: Data Table on Market opportunity by Application ($ million)
- Exhibits46: Chart on Product - Market share 2023-2028 (%)
- Exhibits47: Data Table on Product - Market share 2023-2028 (%)
- Exhibits48: Chart on Comparison by Product
- Exhibits49: Data Table on Comparison by Product
- Exhibits50: Chart on Hardware - Market size and forecast 2023-2028 ($ million)
- Exhibits51: Data Table on Hardware - Market size and forecast 2023-2028 ($ million)
- Exhibits52: Chart on Hardware - Year-over-year growth 2023-2028 (%)
- Exhibits53: Data Table on Hardware - Year-over-year growth 2023-2028 (%)
- Exhibits54: Chart on Software - Market size and forecast 2023-2028 ($ million)
- Exhibits55: Data Table on Software - Market size and forecast 2023-2028 ($ million)
- Exhibits56: Chart on Software - Year-over-year growth 2023-2028 (%)
- Exhibits57: Data Table on Software - Year-over-year growth 2023-2028 (%)
- Exhibits58: Chart on Service - Market size and forecast 2023-2028 ($ million)
- Exhibits59: Data Table on Service - Market size and forecast 2023-2028 ($ million)
- Exhibits60: Chart on Service - Year-over-year growth 2023-2028 (%)
- Exhibits61: Data Table on Service - Year-over-year growth 2023-2028 (%)
- Exhibits62: Market opportunity by Product ($ million)
- Exhibits63: Data Table on Market opportunity by Product ($ million)
- Exhibits64: Analysis of price sensitivity, lifecycle, customer purchase basket, adoption rates, and purchase criteria
- Exhibits65: Chart on Market share By Geographical Landscape 2023-2028 (%)
- Exhibits66: Data Table on Market share By Geographical Landscape 2023-2028 (%)
- Exhibits67: Chart on Geographic comparison
- Exhibits68: Data Table on Geographic comparison
- Exhibits69: Chart on North America - Market size and forecast 2023-2028 ($ million)
- Exhibits70: Data Table on North America - Market size and forecast 2023-2028 ($ million)
- Exhibits71: Chart on North America - Year-over-year growth 2023-2028 (%)
- Exhibits72: Data Table on North America - Year-over-year growth 2023-2028 (%)
- Exhibits73: Chart on APAC - Market size and forecast 2023-2028 ($ million)
- Exhibits74: Data Table on APAC - Market size and forecast 2023-2028 ($ million)
- Exhibits75: Chart on APAC - Year-over-year growth 2023-2028 (%)
- Exhibits76: Data Table on APAC - Year-over-year growth 2023-2028 (%)
- Exhibits77: Chart on Europe - Market size and forecast 2023-2028 ($ million)
- Exhibits78: Data Table on Europe - Market size and forecast 2023-2028 ($ million)
- Exhibits79: Chart on Europe - Year-over-year growth 2023-2028 (%)
- Exhibits80: Data Table on Europe - Year-over-year growth 2023-2028 (%)
- Exhibits81: Chart on Middle East and Africa - Market size and forecast 2023-2028 ($ million)
- Exhibits82: Data Table on Middle East and Africa - Market size and forecast 2023-2028 ($ million)
- Exhibits83: Chart on Middle East and Africa - Year-over-year growth 2023-2028 (%)
- Exhibits84: Data Table on Middle East and Africa - Year-over-year growth 2023-2028 (%)
- Exhibits85: Chart on South America - Market size and forecast 2023-2028 ($ million)
- Exhibits86: Data Table on South America - Market size and forecast 2023-2028 ($ million)
- Exhibits87: Chart on South America - Year-over-year growth 2023-2028 (%)
- Exhibits88: Data Table on South America - Year-over-year growth 2023-2028 (%)
- Exhibits89: Chart on US - Market size and forecast 2023-2028 ($ million)
- Exhibits90: Data Table on US - Market size and forecast 2023-2028 ($ million)
- Exhibits91: Chart on US - Year-over-year growth 2023-2028 (%)
- Exhibits92: Data Table on US - Year-over-year growth 2023-2028 (%)
- Exhibits93: Chart on China - Market size and forecast 2023-2028 ($ million)
- Exhibits94: Data Table on China - Market size and forecast 2023-2028 ($ million)
- Exhibits95: Chart on China - Year-over-year growth 2023-2028 (%)
- Exhibits96: Data Table on China - Year-over-year growth 2023-2028 (%)
- Exhibits97: Chart on Russia - Market size and forecast 2023-2028 ($ million)
- Exhibits98: Data Table on Russia - Market size and forecast 2023-2028 ($ million)
- Exhibits99: Chart on Russia - Year-over-year growth 2023-2028 (%)
- Exhibits100: Data Table on Russia - Year-over-year growth 2023-2028 (%)
- Exhibits101: Chart on Canada - Market size and forecast 2023-2028 ($ million)
- Exhibits102: Data Table on Canada - Market size and forecast 2023-2028 ($ million)
- Exhibits103: Chart on Canada - Year-over-year growth 2023-2028 (%)
- Exhibits104: Data Table on Canada - Year-over-year growth 2023-2028 (%)
- Exhibits105: Chart on Saudi Arabia - Market size and forecast 2023-2028 ($ million)
- Exhibits106: Data Table on Saudi Arabia - Market size and forecast 2023-2028 ($ million)
- Exhibits107: Chart on Saudi Arabia - Year-over-year growth 2023-2028 (%)
- Exhibits108: Data Table on Saudi Arabia - Year-over-year growth 2023-2028 (%)
- Exhibits109: Market opportunity By Geographical Landscape ($ million)
- Exhibits110: Data Tables on Market opportunity By Geographical Landscape ($ million)
- Exhibits111: Impact of drivers and challenges in 2023 and 2028
- Exhibits112: Overview on criticality of inputs and factors of differentiation
- Exhibits113: Overview on factors of disruption
- Exhibits114: Impact of key risks on business
- Exhibits115: Companies covered
- Exhibits116: Matrix on companies position and classification
- Exhibits117: ABB - Overview
- Exhibits118: ABB - Business segments
- Exhibits119: ABB - Key news
- Exhibits120: ABB - Key offerings
- Exhibits121: ABB - Segment focus
- Exhibits122: Bureau Veritas SA - Overview
- Exhibits123: Bureau Veritas SA - Business segments
- Exhibits124: Bureau Veritas SA - Key offerings
- Exhibits125: Bureau Veritas SA - Segment focus
- Exhibits126: Emerson Electric Co. - Overview
- Exhibits127: Emerson Electric Co. - Business segments
- Exhibits128: Emerson Electric Co. - Key news
- Exhibits129: Emerson Electric Co. - Key offerings
- Exhibits130: Emerson Electric Co. - Segment focus
- Exhibits131: General Electric Co. - Overview
- Exhibits132: General Electric Co. - Business segments
- Exhibits133: General Electric Co. - Key news
- Exhibits134: General Electric Co. - Key offerings
- Exhibits135: General Electric Co. - Segment focus
- Exhibits136: Halma Plc - Overview
- Exhibits137: Halma Plc - Business segments
- Exhibits138: Halma Plc - Key news
- Exhibits139: Halma Plc - Key offerings
- Exhibits140: Halma Plc - Segment focus
- Exhibits141: Honeywell International Inc. - Overview
- Exhibits142: Honeywell International Inc. - Business segments
- Exhibits143: Honeywell International Inc. - Key news
- Exhibits144: Honeywell International Inc. - Key offerings
- Exhibits145: Honeywell International Inc. - Segment focus
- Exhibits146: Johnson Controls International Plc. - Overview
- Exhibits147: Johnson Controls International Plc. - Business segments
- Exhibits148: Johnson Controls International Plc. - Key news
- Exhibits149: Johnson Controls International Plc. - Key offerings
- Exhibits150: Johnson Controls International Plc. - Segment focus
- Exhibits151: OMRON Corp. - Overview
- Exhibits152: OMRON Corp. - Business segments
- Exhibits153: OMRON Corp. - Key news
- Exhibits154: OMRON Corp. - Key offerings
- Exhibits155: OMRON Corp. - Segment focus
- Exhibits156: Pentair Plc - Overview
- Exhibits157: Pentair Plc - Business segments
- Exhibits158: Pentair Plc - Key news
- Exhibits159: Pentair Plc - Key offerings
- Exhibits160: Pentair Plc - Segment focus
- Exhibits161: Primatech Inc - Overview
- Exhibits162: Primatech Inc - Product / Service
- Exhibits163: Primatech Inc - Key offerings
- Exhibits164: Rockwell Automation Inc. - Overview
- Exhibits165: Rockwell Automation Inc. - Business segments
- Exhibits166: Rockwell Automation Inc. - Key news
- Exhibits167: Rockwell Automation Inc. - Key offerings
- Exhibits168: Rockwell Automation Inc. - Segment focus
- Exhibits169: RTP Co. - Overview
- Exhibits170: RTP Co. - Product / Service
- Exhibits171: RTP Co. - Key offerings
- Exhibits172: Schneider Electric SE - Overview
- Exhibits173: Schneider Electric SE - Business segments
- Exhibits174: Schneider Electric SE - Key news
- Exhibits175: Schneider Electric SE - Key offerings
- Exhibits176: Schneider Electric SE - Segment focus
- Exhibits177: Siemens AG - Overview
- Exhibits178: Siemens AG - Business segments
- Exhibits179: Siemens AG - Key news
- Exhibits180: Siemens AG - Key offerings
- Exhibits181: Siemens AG - Segment focus
- Exhibits182: Yokogawa Electric Corp. - Overview
- Exhibits183: Yokogawa Electric Corp. - Business segments
- Exhibits184: Yokogawa Electric Corp. - Key news
- Exhibits185: Yokogawa Electric Corp. - Key offerings
- Exhibits186: Yokogawa Electric Corp. - Segment focus
- Exhibits187: Inclusions checklist
- Exhibits188: Exclusions checklist
- Exhibits189: Currency conversion rates for US$
- Exhibits190: Research methodology
- Exhibits191: Information sources
- Exhibits192: Data validation
- Exhibits193: Validation techniques employed for market sizing
- Exhibits194: Data synthesis
- Exhibits195: 360 degree market analysis
- Exhibits196: List of abbreviations
Process Safety System Market In The Oil And Gas Industry 2024-2028
The process safety system market in the oil and gas industry is forecasted to grow by USD 151.9 mn during 2023-2028, accelerating at a CAGR of 3.2% during the forecast period. The report on the process safety system market in the oil and gas industry provides a holistic analysis, market size and forecast, trends, growth drivers, and challenges, as well as vendor analysis covering around 25 vendors.
The report offers an up-to-date analysis regarding the current market scenario, the latest trends and drivers, and the overall market environment. The market is driven by improvement in operational efficiency, improving safety standards and related developments, and increasing emphasis on corporate social responsibility.
| Market Scope | |
|---|---|
| Base Year | 2024 |
| End Year | 2028 |
| Series Year | 2024-2028 |
| Growth Momentum | Accelerate |
| YOY 2024 | 3.1% |
| CAGR | 3.2% |
| Incremental Value | $151.9 mn |
Technavio's process safety system market in the oil and gas industry is segmented as below:
By Application
- Onshore
- Offshore
By Product
- Hardware
- Software
- Service
By Geographical Landscape
- North America
- APAC
- Europe
- Middle East and Africa
- South America
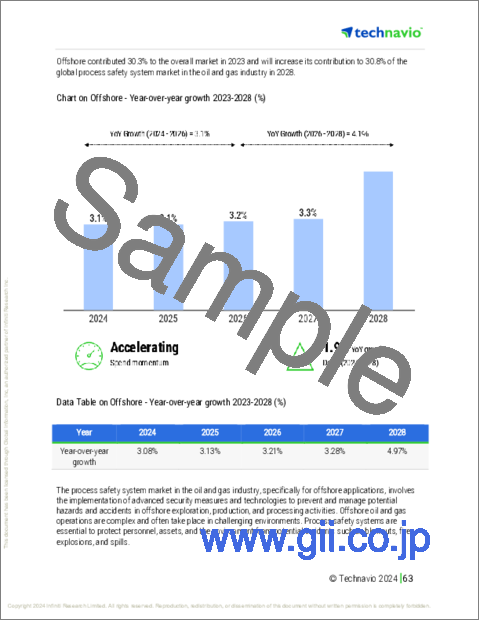
This study identifies the development of customized safety systems as one of the prime reasons driving the process safety system market in the oil and gas industry growth during the next few years. Also, emergence of robotic process automation in hazardous operations and adoption of new safety control systems in retrofit applications will lead to sizable demand in the market.
The report on the process safety system market in the oil and gas industry covers the following areas:
- Process Safety System Market In The Oil And Gas Industry sizing
- Process Safety System Market In The Oil And Gas Industry forecast
- Process Safety System Market In The Oil And Gas Industry industry analysis
The robust vendor analysis is designed to help clients improve their market position, and in line with this, this report provides a detailed analysis of several leading process safety system market in the oil and gas industry vendors that include ABB, Bureau Veritas SA, Emerson Electric Co., General Electric Co., Halma Plc, Hexagon AB, HIMA Paul Hildebrandt GmbH, Honeywell International Inc., Intertek Group Plc, Johnson Controls International Plc., OMRON Corp., Pentair Plc, Primatech Inc, Rockwell Automation Inc., RTP Co., Schneider Electric SE, SGS SA, Siemens AG, TUV SUD AG, and Yokogawa Electric Corp.. Also, the process safety system market in the oil and gas industry analysis report includes information on upcoming trends and challenges that will influence market growth. This is to help companies strategize and leverage all forthcoming growth opportunities.
The study was conducted using an objective combination of primary and secondary information including inputs from key participants in the industry. The report contains a comprehensive market and vendor landscape in addition to an analysis of the key vendors.
The publisher presents a detailed picture of the market by the way of study, synthesis, and summation of data from multiple sources by an analysis of key parameters such as profit, pricing, competition, and promotions. It presents various market facets by identifying the key industry influencers. The data presented is comprehensive, reliable, and a result of extensive primary and secondary research. The market research reports provide a complete competitive landscape and an in-depth vendor selection methodology and analysis using qualitative and quantitative research to forecast accurate market growth.
Table of Contents
1 Executive Summary
- 1.1 Market overview
- Executive Summary - Chart on Market Overview
- Executive Summary - Data Table on Market Overview
- Executive Summary - Chart on Global Market Characteristics
- Executive Summary - Chart on Market By Geographical Landscape
- Executive Summary - Chart on Market Segmentation by Application
- Executive Summary - Chart on Market Segmentation by Product
- Executive Summary - Chart on Incremental Growth
- Executive Summary - Data Table on Incremental Growth
- Executive Summary - Chart on Company Market Positioning
2 Market Landscape
- 2.1 Market ecosystem
- Parent Market
- Data Table on - Parent Market
- 2.2 Market characteristics
- Market characteristics analysis
- 2.3 Value chain analysis
- Value Chain Analysis
3 Market Sizing
- 3.1 Market definition
- Offerings of companies included in the market definition
- 3.2 Market segment analysis
- Market segments
- 3.3 Market size 2023
- 3.4 Market outlook: Forecast for 2023-2028
- Chart on Global - Market size and forecast 2023-2028 ($ million)
- Data Table on Global - Market size and forecast 2023-2028 ($ million)
- Chart on Global Market: Year-over-year growth 2023-2028 (%)
- Data Table on Global Market: Year-over-year growth 2023-2028 (%)
4 Historic Market Size
- 4.1 Global Process Safety System Market In The Oil And Gas Industry 2018 - 2022
- Historic Market Size - Data Table on Global Process Safety System Market In The Oil And Gas Industry 2018 - 2022 ($ million)
- 4.2 Application segment analysis 2018 - 2022
- Historic Market Size - Application Segment 2018 - 2022 ($ million)
- 4.3 Product segment analysis 2018 - 2022
- Historic Market Size - Product Segment 2018 - 2022 ($ million)
- 4.4 Geography segment analysis 2018 - 2022
- Historic Market Size - Geography Segment 2018 - 2022 ($ million)
- 4.5 Country segment analysis 2018 - 2022
- Historic Market Size - Country Segment 2018 - 2022 ($ million)
5 Five Forces Analysis
- 5.1 Five forces summary
- Five forces analysis - Comparison between 2023 and 2028
- 5.2 Bargaining power of buyers
- Bargaining power of buyers - Impact of key factors 2023 and 2028
- 5.3 Bargaining power of suppliers
- Bargaining power of suppliers - Impact of key factors in 2023 and 2028
- 5.4 Threat of new entrants
- Threat of new entrants - Impact of key factors in 2023 and 2028
- 5.5 Threat of substitutes
- Threat of substitutes - Impact of key factors in 2023 and 2028
- 5.6 Threat of rivalry
- Threat of rivalry - Impact of key factors in 2023 and 2028
- 5.7 Market condition
- Chart on Market condition - Five forces 2023 and 2028
6 Market Segmentation by Application
- 6.1 Market segments
- Chart on Application - Market share 2023-2028 (%)
- Data Table on Application - Market share 2023-2028 (%)
- 6.2 Comparison by Application
- Chart on Comparison by Application
- Data Table on Comparison by Application
- 6.3 Onshore - Market size and forecast 2023-2028
- Chart on Onshore - Market size and forecast 2023-2028 ($ million)
- Data Table on Onshore - Market size and forecast 2023-2028 ($ million)
- Chart on Onshore - Year-over-year growth 2023-2028 (%)
- Data Table on Onshore - Year-over-year growth 2023-2028 (%)
- 6.4 Offshore - Market size and forecast 2023-2028
- Chart on Offshore - Market size and forecast 2023-2028 ($ million)
- Data Table on Offshore - Market size and forecast 2023-2028 ($ million)
- Chart on Offshore - Year-over-year growth 2023-2028 (%)
- Data Table on Offshore - Year-over-year growth 2023-2028 (%)
- 6.5 Market opportunity by Application
- Market opportunity by Application ($ million)
- Data Table on Market opportunity by Application ($ million)
7 Market Segmentation by Product
- 7.1 Market segments
- Chart on Product - Market share 2023-2028 (%)
- Data Table on Product - Market share 2023-2028 (%)
- 7.2 Comparison by Product
- Chart on Comparison by Product
- Data Table on Comparison by Product
- 7.3 Hardware - Market size and forecast 2023-2028
- Chart on Hardware - Market size and forecast 2023-2028 ($ million)
- Data Table on Hardware - Market size and forecast 2023-2028 ($ million)
- Chart on Hardware - Year-over-year growth 2023-2028 (%)
- Data Table on Hardware - Year-over-year growth 2023-2028 (%)
- 7.4 Software - Market size and forecast 2023-2028
- Chart on Software - Market size and forecast 2023-2028 ($ million)
- Data Table on Software - Market size and forecast 2023-2028 ($ million)
- Chart on Software - Year-over-year growth 2023-2028 (%)
- Data Table on Software - Year-over-year growth 2023-2028 (%)
- 7.5 Service - Market size and forecast 2023-2028
- Chart on Service - Market size and forecast 2023-2028 ($ million)
- Data Table on Service - Market size and forecast 2023-2028 ($ million)
- Chart on Service - Year-over-year growth 2023-2028 (%)
- Data Table on Service - Year-over-year growth 2023-2028 (%)
- 7.6 Market opportunity by Product
- Market opportunity by Product ($ million)
- Data Table on Market opportunity by Product ($ million)
8 Customer Landscape
- 8.1 Customer landscape overview
- Analysis of price sensitivity, lifecycle, customer purchase basket, adoption rates, and purchase criteria
9 Geographic Landscape
- 9.1 Geographic segmentation
- Chart on Market share By Geographical Landscape 2023-2028 (%)
- Data Table on Market share By Geographical Landscape 2023-2028 (%)
- 9.2 Geographic comparison
- Chart on Geographic comparison
- Data Table on Geographic comparison
- 9.3 North America - Market size and forecast 2023-2028
- Chart on North America - Market size and forecast 2023-2028 ($ million)
- Data Table on North America - Market size and forecast 2023-2028 ($ million)
- Chart on North America - Year-over-year growth 2023-2028 (%)
- Data Table on North America - Year-over-year growth 2023-2028 (%)
- 9.4 APAC - Market size and forecast 2023-2028
- Chart on APAC - Market size and forecast 2023-2028 ($ million)
- Data Table on APAC - Market size and forecast 2023-2028 ($ million)
- Chart on APAC - Year-over-year growth 2023-2028 (%)
- Data Table on APAC - Year-over-year growth 2023-2028 (%)
- 9.5 Europe - Market size and forecast 2023-2028
- Chart on Europe - Market size and forecast 2023-2028 ($ million)
- Data Table on Europe - Market size and forecast 2023-2028 ($ million)
- Chart on Europe - Year-over-year growth 2023-2028 (%)
- Data Table on Europe - Year-over-year growth 2023-2028 (%)
- 9.6 Middle East and Africa - Market size and forecast 2023-2028
- Chart on Middle East and Africa - Market size and forecast 2023-2028 ($ million)
- Data Table on Middle East and Africa - Market size and forecast 2023-2028 ($ million)
- Chart on Middle East and Africa - Year-over-year growth 2023-2028 (%)
- Data Table on Middle East and Africa - Year-over-year growth 2023-2028 (%)
- 9.7 South America - Market size and forecast 2023-2028
- Chart on South America - Market size and forecast 2023-2028 ($ million)
- Data Table on South America - Market size and forecast 2023-2028 ($ million)
- Chart on South America - Year-over-year growth 2023-2028 (%)
- Data Table on South America - Year-over-year growth 2023-2028 (%)
- 9.8 US - Market size and forecast 2023-2028
- Chart on US - Market size and forecast 2023-2028 ($ million)
- Data Table on US - Market size and forecast 2023-2028 ($ million)
- Chart on US - Year-over-year growth 2023-2028 (%)
- Data Table on US - Year-over-year growth 2023-2028 (%)
- 9.9 China - Market size and forecast 2023-2028
- Chart on China - Market size and forecast 2023-2028 ($ million)
- Data Table on China - Market size and forecast 2023-2028 ($ million)
- Chart on China - Year-over-year growth 2023-2028 (%)
- Data Table on China - Year-over-year growth 2023-2028 (%)
- 9.10 Russia - Market size and forecast 2023-2028
- Chart on Russia - Market size and forecast 2023-2028 ($ million)
- Data Table on Russia - Market size and forecast 2023-2028 ($ million)
- Chart on Russia - Year-over-year growth 2023-2028 (%)
- Data Table on Russia - Year-over-year growth 2023-2028 (%)
- 9.11 Canada - Market size and forecast 2023-2028
- Chart on Canada - Market size and forecast 2023-2028 ($ million)
- Data Table on Canada - Market size and forecast 2023-2028 ($ million)
- Chart on Canada - Year-over-year growth 2023-2028 (%)
- Data Table on Canada - Year-over-year growth 2023-2028 (%)
- 9.12 Saudi Arabia - Market size and forecast 2023-2028
- Chart on Saudi Arabia - Market size and forecast 2023-2028 ($ million)
- Data Table on Saudi Arabia - Market size and forecast 2023-2028 ($ million)
- Chart on Saudi Arabia - Year-over-year growth 2023-2028 (%)
- Data Table on Saudi Arabia - Year-over-year growth 2023-2028 (%)
- 9.13 Market opportunity By Geographical Landscape
- Market opportunity By Geographical Landscape ($ million)
- Data Tables on Market opportunity By Geographical Landscape ($ million)
10 Drivers, Challenges, and Opportunity/Restraints
- 10.1 Market drivers
- 10.2 Market challenges
- 10.3 Impact of drivers and challenges
- Impact of drivers and challenges in 2023 and 2028
- 10.4 Market opportunities/restraints
11 Competitive Landscape
- 11.1 Overview
- 11.2 Competitive Landscape
- Overview on criticality of inputs and factors of differentiation
- 11.3 Landscape disruption
- Overview on factors of disruption
- 11.4 Industry risks
- Impact of key risks on business
12 Competitive Analysis
- 12.1 Companies profiled
- Companies covered
- 12.2 Market positioning of companies
- Matrix on companies position and classification
- 12.3 ABB
- ABB - Overview
- ABB - Business segments
- ABB - Key news
- ABB - Key offerings
- ABB - Segment focus
- 12.4 Bureau Veritas SA
- Bureau Veritas SA - Overview
- Bureau Veritas SA - Business segments
- Bureau Veritas SA - Key offerings
- Bureau Veritas SA - Segment focus
- 12.5 Emerson Electric Co.
- Emerson Electric Co. - Overview
- Emerson Electric Co. - Business segments
- Emerson Electric Co. - Key news
- Emerson Electric Co. - Key offerings
- Emerson Electric Co. - Segment focus
- 12.6 General Electric Co.
- General Electric Co. - Overview
- General Electric Co. - Business segments
- General Electric Co. - Key news
- General Electric Co. - Key offerings
- General Electric Co. - Segment focus
- 12.7 Halma Plc
- Halma Plc - Overview
- Halma Plc - Business segments
- Halma Plc - Key news
- Halma Plc - Key offerings
- Halma Plc - Segment focus
- 12.8 Honeywell International Inc.
- Honeywell International Inc. - Overview
- Honeywell International Inc. - Business segments
- Honeywell International Inc. - Key news
- Honeywell International Inc. - Key offerings
- Honeywell International Inc. - Segment focus
- 12.9 Johnson Controls International Plc.
- Johnson Controls International Plc. - Overview
- Johnson Controls International Plc. - Business segments
- Johnson Controls International Plc. - Key news
- Johnson Controls International Plc. - Key offerings
- Johnson Controls International Plc. - Segment focus
- 12.10 OMRON Corp.
- OMRON Corp. - Overview
- OMRON Corp. - Business segments
- OMRON Corp. - Key news
- OMRON Corp. - Key offerings
- OMRON Corp. - Segment focus
- 12.11 Pentair Plc
- Pentair Plc - Overview
- Pentair Plc - Business segments
- Pentair Plc - Key news
- Pentair Plc - Key offerings
- Pentair Plc - Segment focus
- 12.12 Primatech Inc
- Primatech Inc - Overview
- Primatech Inc - Product / Service
- Primatech Inc - Key offerings
- 12.13 Rockwell Automation Inc.
- Rockwell Automation Inc. - Overview
- Rockwell Automation Inc. - Business segments
- Rockwell Automation Inc. - Key news
- Rockwell Automation Inc. - Key offerings
- Rockwell Automation Inc. - Segment focus
- 12.14 RTP Co.
- RTP Co. - Overview
- RTP Co. - Product / Service
- RTP Co. - Key offerings
- 12.15 Schneider Electric SE
- Schneider Electric SE - Overview
- Schneider Electric SE - Business segments
- Schneider Electric SE - Key news
- Schneider Electric SE - Key offerings
- Schneider Electric SE - Segment focus
- 12.16 Siemens AG
- Siemens AG - Overview
- Siemens AG - Business segments
- Siemens AG - Key news
- Siemens AG - Key offerings
- Siemens AG - Segment focus
- 12.17 Yokogawa Electric Corp.
- Yokogawa Electric Corp. - Overview
- Yokogawa Electric Corp. - Business segments
- Yokogawa Electric Corp. - Key news
- Yokogawa Electric Corp. - Key offerings
- Yokogawa Electric Corp. - Segment focus
13 Appendix
- 13.1 Scope of the report
- 13.2 Inclusions and exclusions checklist
- Inclusions checklist
- Exclusions checklist
- 13.3 Currency conversion rates for US$
- Currency conversion rates for US$
- 13.4 Research methodology
- Research methodology
- 13.5 Data procurement
- Information sources
- 13.6 Data validation
- Data validation
- 13.7 Validation techniques employed for market sizing
- Validation techniques employed for market sizing
- 13.8 Data synthesis
- Data synthesis
- 13.9 360 degree market analysis
- 360 degree market analysis
- 13.10 List of abbreviations
- List of abbreviations
