|
|
市場調査レポート
商品コード
1915354
世界のライナーレスラベル市場2026-2030年Global Linerless Labels Market 2026-2030 |
||||||
|
|||||||
カスタマイズ可能
|
|||||||

| 世界のライナーレスラベル市場2026-2030年 |
|
出版日: 2026年01月19日
発行: TechNavio
ページ情報: 英文 303 Pages
納期: 即納可能
|

概要
世界のライナーレスラベル市場は、2025年から2030年の間に11億3,960万米ドルの成長が見込まれ、予測期間中のCAGRは8.1%と予測されています。
本報告書では、世界のライナーレスラベル市場に関する包括的な分析、市場規模と予測、動向、成長要因、課題に加え、約25社のベンダー分析を提供しております。
本レポートは、現在の市場状況、最新の動向と促進要因、市場環境全般に関する最新の分析を提供します。市場は、環境持続可能性と廃棄物削減への企業の関心の高まり、業務生産性と資源管理の最適化、自動化アプリケーションと接着剤技術における技術進歩によって牽引されています。
本調査は、業界の主要関係者からの情報をはじめとする一次情報と二次情報を客観的に組み合わせて実施されました。本レポートには、主要企業の分析に加え、包括的な市場規模データ、地域別分析を伴うセグメント、ベンダー情勢が含まれています。レポートには過去データと予測データが掲載されています。
| 市場範囲 | |
|---|---|
| 基準年 | 2026年 |
| 終了年 | 2030年 |
| 予測期間 | 2026-2030 |
| 成長モメンタム | 加速 |
| 前年比2026年 | 8.1% |
| CAGR | 8.1% |
| 増分額 | 11億3,960万米ドル |
本調査では、持続可能な材料科学とバイオベース接着剤の進歩が、今後数年間における世界のライナーレスラベル市場の成長を牽引する主要な要因の一つであると特定しております。また、ライナーレス形式へのデジタル識別技術とスマート技術の統合、ならびに高速自動化とインテリジェントアプリケーションシステムの進化が、市場における相当な需要を生み出すものと見込まれます。
目次
第1章 エグゼクティブサマリー
第2章 Technavio分析
- 価格・ライフサイクル・顧客購入バスケット・採用率・購入基準の分析
- インプットの重要性と差別化の要因
- 混乱の要因
- 促進要因と課題の影響
第3章 市場情勢
- 市場エコシステム
- 市場の特徴
- バリューチェーン分析
第4章 市場規模
- 市場の定義
- 市場セグメント分析
- 市場規模 2025
- 市場の見通し 2025-2030
第5章 市場規模実績
- 世界のライナーレスラベル市場 2020-2024
- タイプセグメント分析 2020-2024
- エンドユーザーセグメント分析 2020-2024
- 製品タイプセグメント分析 2020-2024
- 地域別セグメント分析 2020-2024
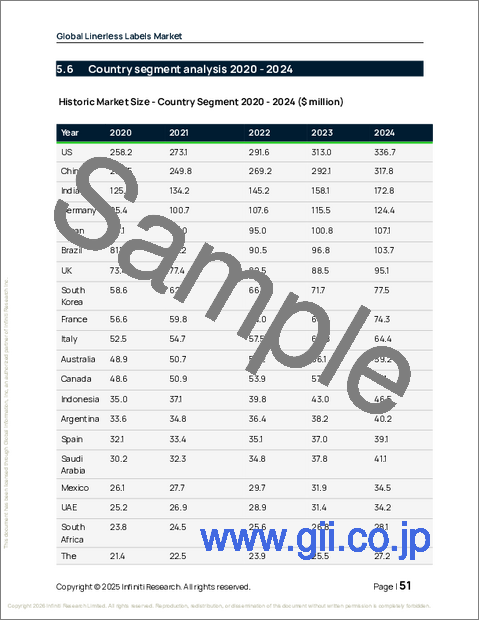
- 国別セグメント分析 2020-2024
第6章 定性分析
- AIの影響:世界のライナーレスラベル市場
第7章 ファイブフォース分析
- ファイブフォースの要約
- 買い手の交渉力
- 供給企業の交渉力
- 新規参入業者の脅威
- 代替品の脅威
- 競争の脅威
- 市況
第8章 市場セグメンテーション:タイプ別
- 比較:タイプ別
- 水性インク
- UV硬化型インク
- 溶剤系インク
- ホットメルト系インク
- 市場機会:タイプ別
第9章 市場セグメンテーション:エンドユーザー別
- 比較:エンドユーザー別
- 食品・飲料
- 小売り
- パーソナルケア
- 医薬品
- その他
- 市場機会:エンドユーザー別
第10章 市場セグメンテーション:製品タイプ別
- 比較:製品タイプ別
- 可変情報印刷
- プライマリラベル
- 市場機会:製品タイプ別
第11章 顧客情勢
第12章 地域別情勢
- 地域別セグメンテーション
- 地域別比較
- アジア太平洋
- 中国
- インド
- 日本
- 韓国
- オーストラリア
- インドネシア
- 欧州
- ドイツ
- 英国
- フランス
- イタリア
- スペイン
- オランダ
- 北米
- 米国
- カナダ
- メキシコ
- 南米
- ブラジル
- アルゼンチン
- チリ
- 中東・アフリカ
- サウジアラビア
- アラブ首長国連邦
- 南アフリカ
- イスラエル
- トルコ
- 市場機会:地域別
第13章 促進要因・課題・機会
- 市場促進要因
- 市場の課題
- 促進要因と課題の影響
- 市場機会
第14章 競合情勢
- 概要
- 競合情勢
- 混乱の状況
- 業界のリスク
第15章 競合分析
- 企業プロファイル
- 企業ランキング指標
- 企業の市場ポジショニング
- 3M Co.
- Avery Dennison Corp.
- CCL Industries Inc.
- Constantia Flexibles GmbH
- Coveris Management GmbH
- FEDRIGONI Spa
- General Data Co. Inc.
- Gipako UAB
- Linerless
- NAStar Inc.
- Reflex Labels Ltd.
- RR Donnelley and Sons Co.
- SATO Holdings Corp.
- Skanem AS
- UPM Kymmene Corp.

