|
|
市場調査レポート
商品コード
1911213
世界の紫外線硬化型接着剤市場2026-2030年Global Uv Curable Adhesives Market 2026-2030 |
||||||
|
|||||||
カスタマイズ可能
|
|||||||

| 世界の紫外線硬化型接着剤市場2026-2030年 |
|
出版日: 2026年01月14日
発行: TechNavio
ページ情報: 英文 311 Pages
納期: 即納可能
|

概要
世界のUV硬化型接着剤市場は、2025年から2030年の間に1億3,130万米ドルの成長が見込まれ、予測期間中のCAGRは6.0%と予測されています。
本報告書では、世界のUV硬化型接着剤市場に関する包括的な分析、市場規模と予測、動向、成長要因、課題に加え、約25社のベンダー分析を提供しております。
本レポートは、現在の市場状況、最新の動向と促進要因、市場環境全般に関する最新の分析を提供します。市場は、電子機器および消費者向けデバイスの需要増加、UV硬化型接着剤における強力な接着強度と性能への需要拡大、新興市場におけるUV硬化型接着剤の需要増加によって牽引されています。
本調査は、業界の主要関係者からの情報を含む、一次情報と二次情報の客観的な組み合わせを用いて実施されました。本レポートには、主要企業の分析に加え、包括的な市場規模データ、地域別分析を伴うセグメント、ベンダー情勢が含まれています。レポートには過去データと予測データが掲載されています。
| 市場範囲 | |
|---|---|
| 基準年 | 2026年 |
| 終了年 | 2030年 |
| 予測期間 | 2026-2030 |
| 成長モメンタム | 加速 |
| 前年比2026年 | 5.6% |
| CAGR | 6% |
| 増分額 | 1億3,130万米ドル |
本調査では、今後数年間における世界のUV硬化型接着剤市場の成長を牽引する主な要因の一つとして、3Dプリンティング分野におけるUV硬化型接着剤の応用拡大を挙げております。また、UV硬化型接着剤に関する最近の動向や、カスタマイズされた製品の提供が市場において相当な需要を生み出すものと見込まれます。
目次
第1章 エグゼクティブサマリー
- 市場概要
第2章 Technavio分析
- 価格・ライフサイクル・顧客購入バスケット・採用率・購入基準の分析
- インプットの重要性と差別化の要因
- 混乱の要因
- 促進要因と課題の影響
第3章 市場情勢
- 市場エコシステム
- 市場の特徴
- バリューチェーン分析
第4章 市場規模
- 市場の定義
- 市場セグメント分析
- 市場規模 2025
- 市場の見通し 2025-2030
第5章 市場規模実績
- 世界の紫外線硬化型接着剤市場 2020-2024
- 樹脂タイプセグメント分析 2020-2024
- エンドユーザーセグメント分析 2020-2024
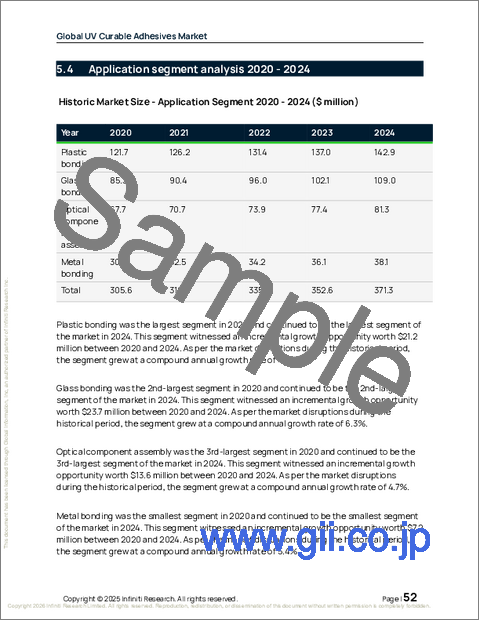
- 用途別セグメント分析 2020-2024
- 地域別セグメント分析 2020-2024
- 国別セグメント分析 2020-2024
第6章 定性分析
- AIの影響:世界の紫外線硬化型接着剤市場
第7章 ファイブフォース分析
- ファイブフォースの要約
- 買い手の交渉力
- 供給企業の交渉力
- 新規参入業者の脅威
- 代替品の脅威
- 競争の脅威
- 市況
第8章 市場セグメンテーション:樹脂タイプ別
- 市場セグメント
- 比較:樹脂タイプ別
- アクリル樹脂:市場規模と予測 2025-2030
- シアノアクリレート:市場規模と予測 2025-2030
- シリコーン:市場規模と予測 2025-2030
- その他:市場規模と予測 2025-2030
- 市場機会:樹脂タイプ別
第9章 市場セグメンテーション:エンドユーザー別
- 市場セグメント
- 比較:エンドユーザー別
- 医療:市場規模と予測 2025-2030
- 電子機器:市場規模と予測 2025-2030
- ガラス接着:市場規模と予測 2025-2030
- 包装:市場規模と予測 2025-2030
- その他:市場規模と予測 2025-2030
- 市場機会:エンドユーザー別
第10章 市場セグメンテーション:用途別
- 市場セグメント
- 比較:用途別
- プラスチック接着:市場規模と予測 2025-2030
- ガラス接着:市場規模と予測 2025-2030
- 光学部品組立:市場規模と予測 2025-2030
- 金属接着:市場規模と予測 2025-2030
- 市場機会:用途別
第11章 顧客情勢
- 顧客情勢の概要
第12章 地域別情勢
- 地域別セグメンテーション
- 地域別比較
- アジア太平洋:市場規模と予測 2025-2030
- 北米:市場規模と予測 2025-2030
- 欧州:市場規模と予測 2025-2030
- 南米:市場規模と予測 2025-2030
- 中東・アフリカ:市場規模と予測 2025-2030
- 市場機会:地域別
第13章 促進要因、課題、および機会
- 市場促進要因
- 市場の課題
- 促進要因と課題の影響
- 市場機会
第14章 競合情勢
- 概要
- 競合情勢
- 混乱の状況
- 業界のリスク
第15章 競合分析
- 企業プロファイル
- 企業ランキング指数
- 企業の市場ポジショニング
- 3M Co.
- Adhesives Research Inc.
- BASF SE
- DELO Industrie Klebstoffe GmbH
- Denka Co. Ltd.
- Dow Chemical Co.
- DSM Firmenich AG
- Dymax Corp.
- H.B. Fuller Co.
- Henkel AG and Co. KGaA
- Huntsman International LLC
- Panacol Elosol GmbH
- Permabond LLC
- Sika AG
- Toagosei Co. Ltd.

