|
|
市場調査レポート
商品コード
1341222
係留システムの世界市場 2023-2027Global Mooring Systems Market 2023-2027 |
||||||
|
|
|||||||
カスタマイズ可能
|
|||||||


| 係留システムの世界市場 2023-2027 |
|
出版日: 2023年08月07日
発行: TechNavio
ページ情報: 英文 171 Pages
納期: 即納可能
|

- 全表示
- 概要
- 図表
- 目次
係留システム市場は2022-2027年に4億4,084万米ドル、予測期間中のCAGRは4.17%で成長すると予測されています。
この調査レポートは、係留システム市場の全体分析、市場規模・予測、動向、市場促進要因・促進要因、課題、約25のベンダーを網羅したベンダー分析などを掲載しています。
現在の市場シナリオ、最新動向と促進要因、市場環境全体に関する最新分析を提供しています。世界の海洋石油・ガス探査活動の増加、洋上風力エネルギーに対する政府支援の高まり、エネルギー消費需要の増加が、石油産業における係留システムの採用を促進しています。
本調査では、今後数年間の係留システム市場成長を牽引する主な理由の一つとして、深海および超深海でのEおよびP活動の増加を挙げています。また、浮体式生産システム運用の進歩やベンダーによる製品投入の増加は、市場の大きな需要につながります。
目次
第1章 エグゼクティブサマリー
- 市場概要
第2章 市場情勢
- 市場エコシステム
第3章 市場規模
- 市場の定義
- 市場セグメント分析
- 市場規模 2022
- 市場の見通し 2022-2027
第4章 市場規模実績
- 係留システムの世界市場 2017-2021
- タイプ別セグメント分析 2017-2021
- 用途別セグメント分析 2017-2021
- 地域別セグメント分析 2017-2021
- 国別セグメント分析 2017-2021
第5章 ファイブフォース分析
- ファイブフォースの要約
- 買い手の交渉力
- 供給企業の交渉力
- 新規参入業者の脅威
- 代替品の脅威
- 競争の脅威
- 市況
第6章 市場セグメンテーション:タイプ別
- 市場セグメント
- 比較:タイプ別
- 単一ポイント:市場規模と予測 2022-2027
- スプレッド係留:市場規模と予測 2022-2027
- 動的位置決め:市場規模と予測 2022-2027
- その他:市場規模と予測 2022-2027
- 市場機会:タイプ別
第7章 市場セグメンテーション:用途別
- 市場セグメント
- 比較:用途別
- テンションレッグプラットフォーム:市場規模と予測 2022-2027
- FPSO:市場規模と予測 2022-2027
- 半潜水型:市場規模と予測 2022-2027
- SPAR:市場規模と予測 2022-2027
- その他:市場規模と予測 2022-2027
- 市場機会:用途別
第8章 顧客情勢
- 顧客情勢の概要
第9章 地域別情勢
- 地域別セグメンテーション
- 地域別比較
- アジア太平洋:市場規模と予測 2022-2027
- 北米:市場規模と予測 2022-2027
- 欧州:市場規模と予測 2022-2027
- 中東・アフリカ:市場規模と予測 2022-2027
- 南米:市場規模と予測 2022-2027
- 米国:市場規模と予測 2022-2027
- 中国:市場規模と予測 2022-2027
- 日本:市場規模と予測 2022-2027
- ドイツ:市場規模と予測 2022-2027
- 英国:市場規模と予測 2022-2027
- 市場機会:地域別
第10章 促進要因、課題、および動向
- 市場促進要因
- 市場の課題
- 促進要因と課題の影響
- 市場動向
第11章 ベンダー情勢
- 概要
- ベンダー情勢
- 混乱の状況
- 業界のリスク
第12章 ベンダー分析
- 対象ベンダー
- ベンダーの市場ポジショニング
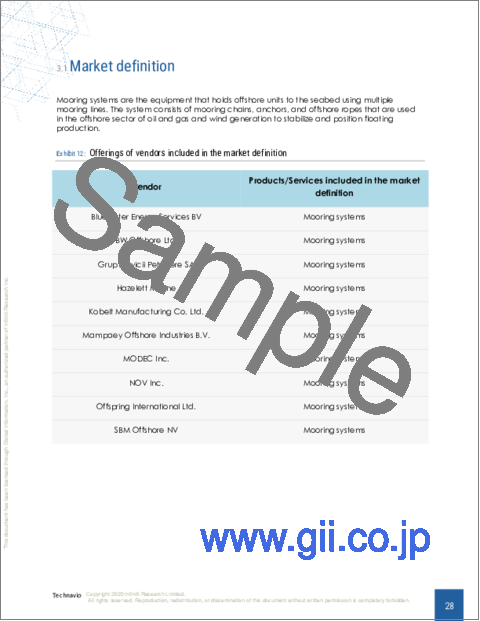
- Bluewater Energy Services BV
- BW Offshore Ltd.
- Grup Servicii Petroliere SA
- Hazelett Marine
- Kobelt Manufacturing Co. Ltd.
- Mampaey Offshore Industries B.V.
- MODEC Inc.
- NOV Inc.
- Offspring International Ltd.
- Qingdao Waysail Ocean Technology Co. Ltd.
- SBM Offshore NV
- Timberland Equipment Ltd.
- Trelleborg AB
- Vryhof
- Whittaker Engineering Stonehaven Ltd.
第13章 付録
Exhibits:
- Exhibits1: Executive Summary - Chart on Market Overview
- Exhibits2: Executive Summary - Data Table on Market Overview
- Exhibits3: Executive Summary - Chart on Global Market Characteristics
- Exhibits4: Executive Summary - Chart on Market by Geography
- Exhibits5: Executive Summary - Chart on Market Segmentation by Type
- Exhibits6: Executive Summary - Chart on Market Segmentation by Application
- Exhibits7: Executive Summary - Chart on Incremental Growth
- Exhibits8: Executive Summary - Data Table on Incremental Growth
- Exhibits9: Executive Summary - Chart on Vendor Market Positioning
- Exhibits10: Parent market
- Exhibits11: Market Characteristics
- Exhibits12: Offerings of vendors included in the market definition
- Exhibits13: Market segments
- Exhibits14: Chart on Global - Market size and forecast 2022-2027 ($ million)
- Exhibits15: Data Table on Global - Market size and forecast 2022-2027 ($ million)
- Exhibits16: Chart on Global Market: Year-over-year growth 2022-2027 (%)
- Exhibits17: Data Table on Global Market: Year-over-year growth 2022-2027 (%)
- Exhibits18: Historic Market Size - Data Table on global mooring systems market 2017 - 2021 ($ million)
- Exhibits19: Historic Market Size - Type Segment 2017 - 2021 ($ million)
- Exhibits20: Historic Market Size - Application Segment 2017 - 2021 ($ million)
- Exhibits21: Historic Market Size - Geography Segment 2017 - 2021 ($ million)
- Exhibits22: Historic Market Size - Country Segment 2017 - 2021 ($ million)
- Exhibits23: Five forces analysis - Comparison between 2022 and 2027
- Exhibits24: Chart on Bargaining power of buyers - Impact of key factors 2022 and 2027
- Exhibits25: Bargaining power of suppliers - Impact of key factors in 2022 and 2027
- Exhibits26: Threat of new entrants - Impact of key factors in 2022 and 2027
- Exhibits27: Threat of substitutes - Impact of key factors in 2022 and 2027
- Exhibits28: Threat of rivalry - Impact of key factors in 2022 and 2027
- Exhibits29: Chart on Market condition - Five forces 2022 and 2027
- Exhibits30: Chart on Type - Market share 2022-2027 (%)
- Exhibits31: Data Table on Type - Market share 2022-2027 (%)
- Exhibits32: Chart on Comparison by Type
- Exhibits33: Data Table on Comparison by Type
- Exhibits34: Chart on Single point - Market size and forecast 2022-2027 ($ million)
- Exhibits35: Data Table on Single point - Market size and forecast 2022-2027 ($ million)
- Exhibits36: Chart on Single point - Year-over-year growth 2022-2027 (%)
- Exhibits37: Data Table on Single point - Year-over-year growth 2022-2027 (%)
- Exhibits38: Chart on Spread mooring - Market size and forecast 2022-2027 ($ million)
- Exhibits39: Data Table on Spread mooring - Market size and forecast 2022-2027 ($ million)
- Exhibits40: Chart on Spread mooring - Year-over-year growth 2022-2027 (%)
- Exhibits41: Data Table on Spread mooring - Year-over-year growth 2022-2027 (%)
- Exhibits42: Chart on Dynamic positioning - Market size and forecast 2022-2027 ($ million)
- Exhibits43: Data Table on Dynamic positioning - Market size and forecast 2022-2027 ($ million)
- Exhibits44: Chart on Dynamic positioning - Year-over-year growth 2022-2027 (%)
- Exhibits45: Data Table on Dynamic positioning - Year-over-year growth 2022-2027 (%)
- Exhibits46: Chart on Others - Market size and forecast 2022-2027 ($ million)
- Exhibits47: Data Table on Others - Market size and forecast 2022-2027 ($ million)
- Exhibits48: Chart on Others - Year-over-year growth 2022-2027 (%)
- Exhibits49: Data Table on Others - Year-over-year growth 2022-2027 (%)
- Exhibits50: Market opportunity by Type ($ million)
- Exhibits51: Data Table on Market opportunity by Type ($ million)
- Exhibits52: Chart on Application - Market share 2022-2027 (%)
- Exhibits53: Data Table on Application - Market share 2022-2027 (%)
- Exhibits54: Chart on Comparison by Application
- Exhibits55: Data Table on Comparison by Application
- Exhibits56: Chart on Tension leg platform - Market size and forecast 2022-2027 ($ million)
- Exhibits57: Data Table on Tension leg platform - Market size and forecast 2022-2027 ($ million)
- Exhibits58: Chart on Tension leg platform - Year-over-year growth 2022-2027 (%)
- Exhibits59: Data Table on Tension leg platform - Year-over-year growth 2022-2027 (%)
- Exhibits60: Chart on FPSO - Market size and forecast 2022-2027 ($ million)
- Exhibits61: Data Table on FPSO - Market size and forecast 2022-2027 ($ million)
- Exhibits62: Chart on FPSO - Year-over-year growth 2022-2027 (%)
- Exhibits63: Data Table on FPSO - Year-over-year growth 2022-2027 (%)
- Exhibits64: Chart on Semi-submersible - Market size and forecast 2022-2027 ($ million)
- Exhibits65: Data Table on Semi-submersible - Market size and forecast 2022-2027 ($ million)
- Exhibits66: Chart on Semi-submersible - Year-over-year growth 2022-2027 (%)
- Exhibits67: Data Table on Semi-submersible - Year-over-year growth 2022-2027 (%)
- Exhibits68: Chart on SPAR - Market size and forecast 2022-2027 ($ million)
- Exhibits69: Data Table on SPAR - Market size and forecast 2022-2027 ($ million)
- Exhibits70: Chart on SPAR - Year-over-year growth 2022-2027 (%)
- Exhibits71: Data Table on SPAR - Year-over-year growth 2022-2027 (%)
- Exhibits72: Chart on Others - Market size and forecast 2022-2027 ($ million)
- Exhibits73: Data Table on Others - Market size and forecast 2022-2027 ($ million)
- Exhibits74: Chart on Others - Year-over-year growth 2022-2027 (%)
- Exhibits75: Data Table on Others - Year-over-year growth 2022-2027 (%)
- Exhibits76: Market opportunity by Application ($ million)
- Exhibits77: Data Table on Market opportunity by Application ($ million)
- Exhibits78: Analysis of price sensitivity, lifecycle, customer purchase basket, adoption rates, and purchase criteria
- Exhibits79: Chart on Market share by geography 2022-2027 (%)
- Exhibits80: Data Table on Market share by geography 2022-2027 (%)
- Exhibits81: Chart on Geographic comparison
- Exhibits82: Data Table on Geographic comparison
- Exhibits83: Chart on APAC - Market size and forecast 2022-2027 ($ million)
- Exhibits84: Data Table on APAC - Market size and forecast 2022-2027 ($ million)
- Exhibits85: Chart on APAC - Year-over-year growth 2022-2027 (%)
- Exhibits86: Data Table on APAC - Year-over-year growth 2022-2027 (%)
- Exhibits87: Chart on North America - Market size and forecast 2022-2027 ($ million)
- Exhibits88: Data Table on North America - Market size and forecast 2022-2027 ($ million)
- Exhibits89: Chart on North America - Year-over-year growth 2022-2027 (%)
- Exhibits90: Data Table on North America - Year-over-year growth 2022-2027 (%)
- Exhibits91: Chart on Europe - Market size and forecast 2022-2027 ($ million)
- Exhibits92: Data Table on Europe - Market size and forecast 2022-2027 ($ million)
- Exhibits93: Chart on Europe - Year-over-year growth 2022-2027 (%)
- Exhibits94: Data Table on Europe - Year-over-year growth 2022-2027 (%)
- Exhibits95: Chart on Middle East and Africa - Market size and forecast 2022-2027 ($ million)
- Exhibits96: Data Table on Middle East and Africa - Market size and forecast 2022-2027 ($ million)
- Exhibits97: Chart on Middle East and Africa - Year-over-year growth 2022-2027 (%)
- Exhibits98: Data Table on Middle East and Africa - Year-over-year growth 2022-2027 (%)
- Exhibits99: Chart on South America - Market size and forecast 2022-2027 ($ million)
- Exhibits100: Data Table on South America - Market size and forecast 2022-2027 ($ million)
- Exhibits101: Chart on South America - Year-over-year growth 2022-2027 (%)
- Exhibits102: Data Table on South America - Year-over-year growth 2022-2027 (%)
- Exhibits103: Chart on US - Market size and forecast 2022-2027 ($ million)
- Exhibits104: Data Table on US - Market size and forecast 2022-2027 ($ million)
- Exhibits105: Chart on US - Year-over-year growth 2022-2027 (%)
- Exhibits106: Data Table on US - Year-over-year growth 2022-2027 (%)
- Exhibits107: Chart on China - Market size and forecast 2022-2027 ($ million)
- Exhibits108: Data Table on China - Market size and forecast 2022-2027 ($ million)
- Exhibits109: Chart on China - Year-over-year growth 2022-2027 (%)
- Exhibits110: Data Table on China - Year-over-year growth 2022-2027 (%)
- Exhibits111: Chart on Japan - Market size and forecast 2022-2027 ($ million)
- Exhibits112: Data Table on Japan - Market size and forecast 2022-2027 ($ million)
- Exhibits113: Chart on Japan - Year-over-year growth 2022-2027 (%)
- Exhibits114: Data Table on Japan - Year-over-year growth 2022-2027 (%)
- Exhibits115: Chart on Germany - Market size and forecast 2022-2027 ($ million)
- Exhibits116: Data Table on Germany - Market size and forecast 2022-2027 ($ million)
- Exhibits117: Chart on Germany - Year-over-year growth 2022-2027 (%)
- Exhibits118: Data Table on Germany - Year-over-year growth 2022-2027 (%)
- Exhibits119: Chart on UK - Market size and forecast 2022-2027 ($ million)
- Exhibits120: Data Table on UK - Market size and forecast 2022-2027 ($ million)
- Exhibits121: Chart on UK - Year-over-year growth 2022-2027 (%)
- Exhibits122: Data Table on UK - Year-over-year growth 2022-2027 (%)
- Exhibits123: Market opportunity by geography ($ million)
- Exhibits124: Data Tables on Market opportunity by geography ($ million)
- Exhibits125: Impact of drivers and challenges in 2022 and 2027
- Exhibits126: Overview on Criticality of inputs and Factors of differentiation
- Exhibits127: Overview on factors of disruption
- Exhibits128: Impact of key risks on business
- Exhibits129: Vendors covered
- Exhibits130: Matrix on vendor position and classification
- Exhibits131: Bluewater Energy Services BV - Overview
- Exhibits132: Bluewater Energy Services BV - Product / Service
- Exhibits133: Bluewater Energy Services BV - Key offerings
- Exhibits134: BW Offshore Ltd. - Overview
- Exhibits135: BW Offshore Ltd. - Business segments
- Exhibits136: BW Offshore Ltd. - Key offerings
- Exhibits137: BW Offshore Ltd. - Segment focus
- Exhibits138: Grup Servicii Petroliere SA - Overview
- Exhibits139: Grup Servicii Petroliere SA - Product / Service
- Exhibits140: Grup Servicii Petroliere SA - Key offerings
- Exhibits141: Hazelett Marine - Overview
- Exhibits142: Hazelett Marine - Product / Service
- Exhibits143: Hazelett Marine - Key offerings
- Exhibits144: Kobelt Manufacturing Co. Ltd. - Overview
- Exhibits145: Kobelt Manufacturing Co. Ltd. - Product / Service
- Exhibits146: Kobelt Manufacturing Co. Ltd. - Key offerings
- Exhibits147: Mampaey Offshore Industries B.V. - Overview
- Exhibits148: Mampaey Offshore Industries B.V. - Product / Service
- Exhibits149: Mampaey Offshore Industries B.V. - Key offerings
- Exhibits150: MODEC Inc. - Overview
- Exhibits151: MODEC Inc. - Product / Service
- Exhibits152: MODEC Inc. - Key offerings
- Exhibits153: NOV Inc. - Overview
- Exhibits154: NOV Inc. - Business segments
- Exhibits155: NOV Inc. - Key offerings
- Exhibits156: NOV Inc. - Segment focus
- Exhibits157: Offspring International Ltd. - Overview
- Exhibits158: Offspring International Ltd. - Product / Service
- Exhibits159: Offspring International Ltd. - Key offerings
- Exhibits160: Qingdao Waysail Ocean Technology Co. Ltd. - Overview
- Exhibits161: Qingdao Waysail Ocean Technology Co. Ltd. - Product / Service
- Exhibits162: Qingdao Waysail Ocean Technology Co. Ltd. - Key offerings
- Exhibits163: SBM Offshore NV - Overview
- Exhibits164: SBM Offshore NV - Business segments
- Exhibits165: SBM Offshore NV - Key offerings
- Exhibits166: SBM Offshore NV - Segment focus
- Exhibits167: Timberland Equipment Ltd. - Overview
- Exhibits168: Timberland Equipment Ltd. - Product / Service
- Exhibits169: Timberland Equipment Ltd. - Key offerings
- Exhibits170: Trelleborg AB - Overview
- Exhibits171: Trelleborg AB - Business segments
- Exhibits172: Trelleborg AB - Key news
- Exhibits173: Trelleborg AB - Key offerings
- Exhibits174: Trelleborg AB - Segment focus
- Exhibits175: Vryhof - Overview
- Exhibits176: Vryhof - Product / Service
- Exhibits177: Vryhof - Key offerings
- Exhibits178: Whittaker Engineering Stonehaven Ltd. - Overview
- Exhibits179: Whittaker Engineering Stonehaven Ltd. - Product / Service
- Exhibits180: Whittaker Engineering Stonehaven Ltd. - Key offerings
- Exhibits181: Inclusions checklist
- Exhibits182: Exclusions checklist
- Exhibits183: Currency conversion rates for US$
- Exhibits184: Research methodology
- Exhibits185: Validation techniques employed for market sizing
- Exhibits186: Information sources
- Exhibits187: List of abbreviations
The mooring systems market is forecasted to grow by USD 440.84 mn during 2022-2027, accelerating at a CAGR of 4.17% during the forecast period. The report on the mooring systems market provides a holistic analysis, market size and forecast, trends, growth drivers, and challenges, as well as vendor analysis covering around 25 vendors.
The report offers an up-to-date analysis regarding the current market scenario, the latest trends and drivers, and the overall market environment. The market is driven by increase in global offshore oil and gas exploration activities, rising government support for offshore wind energy, and increase in demand for energy consumption is driving adoption of mooring systems in oil industry.
Technavio's mooring systems market is segmented as below:
By Type
- Spread mooring
- Single point
- Dynamic positioning
- Others
By Application
- Tension leg platform
- FPSO
- Semi-submersible
- SPAR
- Others
By Geography
- APAC
- North America
- Europe
- Middle East and Africa
- South America
This study identifies the rise in deepwater and ultra-deep-water e and p activities as one of the prime reasons driving the mooring systems market growth during the next few years. Also, advances in floatation production system operation and growing product launches by vendors will lead to sizable demand in the market.
The report on the mooring systems market covers the following areas:
- Mooring systems market sizing
- Mooring systems market forecast
- Mooring systems market industry analysis
The robust vendor analysis is designed to help clients improve their market position, and in line with this, this report provides a detailed analysis of several leading mooring systems market vendors that include Acteon Group Ltd., Anchor Industries PTY Ltd., Bluewater Energy Services BV, BW Offshore Ltd., Cargotec Corp., Grup Servicii Petroliere SA, Hazelett Marine, Kobelt Manufacturing Co. Ltd., Mampaey Offshore Industries B.V., MODEC Inc., Mooring Systems Inc., NOV Inc., Offspring International Ltd., Qingdao Waysail Ocean Technology Co. Ltd., SBM Offshore NV, SOFEC Inc., Timberland Equipment Ltd., Trelleborg AB, Vryhof, and Whittaker Engineering Stonehaven Ltd.. Also, the mooring systems market analysis report includes information on upcoming trends and challenges that will influence market growth. This is to help companies strategize and leverage all forthcoming growth opportunities.
The study was conducted using an objective combination of primary and secondary information including inputs from key participants in the industry. The report contains a comprehensive market and vendor landscape in addition to an analysis of the key vendors.
The publisher presents a detailed picture of the market by the way of study, synthesis, and summation of data from multiple sources by an analysis of key parameters such as profit, pricing, competition, and promotions. It presents various market facets by identifying the key industry influencers. The data presented is comprehensive, reliable, and a result of extensive research - both primary and secondary. The market research reports provide a complete competitive landscape and an in-depth vendor selection methodology and analysis using qualitative and quantitative research to forecast the accurate market growth.
Table of Contents
1 Executive Summary
- 1.1 Market overview
- Exhibit 01: Executive Summary - Chart on Market Overview
- Exhibit 02: Executive Summary - Data Table on Market Overview
- Exhibit 03: Executive Summary - Chart on Global Market Characteristics
- Exhibit 04: Executive Summary - Chart on Market by Geography
- Exhibit 05: Executive Summary - Chart on Market Segmentation by Type
- Exhibit 06: Executive Summary - Chart on Market Segmentation by Application
- Exhibit 07: Executive Summary - Chart on Incremental Growth
- Exhibit 08: Executive Summary - Data Table on Incremental Growth
- Exhibit 09: Executive Summary - Chart on Vendor Market Positioning
2 Market Landscape
- 2.1 Market ecosystem
- Exhibit 10: Parent market
- Exhibit 11: Market Characteristics
3 Market Sizing
- 3.1 Market definition
- Exhibit 12: Offerings of vendors included in the market definition
- 3.2 Market segment analysis
- Exhibit 13: Market segments
- 3.3 Market size 2022
- 3.4 Market outlook: Forecast for 2022-2027
- Exhibit 14: Chart on Global - Market size and forecast 2022-2027 ($ million)
- Exhibit 15: Data Table on Global - Market size and forecast 2022-2027 ($ million)
- Exhibit 16: Chart on Global Market: Year-over-year growth 2022-2027 (%)
- Exhibit 17: Data Table on Global Market: Year-over-year growth 2022-2027 (%)
4 Historic Market Size
- 4.1 Global mooring systems market 2017 - 2021
- Exhibit 18: Historic Market Size - Data Table on global mooring systems market 2017 - 2021 ($ million)
- 4.2 Type Segment Analysis 2017 - 2021
- Exhibit 19: Historic Market Size - Type Segment 2017 - 2021 ($ million)
- 4.3 Application Segment Analysis 2017 - 2021
- Exhibit 20: Historic Market Size - Application Segment 2017 - 2021 ($ million)
- 4.4 Geography Segment Analysis 2017 - 2021
- Exhibit 21: Historic Market Size - Geography Segment 2017 - 2021 ($ million)
- 4.5 Country Segment Analysis 2017 - 2021
- Exhibit 22: Historic Market Size - Country Segment 2017 - 2021 ($ million)
5 Five Forces Analysis
- 5.1 Five forces summary
- Exhibit 23: Five forces analysis - Comparison between 2022 and 2027
- 5.2 Bargaining power of buyers
- Exhibit 24: Chart on Bargaining power of buyers - Impact of key factors 2022 and 2027
- 5.3 Bargaining power of suppliers
- Exhibit 25: Bargaining power of suppliers - Impact of key factors in 2022 and 2027
- 5.4 Threat of new entrants
- Exhibit 26: Threat of new entrants - Impact of key factors in 2022 and 2027
- 5.5 Threat of substitutes
- Exhibit 27: Threat of substitutes - Impact of key factors in 2022 and 2027
- 5.6 Threat of rivalry
- Exhibit 28: Threat of rivalry - Impact of key factors in 2022 and 2027
- 5.7 Market condition
- Exhibit 29: Chart on Market condition - Five forces 2022 and 2027
6 Market Segmentation by Type
- 6.1 Market segments
- Exhibit 30: Chart on Type - Market share 2022-2027 (%)
- Exhibit 31: Data Table on Type - Market share 2022-2027 (%)
- 6.2 Comparison by Type
- Exhibit 32: Chart on Comparison by Type
- Exhibit 33: Data Table on Comparison by Type
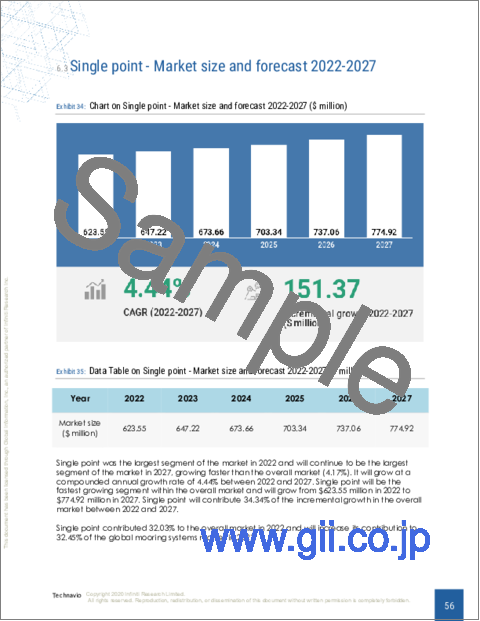
- 6.3 Single point - Market size and forecast 2022-2027
- Exhibit 34: Chart on Single point - Market size and forecast 2022-2027 ($ million)
- Exhibit 35: Data Table on Single point - Market size and forecast 2022-2027 ($ million)
- Exhibit 36: Chart on Single point - Year-over-year growth 2022-2027 (%)
- Exhibit 37: Data Table on Single point - Year-over-year growth 2022-2027 (%)
- 6.4 Spread mooring - Market size and forecast 2022-2027
- Exhibit 38: Chart on Spread mooring - Market size and forecast 2022-2027 ($ million)
- Exhibit 39: Data Table on Spread mooring - Market size and forecast 2022-2027 ($ million)
- Exhibit 40: Chart on Spread mooring - Year-over-year growth 2022-2027 (%)
- Exhibit 41: Data Table on Spread mooring - Year-over-year growth 2022-2027 (%)
- 6.5 Dynamic positioning - Market size and forecast 2022-2027
- Exhibit 42: Chart on Dynamic positioning - Market size and forecast 2022-2027 ($ million)
- Exhibit 43: Data Table on Dynamic positioning - Market size and forecast 2022-2027 ($ million)
- Exhibit 44: Chart on Dynamic positioning - Year-over-year growth 2022-2027 (%)
- Exhibit 45: Data Table on Dynamic positioning - Year-over-year growth 2022-2027 (%)
- 6.6 Others - Market size and forecast 2022-2027
- Exhibit 46: Chart on Others - Market size and forecast 2022-2027 ($ million)
- Exhibit 47: Data Table on Others - Market size and forecast 2022-2027 ($ million)
- Exhibit 48: Chart on Others - Year-over-year growth 2022-2027 (%)
- Exhibit 49: Data Table on Others - Year-over-year growth 2022-2027 (%)
- 6.7 Market opportunity by Type
- Exhibit 50: Market opportunity by Type ($ million)
- Exhibit 51: Data Table on Market opportunity by Type ($ million)
7 Market Segmentation by Application
- 7.1 Market segments
- Exhibit 52: Chart on Application - Market share 2022-2027 (%)
- Exhibit 53: Data Table on Application - Market share 2022-2027 (%)
- 7.2 Comparison by Application
- Exhibit 54: Chart on Comparison by Application
- Exhibit 55: Data Table on Comparison by Application
- 7.3 Tension leg platform - Market size and forecast 2022-2027
- Exhibit 56: Chart on Tension leg platform - Market size and forecast 2022-2027 ($ million)
- Exhibit 57: Data Table on Tension leg platform - Market size and forecast 2022-2027 ($ million)
- Exhibit 58: Chart on Tension leg platform - Year-over-year growth 2022-2027 (%)
- Exhibit 59: Data Table on Tension leg platform - Year-over-year growth 2022-2027 (%)
- 7.4 FPSO - Market size and forecast 2022-2027
- Exhibit 60: Chart on FPSO - Market size and forecast 2022-2027 ($ million)
- Exhibit 61: Data Table on FPSO - Market size and forecast 2022-2027 ($ million)
- Exhibit 62: Chart on FPSO - Year-over-year growth 2022-2027 (%)
- Exhibit 63: Data Table on FPSO - Year-over-year growth 2022-2027 (%)
- 7.5 Semi-submersible - Market size and forecast 2022-2027
- Exhibit 64: Chart on Semi-submersible - Market size and forecast 2022-2027 ($ million)
- Exhibit 65: Data Table on Semi-submersible - Market size and forecast 2022-2027 ($ million)
- Exhibit 66: Chart on Semi-submersible - Year-over-year growth 2022-2027 (%)
- Exhibit 67: Data Table on Semi-submersible - Year-over-year growth 2022-2027 (%)
- 7.6 SPAR - Market size and forecast 2022-2027
- Exhibit 68: Chart on SPAR - Market size and forecast 2022-2027 ($ million)
- Exhibit 69: Data Table on SPAR - Market size and forecast 2022-2027 ($ million)
- Exhibit 70: Chart on SPAR - Year-over-year growth 2022-2027 (%)
- Exhibit 71: Data Table on SPAR - Year-over-year growth 2022-2027 (%)
- 7.7 Others - Market size and forecast 2022-2027
- Exhibit 72: Chart on Others - Market size and forecast 2022-2027 ($ million)
- Exhibit 73: Data Table on Others - Market size and forecast 2022-2027 ($ million)
- Exhibit 74: Chart on Others - Year-over-year growth 2022-2027 (%)
- Exhibit 75: Data Table on Others - Year-over-year growth 2022-2027 (%)
- 7.8 Market opportunity by Application
- Exhibit 76: Market opportunity by Application ($ million)
- Exhibit 77: Data Table on Market opportunity by Application ($ million)
8 Customer Landscape
- 8.1 Customer landscape overview
- Exhibit 78: Analysis of price sensitivity, lifecycle, customer purchase basket, adoption rates, and purchase criteria
9 Geographic Landscape
- 9.1 Geographic segmentation
- Exhibit 79: Chart on Market share by geography 2022-2027 (%)
- Exhibit 80: Data Table on Market share by geography 2022-2027 (%)
- 9.2 Geographic comparison
- Exhibit 81: Chart on Geographic comparison
- Exhibit 82: Data Table on Geographic comparison
- 9.3 APAC - Market size and forecast 2022-2027
- Exhibit 83: Chart on APAC - Market size and forecast 2022-2027 ($ million)
- Exhibit 84: Data Table on APAC - Market size and forecast 2022-2027 ($ million)
- Exhibit 85: Chart on APAC - Year-over-year growth 2022-2027 (%)
- Exhibit 86: Data Table on APAC - Year-over-year growth 2022-2027 (%)
- 9.4 North America - Market size and forecast 2022-2027
- Exhibit 87: Chart on North America - Market size and forecast 2022-2027 ($ million)
- Exhibit 88: Data Table on North America - Market size and forecast 2022-2027 ($ million)
- Exhibit 89: Chart on North America - Year-over-year growth 2022-2027 (%)
- Exhibit 90: Data Table on North America - Year-over-year growth 2022-2027 (%)
- 9.5 Europe - Market size and forecast 2022-2027
- Exhibit 91: Chart on Europe - Market size and forecast 2022-2027 ($ million)
- Exhibit 92: Data Table on Europe - Market size and forecast 2022-2027 ($ million)
- Exhibit 93: Chart on Europe - Year-over-year growth 2022-2027 (%)
- Exhibit 94: Data Table on Europe - Year-over-year growth 2022-2027 (%)
- 9.6 Middle East and Africa - Market size and forecast 2022-2027
- Exhibit 95: Chart on Middle East and Africa - Market size and forecast 2022-2027 ($ million)
- Exhibit 96: Data Table on Middle East and Africa - Market size and forecast 2022-2027 ($ million)
- Exhibit 97: Chart on Middle East and Africa - Year-over-year growth 2022-2027 (%)
- Exhibit 98: Data Table on Middle East and Africa - Year-over-year growth 2022-2027 (%)
- 9.7 South America - Market size and forecast 2022-2027
- Exhibit 99: Chart on South America - Market size and forecast 2022-2027 ($ million)
- Exhibit 100: Data Table on South America - Market size and forecast 2022-2027 ($ million)
- Exhibit 101: Chart on South America - Year-over-year growth 2022-2027 (%)
- Exhibit 102: Data Table on South America - Year-over-year growth 2022-2027 (%)
- 9.8 US - Market size and forecast 2022-2027
- Exhibit 103: Chart on US - Market size and forecast 2022-2027 ($ million)
- Exhibit 104: Data Table on US - Market size and forecast 2022-2027 ($ million)
- Exhibit 105: Chart on US - Year-over-year growth 2022-2027 (%)
- Exhibit 106: Data Table on US - Year-over-year growth 2022-2027 (%)
- 9.9 China - Market size and forecast 2022-2027
- Exhibit 107: Chart on China - Market size and forecast 2022-2027 ($ million)
- Exhibit 108: Data Table on China - Market size and forecast 2022-2027 ($ million)
- Exhibit 109: Chart on China - Year-over-year growth 2022-2027 (%)
- Exhibit 110: Data Table on China - Year-over-year growth 2022-2027 (%)
- 9.10 Japan - Market size and forecast 2022-2027
- Exhibit 111: Chart on Japan - Market size and forecast 2022-2027 ($ million)
- Exhibit 112: Data Table on Japan - Market size and forecast 2022-2027 ($ million)
- Exhibit 113: Chart on Japan - Year-over-year growth 2022-2027 (%)
- Exhibit 114: Data Table on Japan - Year-over-year growth 2022-2027 (%)
- 9.11 Germany - Market size and forecast 2022-2027
- Exhibit 115: Chart on Germany - Market size and forecast 2022-2027 ($ million)
- Exhibit 116: Data Table on Germany - Market size and forecast 2022-2027 ($ million)
- Exhibit 117: Chart on Germany - Year-over-year growth 2022-2027 (%)
- Exhibit 118: Data Table on Germany - Year-over-year growth 2022-2027 (%)
- 9.12 UK - Market size and forecast 2022-2027
- Exhibit 119: Chart on UK - Market size and forecast 2022-2027 ($ million)
- Exhibit 120: Data Table on UK - Market size and forecast 2022-2027 ($ million)
- Exhibit 121: Chart on UK - Year-over-year growth 2022-2027 (%)
- Exhibit 122: Data Table on UK - Year-over-year growth 2022-2027 (%)
- 9.13 Market opportunity by geography
- Exhibit 123: Market opportunity by geography ($ million)
- Exhibit 124: Data Tables on Market opportunity by geography ($ million)
10 Drivers, Challenges, and Trends
- 10.1 Market drivers
- 10.2 Market challenges
- 10.3 Impact of drivers and challenges
- Exhibit 125: Impact of drivers and challenges in 2022 and 2027
- 10.4 Market trends
11 Vendor Landscape
- 11.1 Overview
- 11.2 Vendor landscape
- Exhibit 126: Overview on Criticality of inputs and Factors of differentiation
- 11.3 Landscape disruption
- Exhibit 127: Overview on factors of disruption
- 11.4 Industry risks
- Exhibit 128: Impact of key risks on business
12 Vendor Analysis
- 12.1 Vendors covered
- Exhibit 129: Vendors covered
- 12.2 Market positioning of vendors
- Exhibit 130: Matrix on vendor position and classification
- 12.3 Bluewater Energy Services BV
- Exhibit 131: Bluewater Energy Services BV - Overview
- Exhibit 132: Bluewater Energy Services BV - Product / Service
- Exhibit 133: Bluewater Energy Services BV - Key offerings
- 12.4 BW Offshore Ltd.
- Exhibit 134: BW Offshore Ltd. - Overview
- Exhibit 135: BW Offshore Ltd. - Business segments
- Exhibit 136: BW Offshore Ltd. - Key offerings
- Exhibit 137: BW Offshore Ltd. - Segment focus
- 12.5 Grup Servicii Petroliere SA
- Exhibit 138: Grup Servicii Petroliere SA - Overview
- Exhibit 139: Grup Servicii Petroliere SA - Product / Service
- Exhibit 140: Grup Servicii Petroliere SA - Key offerings
- 12.6 Hazelett Marine
- Exhibit 141: Hazelett Marine - Overview
- Exhibit 142: Hazelett Marine - Product / Service
- Exhibit 143: Hazelett Marine - Key offerings
- 12.7 Kobelt Manufacturing Co. Ltd.
- Exhibit 144: Kobelt Manufacturing Co. Ltd. - Overview
- Exhibit 145: Kobelt Manufacturing Co. Ltd. - Product / Service
- Exhibit 146: Kobelt Manufacturing Co. Ltd. - Key offerings
- 12.8 Mampaey Offshore Industries B.V.
- Exhibit 147: Mampaey Offshore Industries B.V. - Overview
- Exhibit 148: Mampaey Offshore Industries B.V. - Product / Service
- Exhibit 149: Mampaey Offshore Industries B.V. - Key offerings
- 12.9 MODEC Inc.
- Exhibit 150: MODEC Inc. - Overview
- Exhibit 151: MODEC Inc. - Product / Service
- Exhibit 152: MODEC Inc. - Key offerings
- 12.10 NOV Inc.
- Exhibit 153: NOV Inc. - Overview
- Exhibit 154: NOV Inc. - Business segments
- Exhibit 155: NOV Inc. - Key offerings
- Exhibit 156: NOV Inc. - Segment focus
- 12.11 Offspring International Ltd.
- Exhibit 157: Offspring International Ltd. - Overview
- Exhibit 158: Offspring International Ltd. - Product / Service
- Exhibit 159: Offspring International Ltd. - Key offerings
- 12.12 Qingdao Waysail Ocean Technology Co. Ltd.
- Exhibit 160: Qingdao Waysail Ocean Technology Co. Ltd. - Overview
- Exhibit 161: Qingdao Waysail Ocean Technology Co. Ltd. - Product / Service
- Exhibit 162: Qingdao Waysail Ocean Technology Co. Ltd. - Key offerings
- 12.13 SBM Offshore NV
- Exhibit 163: SBM Offshore NV - Overview
- Exhibit 164: SBM Offshore NV - Business segments
- Exhibit 165: SBM Offshore NV - Key offerings
- Exhibit 166: SBM Offshore NV - Segment focus
- 12.14 Timberland Equipment Ltd.
- Exhibit 167: Timberland Equipment Ltd. - Overview
- Exhibit 168: Timberland Equipment Ltd. - Product / Service
- Exhibit 169: Timberland Equipment Ltd. - Key offerings
- 12.15 Trelleborg AB
- Exhibit 170: Trelleborg AB - Overview
- Exhibit 171: Trelleborg AB - Business segments
- Exhibit 172: Trelleborg AB - Key news
- Exhibit 173: Trelleborg AB - Key offerings
- Exhibit 174: Trelleborg AB - Segment focus
- 12.16 Vryhof
- Exhibit 175: Vryhof - Overview
- Exhibit 176: Vryhof - Product / Service
- Exhibit 177: Vryhof - Key offerings
- 12.17 Whittaker Engineering Stonehaven Ltd.
- Exhibit 178: Whittaker Engineering Stonehaven Ltd. - Overview
- Exhibit 179: Whittaker Engineering Stonehaven Ltd. - Product / Service
- Exhibit 180: Whittaker Engineering Stonehaven Ltd. - Key offerings
13 Appendix
- 13.1 Scope of the report
- 13.2 Inclusions and exclusions checklist
- Exhibit 181: Inclusions checklist
- Exhibit 182: Exclusions checklist
- 13.3 Currency conversion rates for US$
- Exhibit 183: Currency conversion rates for US$
- 13.4 Research methodology
- Exhibit 184: Research methodology
- Exhibit 185: Validation techniques employed for market sizing
- Exhibit 186: Information sources
- 13.5 List of abbreviations
- Exhibit 187: List of abbreviations
