|
|
市場調査レポート
商品コード
1517279
食品保存容器の世界市場 2024-2028Global food storage container market 2024-2028 |
||||||
|
|||||||
カスタマイズ可能
|
|||||||


| 食品保存容器の世界市場 2024-2028 |
|
出版日: 2024年07月03日
発行: TechNavio
ページ情報: 英文 161 Pages
納期: 即納可能
|

全表示
- 概要
- 図表
- 目次
食品保存容器市場は2023年から2028年にかけて100億米ドル成長し、予測期間中のCAGRは2.58%と予測されています。
当レポートでは、食品保存容器市場の全体的な分析、市場規模・予測、動向、成長促進要因、課題、約25のベンダーを網羅したベンダー分析などを掲載しています。
現在の市場シナリオ、最新動向と促進要因、市場環境全体に関する最新分析を提供しています。市場は、耐久性があり軽量な容器への嗜好の高まり、二次汚染を回避するための食品の賞味期限延長、臭いや汚れに強い保存容器への需要の高まりによって牽引されています。
| 市場範囲 | |
|---|---|
| 基準年 | 2024 |
| 終了年 | 2028 |
| 予測期間 | 2024-2028 |
| 成長モメンタム | 加速 |
| 前年比2024年 | 2.44% |
| CAGR | 2.58% |
| 増分額 | 100億米ドル |
本調査では、持続可能な容器の重要性が高まっていることが、今後数年間の食品保存容器市場の成長を牽引する主要因の1つであるとしています。また、より洗練されたデザインへの需要の高まりとガラス容器の需要増加が、市場の大きな需要につながります。
目次
第1章 エグゼクティブサマリー
- 市場概要
第2章 市場情勢
- 市場エコシステム
- 市場の特徴
- バリューチェーン分析
第3章 市場規模の評価
- 市場の定義
- 市場セグメント分析
- 市場規模 2023
- 市場の見通し 2023-2028
第4章 市場規模実績
- 世界食品保存容器市場 2018-2022
- 材料別セグメント分析 2018-2022
- タイプ別セグメント分析 2018-2022
- 地域別セグメント分析 2018-2022
- 国別セグメント分析 2018-2022
第5章 ファイブフォース分析
- ファイブフォースの要約
- 買い手の交渉力
- 供給企業の交渉力
- 新規参入業者の脅威
- 代替品の脅威
- 競争の脅威
- 市況
第6章 市場セグメンテーション:素材別
- 市場セグメンテーション
- 比較:素材別
- プラスチック:市場規模と予測 2023-2028
- 金属:市場規模と予測 2023-2028
- ガラス:市場規模と予測 2023-2028
- 紙:市場規模と予測 2023-2028
- 市場機会:素材別
第7章 市場セグメンテーション:タイプ別
- 市場セグメンテーション
- 比較:タイプ別
- 堅い包装:市場規模と予測 2023-2028
- フレキシブル包装:市場規模と予測 2023-2028
- 市場機会:タイプ別
第8章 顧客情勢
- 顧客情勢の概要
第9章 地域別情勢
- 地域別セグメンテーション
- 地域別比較
- アジア太平洋:市場規模と予測 2023-2028
- 北米:市場規模と予測 2023-2028
- 欧州:市場規模と予測 2023-2028
- 南米:市場規模と予測 2023-2028
- 中東・アフリカ:市場規模と予測 2023-2028
- 米国:市場規模と予測 2023-2028
- 中国:市場規模と予測 2023-2028
- インド:市場規模と予測 2023-2028
- ドイツ:市場規模と予測 2023-2028
- 日本:市場規模と予測 2023-2028
- 市場機会:地域情勢別
第10章 促進要因・課題・機会・抑制要因
- 市場促進要因
- 市場の課題
- 促進要因と課題の影響
- 市場の機会・抑制要因
第11章 競合情勢
- 概要
- 競合情勢
- 混乱の状況
- 業界のリスク
第12章 競合分析
- 企業プロファイル
- 企業の市場ポジショニング
- Accent-Fairchild Group
- Amcor Plc
- Anchor Glass Container Corp.
- Berry Global Inc.
- Crown Holdings Inc.
- Graham Packaging Co. LP
- Newell Brands Inc.
- O I Glass Inc.
- Pactiv Evergreen Inc.
- Plastipak Holdings Inc.
- Printpack Inc.
- S.C. Johnson and Son Inc.
- Sonoco Products Co.
- Sterilite Corp.
- Tupperware Brands Corp.
第13章 付録
Exhibits:
- Exhibits1: Executive Summary - Chart on Market Overview
- Exhibits2: Executive Summary - Data Table on Market Overview
- Exhibits3: Executive Summary - Chart on Global Market Characteristics
- Exhibits4: Executive Summary - Chart on Market By Geographical Landscape
- Exhibits5: Executive Summary - Chart on Market Segmentation by Material
- Exhibits6: Executive Summary - Chart on Market Segmentation by Type
- Exhibits7: Executive Summary - Chart on Incremental Growth
- Exhibits8: Executive Summary - Data Table on Incremental Growth
- Exhibits9: Executive Summary - Chart on Company Market Positioning
- Exhibits10: Parent Market
- Exhibits11: Data Table on - Parent Market
- Exhibits12: Market characteristics analysis
- Exhibits13: Value Chain Analysis
- Exhibits14: Offerings of companies included in the market definition
- Exhibits15: Market segments
- Exhibits16: Chart on Global - Market size and forecast 2023-2028 ($ billion)
- Exhibits17: Data Table on Global - Market size and forecast 2023-2028 ($ billion)
- Exhibits18: Chart on Global Market: Year-over-year growth 2023-2028 (%)
- Exhibits19: Data Table on Global Market: Year-over-year growth 2023-2028 (%)
- Exhibits20: Historic Market Size - Data Table on Global Food Storage Container Market 2018 - 2022 ($ billion)
- Exhibits21: Historic Market Size - Material Segment 2018 - 2022 ($ billion)
- Exhibits22: Historic Market Size - Type Segment 2018 - 2022 ($ billion)
- Exhibits23: Historic Market Size - Geography Segment 2018 - 2022 ($ billion)
- Exhibits24: Historic Market Size - Country Segment 2018 - 2022 ($ billion)
- Exhibits25: Five forces analysis - Comparison between 2023 and 2028
- Exhibits26: Bargaining power of buyers - Impact of key factors 2023 and 2028
- Exhibits27: Bargaining power of suppliers - Impact of key factors in 2023 and 2028
- Exhibits28: Threat of new entrants - Impact of key factors in 2023 and 2028
- Exhibits29: Threat of substitutes - Impact of key factors in 2023 and 2028
- Exhibits30: Threat of rivalry - Impact of key factors in 2023 and 2028
- Exhibits31: Chart on Market condition - Five forces 2023 and 2028
- Exhibits32: Chart on Material - Market share 2023-2028 (%)
- Exhibits33: Data Table on Material - Market share 2023-2028 (%)
- Exhibits34: Chart on Comparison by Material
- Exhibits35: Data Table on Comparison by Material
- Exhibits36: Chart on Plastic - Market size and forecast 2023-2028 ($ billion)
- Exhibits37: Data Table on Plastic - Market size and forecast 2023-2028 ($ billion)
- Exhibits38: Chart on Plastic - Year-over-year growth 2023-2028 (%)
- Exhibits39: Data Table on Plastic - Year-over-year growth 2023-2028 (%)
- Exhibits40: Chart on Metal - Market size and forecast 2023-2028 ($ billion)
- Exhibits41: Data Table on Metal - Market size and forecast 2023-2028 ($ billion)
- Exhibits42: Chart on Metal - Year-over-year growth 2023-2028 (%)
- Exhibits43: Data Table on Metal - Year-over-year growth 2023-2028 (%)
- Exhibits44: Chart on Glass - Market size and forecast 2023-2028 ($ billion)
- Exhibits45: Data Table on Glass - Market size and forecast 2023-2028 ($ billion)
- Exhibits46: Chart on Glass - Year-over-year growth 2023-2028 (%)
- Exhibits47: Data Table on Glass - Year-over-year growth 2023-2028 (%)
- Exhibits48: Chart on Paper - Market size and forecast 2023-2028 ($ billion)
- Exhibits49: Data Table on Paper - Market size and forecast 2023-2028 ($ billion)
- Exhibits50: Chart on Paper - Year-over-year growth 2023-2028 (%)
- Exhibits51: Data Table on Paper - Year-over-year growth 2023-2028 (%)
- Exhibits52: Market opportunity by Material ($ billion)
- Exhibits53: Data Table on Market opportunity by Material ($ billion)
- Exhibits54: Chart on Type - Market share 2023-2028 (%)
- Exhibits55: Data Table on Type - Market share 2023-2028 (%)
- Exhibits56: Chart on Comparison by Type
- Exhibits57: Data Table on Comparison by Type
- Exhibits58: Chart on Rigid packaging - Market size and forecast 2023-2028 ($ billion)
- Exhibits59: Data Table on Rigid packaging - Market size and forecast 2023-2028 ($ billion)
- Exhibits60: Chart on Rigid packaging - Year-over-year growth 2023-2028 (%)
- Exhibits61: Data Table on Rigid packaging - Year-over-year growth 2023-2028 (%)
- Exhibits62: Chart on Flexible packaging - Market size and forecast 2023-2028 ($ billion)
- Exhibits63: Data Table on Flexible packaging - Market size and forecast 2023-2028 ($ billion)
- Exhibits64: Chart on Flexible packaging - Year-over-year growth 2023-2028 (%)
- Exhibits65: Data Table on Flexible packaging - Year-over-year growth 2023-2028 (%)
- Exhibits66: Market opportunity by Type ($ billion)
- Exhibits67: Data Table on Market opportunity by Type ($ billion)
- Exhibits68: Analysis of price sensitivity, lifecycle, customer purchase basket, adoption rates, and purchase criteria
- Exhibits69: Chart on Market share By Geographical Landscape 2023-2028 (%)
- Exhibits70: Data Table on Market share By Geographical Landscape 2023-2028 (%)
- Exhibits71: Chart on Geographic comparison
- Exhibits72: Data Table on Geographic comparison
- Exhibits73: Chart on APAC - Market size and forecast 2023-2028 ($ billion)
- Exhibits74: Data Table on APAC - Market size and forecast 2023-2028 ($ billion)
- Exhibits75: Chart on APAC - Year-over-year growth 2023-2028 (%)
- Exhibits76: Data Table on APAC - Year-over-year growth 2023-2028 (%)
- Exhibits77: Chart on North America - Market size and forecast 2023-2028 ($ billion)
- Exhibits78: Data Table on North America - Market size and forecast 2023-2028 ($ billion)
- Exhibits79: Chart on North America - Year-over-year growth 2023-2028 (%)
- Exhibits80: Data Table on North America - Year-over-year growth 2023-2028 (%)
- Exhibits81: Chart on Europe - Market size and forecast 2023-2028 ($ billion)
- Exhibits82: Data Table on Europe - Market size and forecast 2023-2028 ($ billion)
- Exhibits83: Chart on Europe - Year-over-year growth 2023-2028 (%)
- Exhibits84: Data Table on Europe - Year-over-year growth 2023-2028 (%)
- Exhibits85: Chart on South America - Market size and forecast 2023-2028 ($ billion)
- Exhibits86: Data Table on South America - Market size and forecast 2023-2028 ($ billion)
- Exhibits87: Chart on South America - Year-over-year growth 2023-2028 (%)
- Exhibits88: Data Table on South America - Year-over-year growth 2023-2028 (%)
- Exhibits89: Chart on Middle East and Africa - Market size and forecast 2023-2028 ($ billion)
- Exhibits90: Data Table on Middle East and Africa - Market size and forecast 2023-2028 ($ billion)
- Exhibits91: Chart on Middle East and Africa - Year-over-year growth 2023-2028 (%)
- Exhibits92: Data Table on Middle East and Africa - Year-over-year growth 2023-2028 (%)
- Exhibits93: Chart on US - Market size and forecast 2023-2028 ($ billion)
- Exhibits94: Data Table on US - Market size and forecast 2023-2028 ($ billion)
- Exhibits95: Chart on US - Year-over-year growth 2023-2028 (%)
- Exhibits96: Data Table on US - Year-over-year growth 2023-2028 (%)
- Exhibits97: Chart on China - Market size and forecast 2023-2028 ($ billion)
- Exhibits98: Data Table on China - Market size and forecast 2023-2028 ($ billion)
- Exhibits99: Chart on China - Year-over-year growth 2023-2028 (%)
- Exhibits100: Data Table on China - Year-over-year growth 2023-2028 (%)
- Exhibits101: Chart on India - Market size and forecast 2023-2028 ($ billion)
- Exhibits102: Data Table on India - Market size and forecast 2023-2028 ($ billion)
- Exhibits103: Chart on India - Year-over-year growth 2023-2028 (%)
- Exhibits104: Data Table on India - Year-over-year growth 2023-2028 (%)
- Exhibits105: Chart on Germany - Market size and forecast 2023-2028 ($ billion)
- Exhibits106: Data Table on Germany - Market size and forecast 2023-2028 ($ billion)
- Exhibits107: Chart on Germany - Year-over-year growth 2023-2028 (%)
- Exhibits108: Data Table on Germany - Year-over-year growth 2023-2028 (%)
- Exhibits109: Chart on Japan - Market size and forecast 2023-2028 ($ billion)
- Exhibits110: Data Table on Japan - Market size and forecast 2023-2028 ($ billion)
- Exhibits111: Chart on Japan - Year-over-year growth 2023-2028 (%)
- Exhibits112: Data Table on Japan - Year-over-year growth 2023-2028 (%)
- Exhibits113: Market opportunity By Geographical Landscape ($ billion)
- Exhibits114: Data Tables on Market opportunity By Geographical Landscape ($ billion)
- Exhibits115: Impact of drivers and challenges in 2023 and 2028
- Exhibits116: Overview on criticality of inputs and factors of differentiation
- Exhibits117: Overview on factors of disruption
- Exhibits118: Impact of key risks on business
- Exhibits119: Companies covered
- Exhibits120: Matrix on companies position and classification
- Exhibits121: Accent-Fairchild Group - Overview
- Exhibits122: Accent-Fairchild Group - Product / Service
- Exhibits123: Accent-Fairchild Group - Key offerings
- Exhibits124: Amcor Plc - Overview
- Exhibits125: Amcor Plc - Business segments
- Exhibits126: Amcor Plc - Key news
- Exhibits127: Amcor Plc - Key offerings
- Exhibits128: Amcor Plc - Segment focus
- Exhibits129: Anchor Glass Container Corp. - Overview
- Exhibits130: Anchor Glass Container Corp. - Product / Service
- Exhibits131: Anchor Glass Container Corp. - Key offerings
- Exhibits132: Berry Global Inc. - Overview
- Exhibits133: Berry Global Inc. - Business segments
- Exhibits134: Berry Global Inc. - Key news
- Exhibits135: Berry Global Inc. - Key offerings
- Exhibits136: Berry Global Inc. - Segment focus
- Exhibits137: Crown Holdings Inc. - Overview
- Exhibits138: Crown Holdings Inc. - Business segments
- Exhibits139: Crown Holdings Inc. - Key news
- Exhibits140: Crown Holdings Inc. - Key offerings
- Exhibits141: Crown Holdings Inc. - Segment focus
- Exhibits142: Graham Packaging Co. LP - Overview
- Exhibits143: Graham Packaging Co. LP - Product / Service
- Exhibits144: Graham Packaging Co. LP - Key offerings
- Exhibits145: Newell Brands Inc. - Overview
- Exhibits146: Newell Brands Inc. - Business segments
- Exhibits147: Newell Brands Inc. - Key news
- Exhibits148: Newell Brands Inc. - Key offerings
- Exhibits149: Newell Brands Inc. - Segment focus
- Exhibits150: O I Glass Inc. - Overview
- Exhibits151: O I Glass Inc. - Business segments
- Exhibits152: O I Glass Inc. - Key offerings
- Exhibits153: O I Glass Inc. - Segment focus
- Exhibits154: Pactiv Evergreen Inc. - Overview
- Exhibits155: Pactiv Evergreen Inc. - Business segments
- Exhibits156: Pactiv Evergreen Inc. - Key offerings
- Exhibits157: Pactiv Evergreen Inc. - Segment focus
- Exhibits158: Plastipak Holdings Inc. - Overview
- Exhibits159: Plastipak Holdings Inc. - Product / Service
- Exhibits160: Plastipak Holdings Inc. - Key offerings
- Exhibits161: Printpack Inc. - Overview
- Exhibits162: Printpack Inc. - Product / Service
- Exhibits163: Printpack Inc. - Key offerings
- Exhibits164: S.C. Johnson and Son Inc. - Overview
- Exhibits165: S.C. Johnson and Son Inc. - Product / Service
- Exhibits166: S.C. Johnson and Son Inc. - Key offerings
- Exhibits167: Sonoco Products Co. - Overview
- Exhibits168: Sonoco Products Co. - Business segments
- Exhibits169: Sonoco Products Co. - Key news
- Exhibits170: Sonoco Products Co. - Key offerings
- Exhibits171: Sonoco Products Co. - Segment focus
- Exhibits172: Sterilite Corp. - Overview
- Exhibits173: Sterilite Corp. - Product / Service
- Exhibits174: Sterilite Corp. - Key offerings
- Exhibits175: Tupperware Brands Corp. - Overview
- Exhibits176: Tupperware Brands Corp. - Business segments
- Exhibits177: Tupperware Brands Corp. - Key offerings
- Exhibits178: Tupperware Brands Corp. - Segment focus
- Exhibits179: Inclusions checklist
- Exhibits180: Exclusions checklist
- Exhibits181: Currency conversion rates for US$
- Exhibits182: Research methodology
- Exhibits183: Information sources
- Exhibits184: Data validation
- Exhibits185: Validation techniques employed for market sizing
- Exhibits186: Data synthesis
- Exhibits187: 360 degree market analysis
- Exhibits188: List of abbreviations
The food storage container market is forecasted to grow by USD 10 bn during 2023-2028, accelerating at a CAGR of 2.58% during the forecast period. The report on the food storage container market provides a holistic analysis, market size and forecast, trends, growth drivers, and challenges, as well as vendor analysis covering around 25 vendors.
The report offers an up-to-date analysis regarding the current market scenario, the latest trends and drivers, and the overall market environment. The market is driven by growing preference for durable and lightweight containers, shelf-life extension of food products to avert cross-contamination, and growing demand for odor- and stain-resistant storage containers.
Technavio's food storage container market is segmented as below:
| Market Scope | |
|---|---|
| Base Year | 2024 |
| End Year | 2028 |
| Series Year | 2024-2028 |
| Growth Momentum | Accelerate |
| YOY 2024 | 2.44% |
| CAGR | 2.58% |
| Incremental Value | $10bn |
By Material
- Plastic
- Metal
- Glass
- Paper
By Type
- Rigid packaging
- Flexible packaging
By Geographical Landscape
- APAC
- North America
- Europe
- South America
- Middle East and Africa
This study identifies the growing importance of sustainable containers as one of the prime reasons driving the food storage container market growth during the next few years. Also, increasing demand for more sophisticated designs and increase in demand for glass containers will lead to sizable demand in the market.
The report on the food storage container market covers the following areas:
- Food storage container market sizing
- Food storage container market forecast
- Food storage container market industry analysis
The robust vendor analysis is designed to help clients improve their market position, and in line with this, this report provides a detailed analysis of several leading food storage container market vendors that include Accent-Fairchild Group, Amcor PLC, Anchor Glass Container Corp., Berry Global Inc., Crown Holdings Inc., Graham Packaging Co. LP, Graphic Packaging Holding Co., Hamilton Housewares Pvt. Ltd., Newell Brands Inc., Nilkamal Ltd., O I Glass Inc., Pactiv Evergreen Inc., Plastipak Holdings Inc., Printpack Inc., RING Container Technologies, S.C. Johnson and Son Inc., Shantou Mandun Plastic Co. Ltd., Sonoco Products Co., Sterilite Corp., and Tupperware Brands Corp.. Also, the food storage container market analysis report includes information on upcoming trends and challenges that will influence market growth. This is to help companies strategize and leverage all forthcoming growth opportunities.
The study was conducted using an objective combination of primary and secondary information including inputs from key participants in the industry. The report contains a comprehensive market and vendor landscape in addition to an analysis of the key vendors.
The publisher presents a detailed picture of the market by the way of study, synthesis, and summation of data from multiple sources by an analysis of key parameters such as profit, pricing, competition, and promotions. IT presents various market facets by identifying the key industry influencers. The data presented is comprehensive, reliable, and a result of extensive research - both primary and secondary. The market research reports provide a complete competitive landscape and an in-depth vendor selection methodology and analysis using qualitative and quantitative research to forecast the accurate market growth.
Table of Contents
1 Executive Summary
- 1.1 Market overview
- Executive Summary - Chart on Market Overview
- Executive Summary - Data Table on Market Overview
- Executive Summary - Chart on Global Market Characteristics
- Executive Summary - Chart on Market By Geographical Landscape
- Executive Summary - Chart on Market Segmentation by Material
- Executive Summary - Chart on Market Segmentation by Type
- Executive Summary - Chart on Incremental Growth
- Executive Summary - Data Table on Incremental Growth
- Executive Summary - Chart on Company Market Positioning
2 Market Landscape
- 2.1 Market ecosystem
- Parent Market
- Data Table on - Parent Market
- 2.2 Market characteristics
- Market characteristics analysis
- 2.3 Value chain analysis
- Value Chain Analysis
3 Market Sizing
- 3.1 Market definition
- Offerings of companies included in the market definition
- 3.2 Market segment analysis
- Market segments
- 3.3 Market size 2023
- 3.4 Market outlook: Forecast for 2023-2028
- Chart on Global - Market size and forecast 2023-2028 ($ billion)
- Data Table on Global - Market size and forecast 2023-2028 ($ billion)
- Chart on Global Market: Year-over-year growth 2023-2028 (%)
- Data Table on Global Market: Year-over-year growth 2023-2028 (%)
4 Historic Market Size
- 4.1 Global Food Storage Container Market 2018 - 2022
- Historic Market Size - Data Table on Global Food Storage Container Market 2018 - 2022 ($ billion)
- 4.2 Material segment analysis 2018 - 2022
- Historic Market Size - Material Segment 2018 - 2022 ($ billion)
- 4.3 Type segment analysis 2018 - 2022
- Historic Market Size - Type Segment 2018 - 2022 ($ billion)
- 4.4 Geography segment analysis 2018 - 2022
- Historic Market Size - Geography Segment 2018 - 2022 ($ billion)
- 4.5 Country segment analysis 2018 - 2022
- Historic Market Size - Country Segment 2018 - 2022 ($ billion)
5 Five Forces Analysis
- 5.1 Five forces summary
- Five forces analysis - Comparison between 2023 and 2028
- 5.2 Bargaining power of buyers
- Bargaining power of buyers - Impact of key factors 2023 and 2028
- 5.3 Bargaining power of suppliers
- Bargaining power of suppliers - Impact of key factors in 2023 and 2028
- 5.4 Threat of new entrants
- Threat of new entrants - Impact of key factors in 2023 and 2028
- 5.5 Threat of substitutes
- Threat of substitutes - Impact of key factors in 2023 and 2028
- 5.6 Threat of rivalry
- Threat of rivalry - Impact of key factors in 2023 and 2028
- 5.7 Market condition
- Chart on Market condition - Five forces 2023 and 2028
6 Market Segmentation by Material
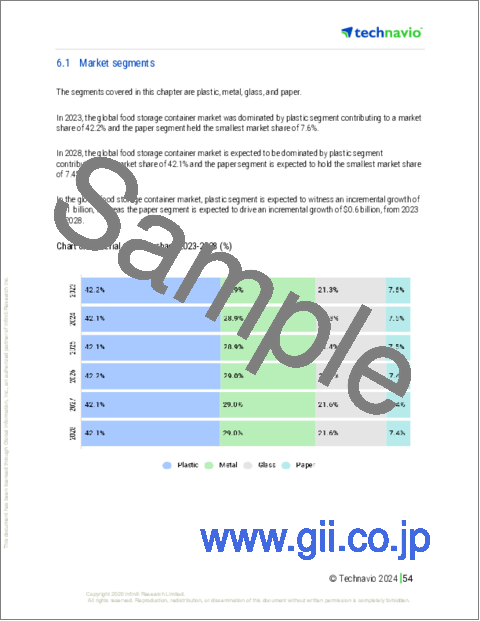
- 6.1 Market segments
- Chart on Material - Market share 2023-2028 (%)
- Data Table on Material - Market share 2023-2028 (%)
- 6.2 Comparison by Material
- Chart on Comparison by Material
- Data Table on Comparison by Material
- 6.3 Plastic - Market size and forecast 2023-2028
- Chart on Plastic - Market size and forecast 2023-2028 ($ billion)
- Data Table on Plastic - Market size and forecast 2023-2028 ($ billion)
- Chart on Plastic - Year-over-year growth 2023-2028 (%)
- Data Table on Plastic - Year-over-year growth 2023-2028 (%)
- 6.4 Metal - Market size and forecast 2023-2028
- Chart on Metal - Market size and forecast 2023-2028 ($ billion)
- Data Table on Metal - Market size and forecast 2023-2028 ($ billion)
- Chart on Metal - Year-over-year growth 2023-2028 (%)
- Data Table on Metal - Year-over-year growth 2023-2028 (%)
- 6.5 Glass - Market size and forecast 2023-2028
- Chart on Glass - Market size and forecast 2023-2028 ($ billion)
- Data Table on Glass - Market size and forecast 2023-2028 ($ billion)
- Chart on Glass - Year-over-year growth 2023-2028 (%)
- Data Table on Glass - Year-over-year growth 2023-2028 (%)
- 6.6 Paper - Market size and forecast 2023-2028
- Chart on Paper - Market size and forecast 2023-2028 ($ billion)
- Data Table on Paper - Market size and forecast 2023-2028 ($ billion)
- Chart on Paper - Year-over-year growth 2023-2028 (%)
- Data Table on Paper - Year-over-year growth 2023-2028 (%)
- 6.7 Market opportunity by Material
- Market opportunity by Material ($ billion)
- Data Table on Market opportunity by Material ($ billion)
7 Market Segmentation by Type
- 7.1 Market segments
- Chart on Type - Market share 2023-2028 (%)
- Data Table on Type - Market share 2023-2028 (%)
- 7.2 Comparison by Type
- Chart on Comparison by Type
- Data Table on Comparison by Type
- 7.3 Rigid packaging - Market size and forecast 2023-2028
- Chart on Rigid packaging - Market size and forecast 2023-2028 ($ billion)
- Data Table on Rigid packaging - Market size and forecast 2023-2028 ($ billion)
- Chart on Rigid packaging - Year-over-year growth 2023-2028 (%)
- Data Table on Rigid packaging - Year-over-year growth 2023-2028 (%)
- 7.4 Flexible packaging - Market size and forecast 2023-2028
- Chart on Flexible packaging - Market size and forecast 2023-2028 ($ billion)
- Data Table on Flexible packaging - Market size and forecast 2023-2028 ($ billion)
- Chart on Flexible packaging - Year-over-year growth 2023-2028 (%)
- Data Table on Flexible packaging - Year-over-year growth 2023-2028 (%)
- 7.5 Market opportunity by Type
- Market opportunity by Type ($ billion)
- Data Table on Market opportunity by Type ($ billion)
8 Customer Landscape
- 8.1 Customer landscape overview
- Analysis of price sensitivity, lifecycle, customer purchase basket, adoption rates, and purchase criteria
9 Geographic Landscape
- 9.1 Geographic segmentation
- Chart on Market share By Geographical Landscape 2023-2028 (%)
- Data Table on Market share By Geographical Landscape 2023-2028 (%)
- 9.2 Geographic comparison
- Chart on Geographic comparison
- Data Table on Geographic comparison
- 9.3 APAC - Market size and forecast 2023-2028
- Chart on APAC - Market size and forecast 2023-2028 ($ billion)
- Data Table on APAC - Market size and forecast 2023-2028 ($ billion)
- Chart on APAC - Year-over-year growth 2023-2028 (%)
- Data Table on APAC - Year-over-year growth 2023-2028 (%)
- 9.4 North America - Market size and forecast 2023-2028
- Chart on North America - Market size and forecast 2023-2028 ($ billion)
- Data Table on North America - Market size and forecast 2023-2028 ($ billion)
- Chart on North America - Year-over-year growth 2023-2028 (%)
- Data Table on North America - Year-over-year growth 2023-2028 (%)
- 9.5 Europe - Market size and forecast 2023-2028
- Chart on Europe - Market size and forecast 2023-2028 ($ billion)
- Data Table on Europe - Market size and forecast 2023-2028 ($ billion)
- Chart on Europe - Year-over-year growth 2023-2028 (%)
- Data Table on Europe - Year-over-year growth 2023-2028 (%)
- 9.6 South America - Market size and forecast 2023-2028
- Chart on South America - Market size and forecast 2023-2028 ($ billion)
- Data Table on South America - Market size and forecast 2023-2028 ($ billion)
- Chart on South America - Year-over-year growth 2023-2028 (%)
- Data Table on South America - Year-over-year growth 2023-2028 (%)
- 9.7 Middle East and Africa - Market size and forecast 2023-2028
- Chart on Middle East and Africa - Market size and forecast 2023-2028 ($ billion)
- Data Table on Middle East and Africa - Market size and forecast 2023-2028 ($ billion)
- Chart on Middle East and Africa - Year-over-year growth 2023-2028 (%)
- Data Table on Middle East and Africa - Year-over-year growth 2023-2028 (%)
- 9.8 US - Market size and forecast 2023-2028
- Chart on US - Market size and forecast 2023-2028 ($ billion)
- Data Table on US - Market size and forecast 2023-2028 ($ billion)
- Chart on US - Year-over-year growth 2023-2028 (%)
- Data Table on US - Year-over-year growth 2023-2028 (%)
- 9.9 China - Market size and forecast 2023-2028
- Chart on China - Market size and forecast 2023-2028 ($ billion)
- Data Table on China - Market size and forecast 2023-2028 ($ billion)
- Chart on China - Year-over-year growth 2023-2028 (%)
- Data Table on China - Year-over-year growth 2023-2028 (%)
- 9.10 India - Market size and forecast 2023-2028
- Chart on India - Market size and forecast 2023-2028 ($ billion)
- Data Table on India - Market size and forecast 2023-2028 ($ billion)
- Chart on India - Year-over-year growth 2023-2028 (%)
- Data Table on India - Year-over-year growth 2023-2028 (%)
- 9.11 Germany - Market size and forecast 2023-2028
- Chart on Germany - Market size and forecast 2023-2028 ($ billion)
- Data Table on Germany - Market size and forecast 2023-2028 ($ billion)
- Chart on Germany - Year-over-year growth 2023-2028 (%)
- Data Table on Germany - Year-over-year growth 2023-2028 (%)
- 9.12 Japan - Market size and forecast 2023-2028
- Chart on Japan - Market size and forecast 2023-2028 ($ billion)
- Data Table on Japan - Market size and forecast 2023-2028 ($ billion)
- Chart on Japan - Year-over-year growth 2023-2028 (%)
- Data Table on Japan - Year-over-year growth 2023-2028 (%)
- 9.13 Market opportunity By Geographical Landscape
- Market opportunity By Geographical Landscape ($ billion)
- Data Tables on Market opportunity By Geographical Landscape ($ billion)
10 Drivers, Challenges, and Opportunity/Restraints
- 10.1 Market drivers
- 10.2 Market challenges
- 10.3 Impact of drivers and challenges
- Impact of drivers and challenges in 2023 and 2028
- 10.4 Market opportunities/restraints
11 Competitive Landscape
- 11.1 Overview
- 11.2 Competitive Landscape
- Overview on criticality of inputs and factors of differentiation
- 11.3 Landscape disruption
- Overview on factors of disruption
- 11.4 Industry risks
- Impact of key risks on business
12 Competitive Analysis
- 12.1 Companies profiled
- Companies covered
- 12.2 Market positioning of companies
- Matrix on companies position and classification
- 12.3 Accent-Fairchild Group
- Accent-Fairchild Group - Overview
- Accent-Fairchild Group - Product / Service
- Accent-Fairchild Group - Key offerings
- 12.4 Amcor Plc
- Amcor Plc - Overview
- Amcor Plc - Business segments
- Amcor Plc - Key news
- Amcor Plc - Key offerings
- Amcor Plc - Segment focus
- 12.5 Anchor Glass Container Corp.
- Anchor Glass Container Corp. - Overview
- Anchor Glass Container Corp. - Product / Service
- Anchor Glass Container Corp. - Key offerings
- 12.6 Berry Global Inc.
- Berry Global Inc. - Overview
- Berry Global Inc. - Business segments
- Berry Global Inc. - Key news
- Berry Global Inc. - Key offerings
- Berry Global Inc. - Segment focus
- 12.7 Crown Holdings Inc.
- Crown Holdings Inc. - Overview
- Crown Holdings Inc. - Business segments
- Crown Holdings Inc. - Key news
- Crown Holdings Inc. - Key offerings
- Crown Holdings Inc. - Segment focus
- 12.8 Graham Packaging Co. LP
- Graham Packaging Co. LP - Overview
- Graham Packaging Co. LP - Product / Service
- Graham Packaging Co. LP - Key offerings
- 12.9 Newell Brands Inc.
- Newell Brands Inc. - Overview
- Newell Brands Inc. - Business segments
- Newell Brands Inc. - Key news
- Newell Brands Inc. - Key offerings
- Newell Brands Inc. - Segment focus
- 12.10 O I Glass Inc.
- O I Glass Inc. - Overview
- O I Glass Inc. - Business segments
- O I Glass Inc. - Key offerings
- O I Glass Inc. - Segment focus
- 12.11 Pactiv Evergreen Inc.
- Pactiv Evergreen Inc. - Overview
- Pactiv Evergreen Inc. - Business segments
- Pactiv Evergreen Inc. - Key offerings
- Pactiv Evergreen Inc. - Segment focus
- 12.12 Plastipak Holdings Inc.
- Plastipak Holdings Inc. - Overview
- Plastipak Holdings Inc. - Product / Service
- Plastipak Holdings Inc. - Key offerings
- 12.13 Printpack Inc.
- Printpack Inc. - Overview
- Printpack Inc. - Product / Service
- Printpack Inc. - Key offerings
- 12.14 S.C. Johnson and Son Inc.
- S.C. Johnson and Son Inc. - Overview
- S.C. Johnson and Son Inc. - Product / Service
- S.C. Johnson and Son Inc. - Key offerings
- 12.15 Sonoco Products Co.
- Sonoco Products Co. - Overview
- Sonoco Products Co. - Business segments
- Sonoco Products Co. - Key news
- Sonoco Products Co. - Key offerings
- Sonoco Products Co. - Segment focus
- 12.16 Sterilite Corp.
- Sterilite Corp. - Overview
- Sterilite Corp. - Product / Service
- Sterilite Corp. - Key offerings
- 12.17 Tupperware Brands Corp.
- Tupperware Brands Corp. - Overview
- Tupperware Brands Corp. - Business segments
- Tupperware Brands Corp. - Key offerings
- Tupperware Brands Corp. - Segment focus
13 Appendix
- 13.1 Scope of the report
- 13.2 Inclusions and exclusions checklist
- Inclusions checklist
- Exclusions checklist
- 13.3 Currency conversion rates for US$
- Currency conversion rates for US$
- 13.4 Research methodology
- Research methodology
- 13.5 Data procurement
- Information sources
- 13.6 Data validation
- Data validation
- 13.7 Validation techniques employed for market sizing
- Validation techniques employed for market sizing
- 13.8 Data synthesis
- Data synthesis
- 13.9 360 degree market analysis
- 360 degree market analysis
- 13.10 List of abbreviations
- List of abbreviations

