|
|
市場調査レポート
商品コード
1544375
次世代シーケンスデータ解析の世界市場、2024~2028年Global Next Generation Sequencing Data Analysis Market 2024-2028 |
||||||
|
|||||||
カスタマイズ可能
|
|||||||

| 次世代シーケンスデータ解析の世界市場、2024~2028年 |
|
出版日: 2024年07月22日
発行: TechNavio
ページ情報: 英文 178 Pages
納期: 即納可能
|

全表示
- 概要
- 図表
- 目次
次世代シーケンスデータ解析市場は2023~2028年に19億230万米ドル、予測期間中のCAGRは22.58%で成長すると予測されます。
この調査レポートは、次世代シーケンス(NGS)データ解析市場の全体分析、市場規模・予測、動向、成長促進要因、課題、約25のベンダーを網羅したベンダー分析などを掲載しています。
現在の市場シナリオ、最新動向と促進要因、市場環境全体に関する最新分析を提供しています。市場は、NGSデータ解析ソリューションの開発に向けたベンダー間の戦略的提携の増加、NGSデータ解析における新たな解析手法の開拓、個別化医療に対する需要の高まりなどが牽引しています。
| 市場範囲 | |
|---|---|
| 基準年 | 2024年 |
| 終了年 | 2028年 |
| 予測期間 | 2024~2028年 |
| 成長モメンタム | 加速 |
| 前年比[2024年] | 21.89% |
| CAGR | 22.58% |
| 増分額 | 19億230万米ドル |
本調査では、NGS技術の進歩が今後数年間の次世代シーケンスデータ解析市場成長を促進する主要な理由の1つであると特定しています。また、リアルタイムとPOSのNGSデータ解析ソリューションの開発に対する関心の高まりや、クラウドベースのNGSデータ解析ソリューションの採用拡大も、市場の大きな需要につながります。
目次
第1章 エグゼクティブサマリー
- 市場概要
第2章 市場情勢
- 市場エコシステム
- 市場の特徴
- バリューチェーン分析
第3章 市場規模の評価
- 市場の定義
- 市場セグメント分析
- 市場規模 2023年
- 市場の展望 2023~2028年
第4章 市場規模実績
- 次世代シーケンスデータ解析の世界市場 2018~2022年
- エンドユーザー別セグメント分析 2018~2022年
- 製品別セグメント分析 2018~2022年
- 地域別セグメント分析 2018~2022年
- 国別セグメント分析 2018~2022年
第5章 ファイブフォース分析
- ファイブフォースの要約
- 買い手の交渉力
- 供給企業の交渉力
- 新規参入業者の脅威
- 代替品の脅威
- 競争の脅威
- 市況
第6章 市場セグメンテーション:エンドユーザー別
- 市場セグメンテーション
- 比較:エンドユーザー別
- 学術研究:市場規模と予測 2023~2028年
- 臨床研究:市場規模と予測 2023~2028年
- 製薬とバイオテクノロジー企業:市場規模と予測 2023~2028年
- その他:市場規模と予測 2023~2028年
- 市場機会:エンドユーザー別
第7章 市場セグメンテーション:製品別
- 市場セグメンテーション
- 比較:製品別
- サービス:市場規模と予測 2023~2028年
- NGS商用ソフトウェア:市場規模と予測 2023~2028年
- 市場機会:製品別
第8章 顧客情勢
- 顧客情勢概要
第9章 地域別情勢
- 地域別セグメンテーション
- 比較:地域別
- 北米:市場規模と予測 2023~2028年
- 欧州:市場規模と予測 2023~2028年
- アジア:市場規模と予測 2023~2028年
- その他:市場規模と予測 2023~2028年
- 米国:市場規模と予測 2023~2028年
- ドイツ:市場規模と予測 2023~2028年
- カナダ:市場規模と予測 2023~2028年
- 中国:市場規模と予測 2023~2028年
- 英国:市場規模と予測 2023~2028年
- 市場機会:地域情勢別
第10章 促進要因・課題・機会・抑制要因
- 市場促進要因
- 市場課題
- 促進要因と課題の影響
- 市場の機会・抑制要因
第11章 競合情勢
- 概要
- 競合情勢
- 混乱の状況
- 業界のリスク
第12章 競合分析
- 企業プロファイル
- 企業の市場ポジショニング
- Agilent Technologies Inc.
- Bio Rad Laboratories Inc.
- Congenica Ltd.
- DNAnexus Inc.
- DNASTAR Inc.
- Eurofins Scientific SE
- F. Hoffmann La Roche Ltd.
- Fabric Genomics Inc.
- Golden Helix Inc.
- Illumina Inc.
- Pacific Biosciences of California Inc.
- Partek Inc.
- QIAGEN NV
- SciGenom Labs Pvt. Ltd.
- Thermo Fisher Scientific Inc.
第13章 付録
Exhibits:
- Exhibits1: Executive Summary - Chart on Market Overview
- Exhibits2: Executive Summary - Data Table on Market Overview
- Exhibits3: Executive Summary - Chart on Global Market Characteristics
- Exhibits4: Executive Summary - Chart on Market By Geographical Landscape
- Exhibits5: Executive Summary - Chart on Market Segmentation by End-user
- Exhibits6: Executive Summary - Chart on Market Segmentation by Product
- Exhibits7: Executive Summary - Chart on Incremental Growth
- Exhibits8: Executive Summary - Data Table on Incremental Growth
- Exhibits9: Executive Summary - Chart on Company Market Positioning
- Exhibits10: Parent Market
- Exhibits11: Data Table on - Parent Market
- Exhibits12: Market characteristics analysis
- Exhibits13: Value Chain Analysis
- Exhibits14: Offerings of companies included in the market definition
- Exhibits15: Market segments
- Exhibits16: Chart on Global - Market size and forecast 2023-2028 ($ million)
- Exhibits17: Data Table on Global - Market size and forecast 2023-2028 ($ million)
- Exhibits18: Chart on Global Market: Year-over-year growth 2023-2028 (%)
- Exhibits19: Data Table on Global Market: Year-over-year growth 2023-2028 (%)
- Exhibits20: Historic Market Size - Data Table on Global Next Generation Sequencing Data Analysis Market 2018 - 2022 ($ million)
- Exhibits21: Historic Market Size - End-user Segment 2018 - 2022 ($ million)
- Exhibits22: Historic Market Size - Product Segment 2018 - 2022 ($ million)
- Exhibits23: Historic Market Size - Geography Segment 2018 - 2022 ($ million)
- Exhibits24: Historic Market Size - Country Segment 2018 - 2022 ($ million)
- Exhibits25: Five forces analysis - Comparison between 2023 and 2028
- Exhibits26: Bargaining power of buyers - Impact of key factors 2023 and 2028
- Exhibits27: Bargaining power of suppliers - Impact of key factors in 2023 and 2028
- Exhibits28: Threat of new entrants - Impact of key factors in 2023 and 2028
- Exhibits29: Threat of substitutes - Impact of key factors in 2023 and 2028
- Exhibits30: Threat of rivalry - Impact of key factors in 2023 and 2028
- Exhibits31: Chart on Market condition - Five forces 2023 and 2028
- Exhibits32: Chart on End-user - Market share 2023-2028 (%)
- Exhibits33: Data Table on End-user - Market share 2023-2028 (%)
- Exhibits34: Chart on Comparison by End-user
- Exhibits35: Data Table on Comparison by End-user
- Exhibits36: Chart on Academic research - Market size and forecast 2023-2028 ($ million)
- Exhibits37: Data Table on Academic research - Market size and forecast 2023-2028 ($ million)
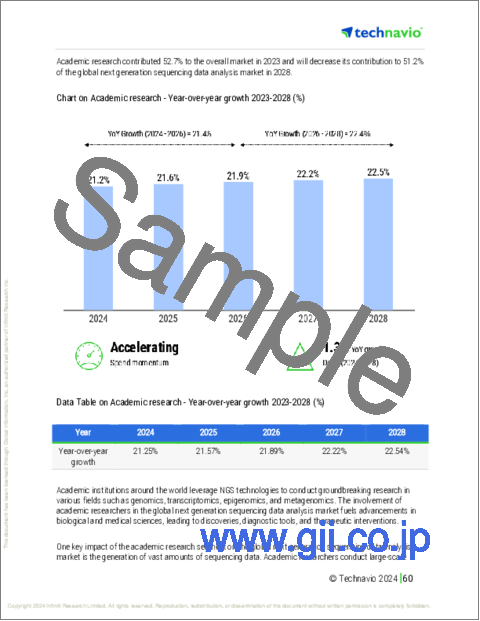
- Exhibits38: Chart on Academic research - Year-over-year growth 2023-2028 (%)
- Exhibits39: Data Table on Academic research - Year-over-year growth 2023-2028 (%)
- Exhibits40: Chart on Clinical research - Market size and forecast 2023-2028 ($ million)
- Exhibits41: Data Table on Clinical research - Market size and forecast 2023-2028 ($ million)
- Exhibits42: Chart on Clinical research - Year-over-year growth 2023-2028 (%)
- Exhibits43: Data Table on Clinical research - Year-over-year growth 2023-2028 (%)
- Exhibits44: Chart on Pharma and biotech entities - Market size and forecast 2023-2028 ($ million)
- Exhibits45: Data Table on Pharma and biotech entities - Market size and forecast 2023-2028 ($ million)
- Exhibits46: Chart on Pharma and biotech entities - Year-over-year growth 2023-2028 (%)
- Exhibits47: Data Table on Pharma and biotech entities - Year-over-year growth 2023-2028 (%)
- Exhibits48: Chart on Others - Market size and forecast 2023-2028 ($ million)
- Exhibits49: Data Table on Others - Market size and forecast 2023-2028 ($ million)
- Exhibits50: Chart on Others - Year-over-year growth 2023-2028 (%)
- Exhibits51: Data Table on Others - Year-over-year growth 2023-2028 (%)
- Exhibits52: Market opportunity by End-user ($ million)
- Exhibits53: Data Table on Market opportunity by End-user ($ million)
- Exhibits54: Chart on Product - Market share 2023-2028 (%)
- Exhibits55: Data Table on Product - Market share 2023-2028 (%)
- Exhibits56: Chart on Comparison by Product
- Exhibits57: Data Table on Comparison by Product
- Exhibits58: Chart on Services - Market size and forecast 2023-2028 ($ million)
- Exhibits59: Data Table on Services - Market size and forecast 2023-2028 ($ million)
- Exhibits60: Chart on Services - Year-over-year growth 2023-2028 (%)
- Exhibits61: Data Table on Services - Year-over-year growth 2023-2028 (%)
- Exhibits62: Chart on NGS commercial software - Market size and forecast 2023-2028 ($ million)
- Exhibits63: Data Table on NGS commercial software - Market size and forecast 2023-2028 ($ million)
- Exhibits64: Chart on NGS commercial software - Year-over-year growth 2023-2028 (%)
- Exhibits65: Data Table on NGS commercial software - Year-over-year growth 2023-2028 (%)
- Exhibits66: Market opportunity by Product ($ million)
- Exhibits67: Data Table on Market opportunity by Product ($ million)
- Exhibits68: Analysis of price sensitivity, lifecycle, customer purchase basket, adoption rates, and purchase criteria
- Exhibits69: Chart on Market share By Geographical Landscape 2023-2028 (%)
- Exhibits70: Data Table on Market share By Geographical Landscape 2023-2028 (%)
- Exhibits71: Chart on Geographic comparison
- Exhibits72: Data Table on Geographic comparison
- Exhibits73: Chart on North America - Market size and forecast 2023-2028 ($ million)
- Exhibits74: Data Table on North America - Market size and forecast 2023-2028 ($ million)
- Exhibits75: Chart on North America - Year-over-year growth 2023-2028 (%)
- Exhibits76: Data Table on North America - Year-over-year growth 2023-2028 (%)
- Exhibits77: Chart on Europe - Market size and forecast 2023-2028 ($ million)
- Exhibits78: Data Table on Europe - Market size and forecast 2023-2028 ($ million)
- Exhibits79: Chart on Europe - Year-over-year growth 2023-2028 (%)
- Exhibits80: Data Table on Europe - Year-over-year growth 2023-2028 (%)
- Exhibits81: Chart on Asia - Market size and forecast 2023-2028 ($ million)
- Exhibits82: Data Table on Asia - Market size and forecast 2023-2028 ($ million)
- Exhibits83: Chart on Asia - Year-over-year growth 2023-2028 (%)
- Exhibits84: Data Table on Asia - Year-over-year growth 2023-2028 (%)
- Exhibits85: Chart on Rest of World (ROW) - Market size and forecast 2023-2028 ($ million)
- Exhibits86: Data Table on Rest of World (ROW) - Market size and forecast 2023-2028 ($ million)
- Exhibits87: Chart on Rest of World (ROW) - Year-over-year growth 2023-2028 (%)
- Exhibits88: Data Table on Rest of World (ROW) - Year-over-year growth 2023-2028 (%)
- Exhibits89: Chart on US - Market size and forecast 2023-2028 ($ million)
- Exhibits90: Data Table on US - Market size and forecast 2023-2028 ($ million)
- Exhibits91: Chart on US - Year-over-year growth 2023-2028 (%)
- Exhibits92: Data Table on US - Year-over-year growth 2023-2028 (%)
- Exhibits93: Chart on Germany - Market size and forecast 2023-2028 ($ million)
- Exhibits94: Data Table on Germany - Market size and forecast 2023-2028 ($ million)
- Exhibits95: Chart on Germany - Year-over-year growth 2023-2028 (%)
- Exhibits96: Data Table on Germany - Year-over-year growth 2023-2028 (%)
- Exhibits97: Chart on Canada - Market size and forecast 2023-2028 ($ million)
- Exhibits98: Data Table on Canada - Market size and forecast 2023-2028 ($ million)
- Exhibits99: Chart on Canada - Year-over-year growth 2023-2028 (%)
- Exhibits100: Data Table on Canada - Year-over-year growth 2023-2028 (%)
- Exhibits101: Chart on China - Market size and forecast 2023-2028 ($ million)
- Exhibits102: Data Table on China - Market size and forecast 2023-2028 ($ million)
- Exhibits103: Chart on China - Year-over-year growth 2023-2028 (%)
- Exhibits104: Data Table on China - Year-over-year growth 2023-2028 (%)
- Exhibits105: Chart on UK - Market size and forecast 2023-2028 ($ million)
- Exhibits106: Data Table on UK - Market size and forecast 2023-2028 ($ million)
- Exhibits107: Chart on UK - Year-over-year growth 2023-2028 (%)
- Exhibits108: Data Table on UK - Year-over-year growth 2023-2028 (%)
- Exhibits109: Market opportunity By Geographical Landscape ($ million)
- Exhibits110: Data Tables on Market opportunity By Geographical Landscape ($ million)
- Exhibits111: Impact of drivers and challenges in 2023 and 2028
- Exhibits112: Overview on criticality of inputs and factors of differentiation
- Exhibits113: Overview on factors of disruption
- Exhibits114: Impact of key risks on business
- Exhibits115: Companies covered
- Exhibits116: Matrix on companies position and classification
- Exhibits117: Agilent Technologies Inc. - Overview
- Exhibits118: Agilent Technologies Inc. - Business segments
- Exhibits119: Agilent Technologies Inc. - Key news
- Exhibits120: Agilent Technologies Inc. - Key offerings
- Exhibits121: Agilent Technologies Inc. - Segment focus
- Exhibits122: Bio Rad Laboratories Inc. - Overview
- Exhibits123: Bio Rad Laboratories Inc. - Business segments
- Exhibits124: Bio Rad Laboratories Inc. - Key news
- Exhibits125: Bio Rad Laboratories Inc. - Key offerings
- Exhibits126: Bio Rad Laboratories Inc. - Segment focus
- Exhibits127: Congenica Ltd. - Overview
- Exhibits128: Congenica Ltd. - Product / Service
- Exhibits129: Congenica Ltd. - Key offerings
- Exhibits130: DNAnexus Inc. - Overview
- Exhibits131: DNAnexus Inc. - Product / Service
- Exhibits132: DNAnexus Inc. - Key offerings
- Exhibits133: DNASTAR Inc. - Overview
- Exhibits134: DNASTAR Inc. - Product / Service
- Exhibits135: DNASTAR Inc. - Key offerings
- Exhibits136: Eurofins Scientific SE - Overview
- Exhibits137: Eurofins Scientific SE - Business segments
- Exhibits138: Eurofins Scientific SE - Key news
- Exhibits139: Eurofins Scientific SE - Key offerings
- Exhibits140: Eurofins Scientific SE - Segment focus
- Exhibits141: F. Hoffmann La Roche Ltd. - Overview
- Exhibits142: F. Hoffmann La Roche Ltd. - Business segments
- Exhibits143: F. Hoffmann La Roche Ltd. - Key news
- Exhibits144: F. Hoffmann La Roche Ltd. - Key offerings
- Exhibits145: F. Hoffmann La Roche Ltd. - Segment focus
- Exhibits146: Fabric Genomics Inc. - Overview
- Exhibits147: Fabric Genomics Inc. - Product / Service
- Exhibits148: Fabric Genomics Inc. - Key offerings
- Exhibits149: Golden Helix Inc. - Overview
- Exhibits150: Golden Helix Inc. - Product / Service
- Exhibits151: Golden Helix Inc. - Key offerings
- Exhibits152: Illumina Inc. - Overview
- Exhibits153: Illumina Inc. - Business segments
- Exhibits154: Illumina Inc. - Key news
- Exhibits155: Illumina Inc. - Key offerings
- Exhibits156: Illumina Inc. - Segment focus
- Exhibits157: Pacific Biosciences of California Inc. - Overview
- Exhibits158: Pacific Biosciences of California Inc. - Product / Service
- Exhibits159: Pacific Biosciences of California Inc. - Key news
- Exhibits160: Pacific Biosciences of California Inc. - Key offerings
- Exhibits161: Partek Inc. - Overview
- Exhibits162: Partek Inc. - Product / Service
- Exhibits163: Partek Inc. - Key offerings
- Exhibits164: QIAGEN NV - Overview
- Exhibits165: QIAGEN NV - Product / Service
- Exhibits166: QIAGEN NV - Key news
- Exhibits167: QIAGEN NV - Key offerings
- Exhibits168: SciGenom Labs Pvt. Ltd. - Overview
- Exhibits169: SciGenom Labs Pvt. Ltd. - Product / Service
- Exhibits170: SciGenom Labs Pvt. Ltd. - Key offerings
- Exhibits171: Thermo Fisher Scientific Inc. - Overview
- Exhibits172: Thermo Fisher Scientific Inc. - Business segments
- Exhibits173: Thermo Fisher Scientific Inc. - Key news
- Exhibits174: Thermo Fisher Scientific Inc. - Key offerings
- Exhibits175: Thermo Fisher Scientific Inc. - Segment focus
- Exhibits176: Inclusions checklist
- Exhibits177: Exclusions checklist
- Exhibits178: Currency conversion rates for US$
- Exhibits179: Research methodology
- Exhibits180: Information sources
- Exhibits181: Data validation
- Exhibits182: Validation techniques employed for market sizing
- Exhibits183: Data synthesis
- Exhibits184: 360 degree market analysis
- Exhibits185: List of abbreviations
The next generation sequencing data analysis market is forecasted to grow by USD 1902.3 mn during 2023-2028, accelerating at a CAGR of 22.58% during the forecast period. The report on the next generation sequencing data analysis market provides a holistic analysis, market size and forecast, trends, growth drivers, and challenges, as well as vendor analysis covering around 25 vendors.
The report offers an up-to-date analysis regarding the current market scenario, the latest trends and drivers, and the overall market environment. The market is driven by increase in number of strategic partnerships among market vendors to develop NGS data analysis solutions, development of new analytical methods in NGS data analysis, and rising demand for personalized medicine.
Technavio's next generation sequencing data analysis market is segmented as below:
| Market Scope | |
|---|---|
| Base Year | 2024 |
| End Year | 2028 |
| Series Year | 2024-2028 |
| Growth Momentum | Accelerate |
| YOY 2024 | 21.89% |
| CAGR | 22.58% |
| Incremental Value | $1902.3 mn |
By End-user
- Academic research
- Clinical research
- Pharma and biotech entities
- Others
By Product
- Services
- NGS commercial software
By Geographical Landscape
- North America
- Europe
- Asia
- Rest of World (ROW)
This study identifies the advances in NGS techniques as one of the prime reasons driving the next generation sequencing data analysis market growth during the next few years. Also, growing interest in developing real-time and POS NGS data analysis solutions and growing adoption of cloud-based NGS data analysis solutions will lead to sizable demand in the market.
The report on the next generation sequencing data analysis market covers the following areas:
- Next generation sequencing data analysis market sizing
- Next generation sequencing data analysis market forecast
- Next generation sequencing data analysis market industry analysis
The robust vendor analysis is designed to help clients improve their market position, and in line with this, this report provides a detailed analysis of several leading next generation sequencing data analysis market vendors that include Agilent Technologies Inc., Alphabet Inc., BGI Genomics Co. Ltd., Bio RAD Laboratories Inc., Bionivid Technology Pvt. Ltd., Congenica Ltd., Corewell Health, DNAnexus Inc., DNASTAR Inc., Eurofins Scientific SE, F. Hoffmann La Roche Ltd., Fabric Genomics Inc., Golden Helix Inc., HiberCell Inc., Illumina Inc., Invitae Corp., Macrogen Inc., Oxford Nanopore Technologies PLC, Pacific Biosciences of California Inc., Partek Inc., PierianDx Inc., QIAGEN NV, SciGenom Labs Pvt. Ltd., Takara Bio Inc., Thermo Fisher Scientific Inc., and Vela Diagnostics. Also, the next generation sequencing data analysis market analysis report includes information on upcoming trends and challenges that will influence market growth. This is to help companies strategize and leverage all forthcoming growth opportunities.
The study was conducted using an objective combination of primary and secondary information including inputs from key participants in the industry. The report contains a comprehensive market and vendor landscape in addition to an analysis of the key vendors.
The publisher presents a detailed picture of the market by the way of study, synthesis, and summation of data from multiple sources by an analysis of key parameters such as profit, pricing, competition, and promotions. It presents various market facets by identifying the key industry influencers. The data presented is comprehensive, reliable, and a result of extensive research - both primary and secondary. The market research reports provide a complete competitive landscape and an in-depth vendor selection methodology and analysis using qualitative and quantitative research to forecast the accurate market growth.
Table of Contents
1 Executive Summary
- 1.1 Market overview
- Executive Summary - Chart on Market Overview
- Executive Summary - Data Table on Market Overview
- Executive Summary - Chart on Global Market Characteristics
- Executive Summary - Chart on Market By Geographical Landscape
- Executive Summary - Chart on Market Segmentation by End-user
- Executive Summary - Chart on Market Segmentation by Product
- Executive Summary - Chart on Incremental Growth
- Executive Summary - Data Table on Incremental Growth
- Executive Summary - Chart on Company Market Positioning
2 Market Landscape
- 2.1 Market ecosystem
- Parent Market
- Data Table on - Parent Market
- 2.2 Market characteristics
- Market characteristics analysis
- 2.3 Value chain analysis
- Value Chain Analysis
3 Market Sizing
- 3.1 Market definition
- Offerings of companies included in the market definition
- 3.2 Market segment analysis
- Market segments
- 3.3 Market size 2023
- 3.4 Market outlook: Forecast for 2023-2028
- Chart on Global - Market size and forecast 2023-2028 ($ million)
- Data Table on Global - Market size and forecast 2023-2028 ($ million)
- Chart on Global Market: Year-over-year growth 2023-2028 (%)
- Data Table on Global Market: Year-over-year growth 2023-2028 (%)
4 Historic Market Size
- 4.1 Global Next Generation Sequencing Data Analysis Market 2018 - 2022
- Historic Market Size - Data Table on Global Next Generation Sequencing Data Analysis Market 2018 - 2022 ($ million)
- 4.2 End-user segment analysis 2018 - 2022
- Historic Market Size - End-user Segment 2018 - 2022 ($ million)
- 4.3 Product segment analysis 2018 - 2022
- Historic Market Size - Product Segment 2018 - 2022 ($ million)
- 4.4 Geography segment analysis 2018 - 2022
- Historic Market Size - Geography Segment 2018 - 2022 ($ million)
- 4.5 Country segment analysis 2018 - 2022
- Historic Market Size - Country Segment 2018 - 2022 ($ million)
5 Five Forces Analysis
- 5.1 Five forces summary
- Five forces analysis - Comparison between 2023 and 2028
- 5.2 Bargaining power of buyers
- Bargaining power of buyers - Impact of key factors 2023 and 2028
- 5.3 Bargaining power of suppliers
- Bargaining power of suppliers - Impact of key factors in 2023 and 2028
- 5.4 Threat of new entrants
- Threat of new entrants - Impact of key factors in 2023 and 2028
- 5.5 Threat of substitutes
- Threat of substitutes - Impact of key factors in 2023 and 2028
- 5.6 Threat of rivalry
- Threat of rivalry - Impact of key factors in 2023 and 2028
- 5.7 Market condition
- Chart on Market condition - Five forces 2023 and 2028
6 Market Segmentation by End-user
- 6.1 Market segments
- Chart on End-user - Market share 2023-2028 (%)
- Data Table on End-user - Market share 2023-2028 (%)
- 6.2 Comparison by End-user
- Chart on Comparison by End-user
- Data Table on Comparison by End-user
- 6.3 Academic research - Market size and forecast 2023-2028
- Chart on Academic research - Market size and forecast 2023-2028 ($ million)
- Data Table on Academic research - Market size and forecast 2023-2028 ($ million)
- Chart on Academic research - Year-over-year growth 2023-2028 (%)
- Data Table on Academic research - Year-over-year growth 2023-2028 (%)
- 6.4 Clinical research - Market size and forecast 2023-2028
- Chart on Clinical research - Market size and forecast 2023-2028 ($ million)
- Data Table on Clinical research - Market size and forecast 2023-2028 ($ million)
- Chart on Clinical research - Year-over-year growth 2023-2028 (%)
- Data Table on Clinical research - Year-over-year growth 2023-2028 (%)
- 6.5 Pharma and biotech entities - Market size and forecast 2023-2028
- Chart on Pharma and biotech entities - Market size and forecast 2023-2028 ($ million)
- Data Table on Pharma and biotech entities - Market size and forecast 2023-2028 ($ million)
- Chart on Pharma and biotech entities - Year-over-year growth 2023-2028 (%)
- Data Table on Pharma and biotech entities - Year-over-year growth 2023-2028 (%)
- 6.6 Others - Market size and forecast 2023-2028
- Chart on Others - Market size and forecast 2023-2028 ($ million)
- Data Table on Others - Market size and forecast 2023-2028 ($ million)
- Chart on Others - Year-over-year growth 2023-2028 (%)
- Data Table on Others - Year-over-year growth 2023-2028 (%)
- 6.7 Market opportunity by End-user
- Market opportunity by End-user ($ million)
- Data Table on Market opportunity by End-user ($ million)
7 Market Segmentation by Product
- 7.1 Market segments
- Chart on Product - Market share 2023-2028 (%)
- Data Table on Product - Market share 2023-2028 (%)
- 7.2 Comparison by Product
- Chart on Comparison by Product
- Data Table on Comparison by Product
- 7.3 Services - Market size and forecast 2023-2028
- Chart on Services - Market size and forecast 2023-2028 ($ million)
- Data Table on Services - Market size and forecast 2023-2028 ($ million)
- Chart on Services - Year-over-year growth 2023-2028 (%)
- Data Table on Services - Year-over-year growth 2023-2028 (%)
- 7.4 NGS commercial software - Market size and forecast 2023-2028
- Chart on NGS commercial software - Market size and forecast 2023-2028 ($ million)
- Data Table on NGS commercial software - Market size and forecast 2023-2028 ($ million)
- Chart on NGS commercial software - Year-over-year growth 2023-2028 (%)
- Data Table on NGS commercial software - Year-over-year growth 2023-2028 (%)
- 7.5 Market opportunity by Product
- Market opportunity by Product ($ million)
- Data Table on Market opportunity by Product ($ million)
8 Customer Landscape
- 8.1 Customer landscape overview
- Analysis of price sensitivity, lifecycle, customer purchase basket, adoption rates, and purchase criteria
9 Geographic Landscape
- 9.1 Geographic segmentation
- Chart on Market share By Geographical Landscape 2023-2028 (%)
- Data Table on Market share By Geographical Landscape 2023-2028 (%)
- 9.2 Geographic comparison
- Chart on Geographic comparison
- Data Table on Geographic comparison
- 9.3 North America - Market size and forecast 2023-2028
- Chart on North America - Market size and forecast 2023-2028 ($ million)
- Data Table on North America - Market size and forecast 2023-2028 ($ million)
- Chart on North America - Year-over-year growth 2023-2028 (%)
- Data Table on North America - Year-over-year growth 2023-2028 (%)
- 9.4 Europe - Market size and forecast 2023-2028
- Chart on Europe - Market size and forecast 2023-2028 ($ million)
- Data Table on Europe - Market size and forecast 2023-2028 ($ million)
- Chart on Europe - Year-over-year growth 2023-2028 (%)
- Data Table on Europe - Year-over-year growth 2023-2028 (%)
- 9.5 Asia - Market size and forecast 2023-2028
- Chart on Asia - Market size and forecast 2023-2028 ($ million)
- Data Table on Asia - Market size and forecast 2023-2028 ($ million)
- Chart on Asia - Year-over-year growth 2023-2028 (%)
- Data Table on Asia - Year-over-year growth 2023-2028 (%)
- 9.6 Rest of World (ROW) - Market size and forecast 2023-2028
- Chart on Rest of World (ROW) - Market size and forecast 2023-2028 ($ million)
- Data Table on Rest of World (ROW) - Market size and forecast 2023-2028 ($ million)
- Chart on Rest of World (ROW) - Year-over-year growth 2023-2028 (%)
- Data Table on Rest of World (ROW) - Year-over-year growth 2023-2028 (%)
- 9.7 US - Market size and forecast 2023-2028
- Chart on US - Market size and forecast 2023-2028 ($ million)
- Data Table on US - Market size and forecast 2023-2028 ($ million)
- Chart on US - Year-over-year growth 2023-2028 (%)
- Data Table on US - Year-over-year growth 2023-2028 (%)
- 9.8 Germany - Market size and forecast 2023-2028
- Chart on Germany - Market size and forecast 2023-2028 ($ million)
- Data Table on Germany - Market size and forecast 2023-2028 ($ million)
- Chart on Germany - Year-over-year growth 2023-2028 (%)
- Data Table on Germany - Year-over-year growth 2023-2028 (%)
- 9.9 Canada - Market size and forecast 2023-2028
- Chart on Canada - Market size and forecast 2023-2028 ($ million)
- Data Table on Canada - Market size and forecast 2023-2028 ($ million)
- Chart on Canada - Year-over-year growth 2023-2028 (%)
- Data Table on Canada - Year-over-year growth 2023-2028 (%)
- 9.10 China - Market size and forecast 2023-2028
- Chart on China - Market size and forecast 2023-2028 ($ million)
- Data Table on China - Market size and forecast 2023-2028 ($ million)
- Chart on China - Year-over-year growth 2023-2028 (%)
- Data Table on China - Year-over-year growth 2023-2028 (%)
- 9.11 UK - Market size and forecast 2023-2028
- Chart on UK - Market size and forecast 2023-2028 ($ million)
- Data Table on UK - Market size and forecast 2023-2028 ($ million)
- Chart on UK - Year-over-year growth 2023-2028 (%)
- Data Table on UK - Year-over-year growth 2023-2028 (%)
- 9.12 Market opportunity By Geographical Landscape
- Market opportunity By Geographical Landscape ($ million)
- Data Tables on Market opportunity By Geographical Landscape ($ million)
10 Drivers, Challenges, and Opportunity/Restraints
- 10.1 Market drivers
- 10.2 Market challenges
- 10.3 Impact of drivers and challenges
- Impact of drivers and challenges in 2023 and 2028
- 10.4 Market opportunities/restraints
11 Competitive Landscape
- 11.1 Overview
- 11.2 Competitive Landscape
- Overview on criticality of inputs and factors of differentiation
- 11.3 Landscape disruption
- Overview on factors of disruption
- 11.4 Industry risks
- Impact of key risks on business
12 Competitive Analysis
- 12.1 Companies profiled
- Companies covered
- 12.2 Market positioning of companies
- Matrix on companies position and classification
- 12.3 Agilent Technologies Inc.
- Agilent Technologies Inc. - Overview
- Agilent Technologies Inc. - Business segments
- Agilent Technologies Inc. - Key news
- Agilent Technologies Inc. - Key offerings
- Agilent Technologies Inc. - Segment focus
- 12.4 Bio Rad Laboratories Inc.
- Bio Rad Laboratories Inc. - Overview
- Bio Rad Laboratories Inc. - Business segments
- Bio Rad Laboratories Inc. - Key news
- Bio Rad Laboratories Inc. - Key offerings
- Bio Rad Laboratories Inc. - Segment focus
- 12.5 Congenica Ltd.
- Congenica Ltd. - Overview
- Congenica Ltd. - Product / Service
- Congenica Ltd. - Key offerings
- 12.6 DNAnexus Inc.
- DNAnexus Inc. - Overview
- DNAnexus Inc. - Product / Service
- DNAnexus Inc. - Key offerings
- 12.7 DNASTAR Inc.
- DNASTAR Inc. - Overview
- DNASTAR Inc. - Product / Service
- DNASTAR Inc. - Key offerings
- 12.8 Eurofins Scientific SE
- Eurofins Scientific SE - Overview
- Eurofins Scientific SE - Business segments
- Eurofins Scientific SE - Key news
- Eurofins Scientific SE - Key offerings
- Eurofins Scientific SE - Segment focus
- 12.9 F. Hoffmann La Roche Ltd.
- F. Hoffmann La Roche Ltd. - Overview
- F. Hoffmann La Roche Ltd. - Business segments
- F. Hoffmann La Roche Ltd. - Key news
- F. Hoffmann La Roche Ltd. - Key offerings
- F. Hoffmann La Roche Ltd. - Segment focus
- 12.10 Fabric Genomics Inc.
- Fabric Genomics Inc. - Overview
- Fabric Genomics Inc. - Product / Service
- Fabric Genomics Inc. - Key offerings
- 12.11 Golden Helix Inc.
- Golden Helix Inc. - Overview
- Golden Helix Inc. - Product / Service
- Golden Helix Inc. - Key offerings
- 12.12 Illumina Inc.
- Illumina Inc. - Overview
- Illumina Inc. - Business segments
- Illumina Inc. - Key news
- Illumina Inc. - Key offerings
- Illumina Inc. - Segment focus
- 12.13 Pacific Biosciences of California Inc.
- Pacific Biosciences of California Inc. - Overview
- Pacific Biosciences of California Inc. - Product / Service
- Pacific Biosciences of California Inc. - Key news
- Pacific Biosciences of California Inc. - Key offerings
- 12.14 Partek Inc.
- Partek Inc. - Overview
- Partek Inc. - Product / Service
- Partek Inc. - Key offerings
- 12.15 QIAGEN NV
- QIAGEN NV - Overview
- QIAGEN NV - Product / Service
- QIAGEN NV - Key news
- QIAGEN NV - Key offerings
- 12.16 SciGenom Labs Pvt. Ltd.
- SciGenom Labs Pvt. Ltd. - Overview
- SciGenom Labs Pvt. Ltd. - Product / Service
- SciGenom Labs Pvt. Ltd. - Key offerings
- 12.17 Thermo Fisher Scientific Inc.
- Thermo Fisher Scientific Inc. - Overview
- Thermo Fisher Scientific Inc. - Business segments
- Thermo Fisher Scientific Inc. - Key news
- Thermo Fisher Scientific Inc. - Key offerings
- Thermo Fisher Scientific Inc. - Segment focus
13 Appendix
- 13.1 Scope of the report
- 13.2 Inclusions and exclusions checklist
- Inclusions checklist
- Exclusions checklist
- 13.3 Currency conversion rates for US$
- Currency conversion rates for US$
- 13.4 Research methodology
- Research methodology
- 13.5 Data procurement
- Information sources
- 13.6 Data validation
- Data validation
- 13.7 Validation techniques employed for market sizing
- Validation techniques employed for market sizing
- 13.8 Data synthesis
- Data synthesis
- 360 degree market analysis
- 360 degree market analysis
- 13.10 List of abbreviations
- List of abbreviations

