|
|
市場調査レポート
商品コード
1558588
産業用マシンビジョンの世界市場、2024~2028年Global Industrial Machine Vision Market 2024-2028 |
||||||

|
|||||||
カスタマイズ可能
|
|||||||


| 産業用マシンビジョンの世界市場、2024~2028年 |
|
出版日: 2024年08月19日
発行: TechNavio
ページ情報: 英文 160 Pages
納期: 即納可能
|

全表示
- 概要
- 図表
- 目次
産業用マシンビジョン市場は2023~2028年に52億1,980万米ドル、予測期間中のCAGRは9.45%で成長すると予測されます。
当レポートでは、産業用マシンビジョン市場の全体的な分析、市場規模・予測、動向、成長促進要因、課題、約25のベンダーを網羅したベンダー分析などを掲載しています。
現在の市場シナリオ、最新動向と促進要因、市場環境全体に関する最新分析を提供しています。市場は、プロセス制御による運用コストの大幅削減、ビジョンガイデッドロボットシステムに対するニーズの増加、品質試験と自動化に対する需要の高まりによって牽引されています。
| 市場範囲 | |
|---|---|
| 基準年 | 2024年 |
| 終了年 | 2028年 |
| 予測期間 | 2024~2028年 |
| 成長モメンタム | 加速 |
| 前年比[2024年] | 8.42% |
| CAGR | 9.45% |
| 増分額 | 52億1,980万米ドル |
本調査では、今後数年間の産業用マシンビジョン市場成長を牽引する主要要因の1つとして、産業用IoTの需要増加を挙げています。また、ハイブリッド車や電気自動車の製造が増加し、自動車産業におけるマシンビジョンシステムの需要が高まっていることも、市場の大きな需要につながります。
目次
第1章 エグゼクティブサマリー
- 市場概要
第2章 市場情勢
- 市場エコシステム
- 市場の特徴
- バリューチェーン分析
第3章 市場規模の評価
- 市場の定義
- 市場セグメント分析
- 市場規模 2023年
- 市場の展望 2023~2028年
第4章 市場規模実績
- 産業用マシンビジョンの世界市場 2018~2022年
- 製品タイプ別セグメント分析 2018~2022年
- コンポーネント別セグメント分析 2018~2022年
- 地域別セグメント分析 2018~2022年
- 国別セグメント分析 2018~2022年
第5章 ファイブフォース分析
- ファイブフォースの要約
- 買い手の交渉力
- 供給企業の交渉力
- 新規参入業者の脅威
- 代替品の脅威
- 競争の脅威
- 市況
第6章 市場セグメンテーション:製品タイプ別
- 市場セグメンテーション
- 比較:製品タイプ別
- PCベース:市場規模と予測 2023~2028年
- スマートカメラ:市場規模と予測 2023~2028年
- 市場機会:製品タイプ別
第7章 市場セグメンテーション:コンポーネント別
- 市場セグメンテーション
- 比較:コンポーネント別
- ハードウェア:市場規模と予測 2023~2028年
- ソフトウェア:市場規模と予測 2023~2028年
- 市場機会:コンポーネント別
第8章 顧客情勢
- 顧客情勢概要
第9章 地域別情勢
- 地域別セグメンテーション
- 比較:地域別
- アジア太平洋:市場規模と予測 2023~2028年
- 北米:市場規模と予測 2023~2028年
- 欧州:市場規模と予測 2023~2028年
- 中東・アフリカ:市場規模と予測 2023~2028年
- 南米:市場規模と予測 2023~2028年
- 米国:市場規模と予測 2023~2028年
- カナダ:市場規模と予測 2023~2028年
- 中国:市場規模と予測 2023~2028年
- 日本:市場規模と予測 2023~2028年
- ドイツ:市場規模と予測 2023~2028年
- 市場機会:地域情勢別
第10章 促進要因・課題・機会・抑制要因
- 市場促進要因
- 市場課題
- 促進要因と課題の影響
- 市場の機会・抑制要因
第11章 競合情勢
- 概要
- 競合情勢
- 混乱の状況
- 業界のリスク
第12章 競合分析
- 企業プロファイル
- 企業の市場ポジショニング
- Adimec Advanced Image Systems bv
- Allied Vision Technologies GmbH
- AOS Technologies AG
- Basler AG
- Baumer Holding AG
- Cognex Corp.
- Datalogic SpA
- Edmund Optics Inc.
- ifm electronic gmbh
- JAI AS
- Keyence Corp.
- OMRON Corp.
- Sony Group Corp.
- Teledyne Technologies Inc.
- Toshiba Corp.
第13章 付録
Exhibits:
- Exhibits1: Executive Summary - Chart on Market Overview
- Exhibits2: Executive Summary - Data Table on Market Overview
- Exhibits3: Executive Summary - Chart on Global Market Characteristics
- Exhibits4: Executive Summary - Chart on Market By Geographical Landscape
- Exhibits5: Executive Summary - Chart on Market Segmentation by Product Type
- Exhibits6: Executive Summary - Chart on Market Segmentation by Component
- Exhibits7: Executive Summary - Chart on Incremental Growth
- Exhibits8: Executive Summary - Data Table on Incremental Growth
- Exhibits9: Executive Summary - Chart on Company Market Positioning
- Exhibits10: Parent Market
- Exhibits11: Data Table on - Parent Market
- Exhibits12: Market characteristics analysis
- Exhibits13: Value Chain Analysis
- Exhibits14: Offerings of companies included in the market definition
- Exhibits15: Market segments
- Exhibits16: Chart on Global - Market size and forecast 2023-2028 ($ million)
- Exhibits17: Data Table on Global - Market size and forecast 2023-2028 ($ million)
- Exhibits18: Chart on Global Market: Year-over-year growth 2023-2028 (%)
- Exhibits19: Data Table on Global Market: Year-over-year growth 2023-2028 (%)
- Exhibits20: Historic Market Size - Data Table on Global Industrial Machine Vision Market 2018 - 2022 ($ million)
- Exhibits21: Historic Market Size - Product Type Segment 2018 - 2022 ($ million)
- Exhibits22: Historic Market Size - Component Segment 2018 - 2022 ($ million)
- Exhibits23: Historic Market Size - Geography Segment 2018 - 2022 ($ million)
- Exhibits24: Historic Market Size - Country Segment 2018 - 2022 ($ million)
- Exhibits25: Five forces analysis - Comparison between 2023 and 2028
- Exhibits26: Bargaining power of buyers - Impact of key factors 2023 and 2028
- Exhibits27: Bargaining power of suppliers - Impact of key factors in 2023 and 2028
- Exhibits28: Threat of new entrants - Impact of key factors in 2023 and 2028
- Exhibits29: Threat of substitutes - Impact of key factors in 2023 and 2028
- Exhibits30: Threat of rivalry - Impact of key factors in 2023 and 2028
- Exhibits31: Chart on Market condition - Five forces 2023 and 2028
- Exhibits32: Chart on Product Type - Market share 2023-2028 (%)
- Exhibits33: Data Table on Product Type - Market share 2023-2028 (%)
- Exhibits34: Chart on Comparison by Product Type
- Exhibits35: Data Table on Comparison by Product Type
- Exhibits36: Chart on PC-based - Market size and forecast 2023-2028 ($ million)
- Exhibits37: Data Table on PC-based - Market size and forecast 2023-2028 ($ million)
- Exhibits38: Chart on PC-based - Year-over-year growth 2023-2028 (%)
- Exhibits39: Data Table on PC-based - Year-over-year growth 2023-2028 (%)
- Exhibits40: Chart on Smart camera - Market size and forecast 2023-2028 ($ million)
- Exhibits41: Data Table on Smart camera - Market size and forecast 2023-2028 ($ million)
- Exhibits42: Chart on Smart camera - Year-over-year growth 2023-2028 (%)
- Exhibits43: Data Table on Smart camera - Year-over-year growth 2023-2028 (%)
- Exhibits44: Market opportunity by Product Type ($ million)
- Exhibits45: Data Table on Market opportunity by Product Type ($ million)
- Exhibits46: Chart on Component - Market share 2023-2028 (%)
- Exhibits47: Data Table on Component - Market share 2023-2028 (%)
- Exhibits48: Chart on Comparison by Component
- Exhibits49: Data Table on Comparison by Component
- Exhibits50: Chart on Hardware - Market size and forecast 2023-2028 ($ million)
- Exhibits51: Data Table on Hardware - Market size and forecast 2023-2028 ($ million)
- Exhibits52: Chart on Hardware - Year-over-year growth 2023-2028 (%)
- Exhibits53: Data Table on Hardware - Year-over-year growth 2023-2028 (%)
- Exhibits54: Chart on Software - Market size and forecast 2023-2028 ($ million)
- Exhibits55: Data Table on Software - Market size and forecast 2023-2028 ($ million)
- Exhibits56: Chart on Software - Year-over-year growth 2023-2028 (%)
- Exhibits57: Data Table on Software - Year-over-year growth 2023-2028 (%)
- Exhibits58: Market opportunity by Component ($ million)
- Exhibits59: Data Table on Market opportunity by Component ($ million)
- Exhibits60: Analysis of price sensitivity, lifecycle, customer purchase basket, adoption rates, and purchase criteria
- Exhibits61: Chart on Market share By Geographical Landscape 2023-2028 (%)
- Exhibits62: Data Table on Market share By Geographical Landscape 2023-2028 (%)
- Exhibits63: Chart on Geographic comparison
- Exhibits64: Data Table on Geographic comparison
- Exhibits65: Chart on APAC - Market size and forecast 2023-2028 ($ million)
- Exhibits66: Data Table on APAC - Market size and forecast 2023-2028 ($ million)
- Exhibits67: Chart on APAC - Year-over-year growth 2023-2028 (%)
- Exhibits68: Data Table on APAC - Year-over-year growth 2023-2028 (%)
- Exhibits69: Chart on North America - Market size and forecast 2023-2028 ($ million)
- Exhibits70: Data Table on North America - Market size and forecast 2023-2028 ($ million)
- Exhibits71: Chart on North America - Year-over-year growth 2023-2028 (%)
- Exhibits72: Data Table on North America - Year-over-year growth 2023-2028 (%)
- Exhibits73: Chart on Europe - Market size and forecast 2023-2028 ($ million)
- Exhibits74: Data Table on Europe - Market size and forecast 2023-2028 ($ million)
- Exhibits75: Chart on Europe - Year-over-year growth 2023-2028 (%)
- Exhibits76: Data Table on Europe - Year-over-year growth 2023-2028 (%)
- Exhibits77: Chart on Middle East and Africa - Market size and forecast 2023-2028 ($ million)
- Exhibits78: Data Table on Middle East and Africa - Market size and forecast 2023-2028 ($ million)
- Exhibits79: Chart on Middle East and Africa - Year-over-year growth 2023-2028 (%)
- Exhibits80: Data Table on Middle East and Africa - Year-over-year growth 2023-2028 (%)
- Exhibits81: Chart on South America - Market size and forecast 2023-2028 ($ million)
- Exhibits82: Data Table on South America - Market size and forecast 2023-2028 ($ million)
- Exhibits83: Chart on South America - Year-over-year growth 2023-2028 (%)
- Exhibits84: Data Table on South America - Year-over-year growth 2023-2028 (%)
- Exhibits85: Chart on US - Market size and forecast 2023-2028 ($ million)
- Exhibits86: Data Table on US - Market size and forecast 2023-2028 ($ million)
- Exhibits87: Chart on US - Year-over-year growth 2023-2028 (%)
- Exhibits88: Data Table on US - Year-over-year growth 2023-2028 (%)
- Exhibits89: Chart on Canada - Market size and forecast 2023-2028 ($ million)
- Exhibits90: Data Table on Canada - Market size and forecast 2023-2028 ($ million)
- Exhibits91: Chart on Canada - Year-over-year growth 2023-2028 (%)
- Exhibits92: Data Table on Canada - Year-over-year growth 2023-2028 (%)
- Exhibits93: Chart on China - Market size and forecast 2023-2028 ($ million)
- Exhibits94: Data Table on China - Market size and forecast 2023-2028 ($ million)
- Exhibits95: Chart on China - Year-over-year growth 2023-2028 (%)
- Exhibits96: Data Table on China - Year-over-year growth 2023-2028 (%)
- Exhibits97: Chart on Japan - Market size and forecast 2023-2028 ($ million)
- Exhibits98: Data Table on Japan - Market size and forecast 2023-2028 ($ million)
- Exhibits99: Chart on Japan - Year-over-year growth 2023-2028 (%)
- Exhibits100: Data Table on Japan - Year-over-year growth 2023-2028 (%)
- Exhibits101: Chart on Germany - Market size and forecast 2023-2028 ($ million)
- Exhibits102: Data Table on Germany - Market size and forecast 2023-2028 ($ million)
- Exhibits103: Chart on Germany - Year-over-year growth 2023-2028 (%)
- Exhibits104: Data Table on Germany - Year-over-year growth 2023-2028 (%)
- Exhibits105: Market opportunity By Geographical Landscape ($ million)
- Exhibits106: Data Tables on Market opportunity By Geographical Landscape ($ million)
- Exhibits107: Impact of drivers and challenges in 2023 and 2028
- Exhibits108: Overview on criticality of inputs and factors of differentiation
- Exhibits109: Overview on factors of disruption
- Exhibits110: Impact of key risks on business
- Exhibits111: Companies covered
- Exhibits112: Matrix on companies position and classification
- Exhibits113: Adimec Advanced Image Systems bv - Overview
- Exhibits114: Adimec Advanced Image Systems bv - Product / Service
- Exhibits115: Adimec Advanced Image Systems bv - Key news
- Exhibits116: Adimec Advanced Image Systems bv - Key offerings
- Exhibits117: Allied Vision Technologies GmbH - Overview
- Exhibits118: Allied Vision Technologies GmbH - Product / Service
- Exhibits119: Allied Vision Technologies GmbH - Key offerings
- Exhibits120: AOS Technologies AG - Overview
- Exhibits121: AOS Technologies AG - Product / Service
- Exhibits122: AOS Technologies AG - Key offerings
- Exhibits123: Basler AG - Overview
- Exhibits124: Basler AG - Product / Service
- Exhibits125: Basler AG - Key offerings
- Exhibits126: Baumer Holding AG - Overview
- Exhibits127: Baumer Holding AG - Product / Service
- Exhibits128: Baumer Holding AG - Key offerings
- Exhibits129: Cognex Corp. - Overview
- Exhibits130: Cognex Corp. - Product / Service
- Exhibits131: Cognex Corp. - Key news
- Exhibits132: Cognex Corp. - Key offerings
- Exhibits133: Datalogic SpA - Overview
- Exhibits134: Datalogic SpA - Business segments
- Exhibits135: Datalogic SpA - Key news
- Exhibits136: Datalogic SpA - Key offerings
- Exhibits137: Datalogic SpA - Segment focus
- Exhibits138: Edmund Optics Inc. - Overview
- Exhibits139: Edmund Optics Inc. - Key offerings
- Exhibits140: ifm electronic gmbh - Overview
- Exhibits141: ifm electronic gmbh - Product / Service
- Exhibits142: ifm electronic gmbh - Key offerings
- Exhibits143: JAI AS - Overview
- Exhibits144: JAI AS - Product / Service
- Exhibits145: JAI AS - Key offerings
- Exhibits146: Keyence Corp. - Overview
- Exhibits147: Keyence Corp. - Product / Service
- Exhibits148: Keyence Corp. - Key offerings
- Exhibits149: OMRON Corp. - Overview
- Exhibits150: OMRON Corp. - Business segments
- Exhibits151: OMRON Corp. - Key news
- Exhibits152: OMRON Corp. - Key offerings
- Exhibits153: OMRON Corp. - Segment focus
- Exhibits154: Sony Group Corp. - Overview
- Exhibits155: Sony Group Corp. - Business segments
- Exhibits156: Sony Group Corp. - Key news
- Exhibits157: Sony Group Corp. - Key offerings
- Exhibits158: Sony Group Corp. - Segment focus
- Exhibits159: Teledyne Technologies Inc. - Overview
- Exhibits160: Teledyne Technologies Inc. - Business segments
- Exhibits161: Teledyne Technologies Inc. - Key news
- Exhibits162: Teledyne Technologies Inc. - Key offerings
- Exhibits163: Teledyne Technologies Inc. - Segment focus
- Exhibits164: Toshiba Corp. - Overview
- Exhibits165: Toshiba Corp. - Business segments
- Exhibits166: Toshiba Corp. - Key news
- Exhibits167: Toshiba Corp. - Key offerings
- Exhibits168: Toshiba Corp. - Segment focus
- Exhibits169: Inclusions checklist
- Exhibits170: Exclusions checklist
- Exhibits171: Currency conversion rates for US$
- Exhibits172: Research methodology
- Exhibits173: Information sources
- Exhibits174: Data validation
- Exhibits175: Validation techniques employed for market sizing
- Exhibits176: Data synthesis
- Exhibits177: 360 degree market analysis
- Exhibits178: List of abbreviations
The industrial machine vision market is forecasted to grow by USD 5219.8 mn during 2023-2028, accelerating at a CAGR of 9.45% during the forecast period. The report on the industrial machine vision market provides a holistic analysis, market size and forecast, trends, growth drivers, and challenges, as well as vendor analysis covering around 25 vendors.
The report offers an up-to-date analysis regarding the current market scenario, the latest trends and drivers, and the overall market environment. The market is driven by significant cost savings in operation due to process control, increase in need for vision-guided robotic systems, and rise in demand for quality inspection and automation.
Technavio's industrial machine vision market is segmented as below:
| Market Scope | |
|---|---|
| Base Year | 2024 |
| End Year | 2028 |
| Series Year | 2024-2028 |
| Growth Momentum | Accelerate |
| YOY 2024 | 8.42% |
| CAGR | 9.45% |
| Incremental Value | $5219.8 mn |
By Product Type
- PC-based
- Smart camera
By Component
- Hardware
- Software
By Geographical Landscape
- APAC
- North America
- Europe
- Middle East and Africa
- South America
This study identifies the rise in demand for industrial iot as one of the prime reasons driving the industrial machine vision market growth during the next few years. Also, increase in manufacturing of hybrid and electric cars and growing demand for machine vision systems in automotive industry will lead to sizable demand in the market.
The report on the industrial machine vision market covers the following areas:
- Industrial machine vision market sizing
- Industrial machine vision market forecast
- Industrial machine vision market industry analysis
The robust vendor analysis is designed to help clients improve their market position, and in line with this, this report provides a detailed analysis of several leading industrial machine vision market vendors that include Adimec Advanced Image Systems bv, ADLINK Technology Inc., Advantech Co. Ltd., Allied Vision Technologies GmbH, AOS Technologies AG, Basler AG, Baumer Holding AG, Cognex Corp., Datalogic SpA, Edmund Optics Inc., ifm electronic gmbh, iX Cameras Ltd, JAI AS, Keyence Corp., Nippon Electro Sensory Devices Co. Ltd., OMRON Corp., Optronis GmbH, Sony Group Corp., Teledyne Technologies Inc., and Toshiba Corp.. Also, the industrial machine vision market analysis report includes information on upcoming trends and challenges that will influence market growth. This is to help companies strategize and leverage all forthcoming growth opportunities.
The study was conducted using an objective combination of primary and secondary information including inputs from key participants in the industry. The report contains a comprehensive market and vendor landscape in addition to an analysis of the key vendors.
The publisher presents a detailed picture of the market by the way of study, synthesis, and summation of data from multiple sources by an analysis of key parameters such as profit, pricing, competition, and promotions. It presents various market facets by identifying the key industry influencers. The data presented is comprehensive, reliable, and a result of extensive research - both primary and secondary. The market research reports provide a complete competitive landscape and an in-depth vendor selection methodology and analysis using qualitative and quantitative research to forecast the accurate market growth.
Table of Contents
1 Executive Summary
- 1.1 Market overview
- Executive Summary - Chart on Market Overview
- Executive Summary - Data Table on Market Overview
- Executive Summary - Chart on Global Market Characteristics
- Executive Summary - Chart on Market By Geographical Landscape
- Executive Summary - Chart on Market Segmentation by Product Type
- Executive Summary - Chart on Market Segmentation by Component
- Executive Summary - Chart on Incremental Growth
- Executive Summary - Data Table on Incremental Growth
- Executive Summary - Chart on Company Market Positioning
2 Market Landscape
- 2.1 Market ecosystem
- Parent Market
- Data Table on - Parent Market
- 2.2 Market characteristics
- Market characteristics analysis
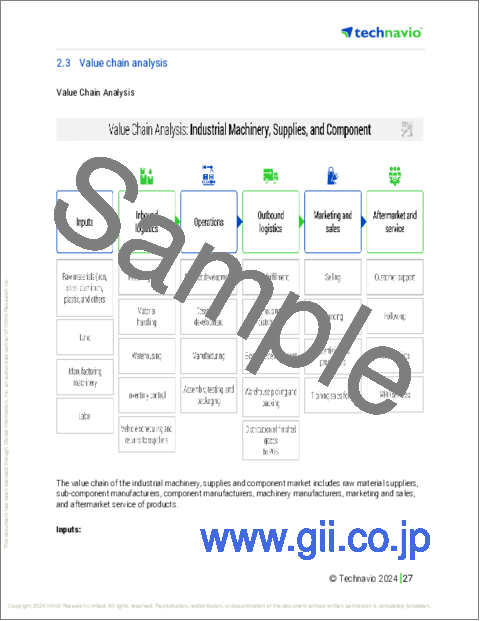
- 2.3 Value chain analysis
- Value Chain Analysis
3 Market Sizing
- 3.1 Market definition
- Offerings of companies included in the market definition
- 3.2 Market segment analysis
- Market segments
- 3.3 Market size 2023
- 3.4 Market outlook: Forecast for 2023-2028
- Chart on Global - Market size and forecast 2023-2028 ($ million)
- Data Table on Global - Market size and forecast 2023-2028 ($ million)
- Chart on Global Market: Year-over-year growth 2023-2028 (%)
- Data Table on Global Market: Year-over-year growth 2023-2028 (%)
4 Historic Market Size
- 4.1 Global Industrial Machine Vision Market 2018 - 2022
- Historic Market Size - Data Table on Global Industrial Machine Vision Market 2018 - 2022 ($ million)
- 4.2 Product Type segment analysis 2018 - 2022
- Historic Market Size - Product Type Segment 2018 - 2022 ($ million)
- 4.3 Component segment analysis 2018 - 2022
- Historic Market Size - Component Segment 2018 - 2022 ($ million)
- 4.4 Geography segment analysis 2018 - 2022
- Historic Market Size - Geography Segment 2018 - 2022 ($ million)
- 4.5 Country segment analysis 2018 - 2022
- Historic Market Size - Country Segment 2018 - 2022 ($ million)
5 Five Forces Analysis
- 5.1 Five forces summary
- Five forces analysis - Comparison between 2023 and 2028
- 5.2 Bargaining power of buyers
- Bargaining power of buyers - Impact of key factors 2023 and 2028
- 5.3 Bargaining power of suppliers
- Bargaining power of suppliers - Impact of key factors in 2023 and 2028
- 5.4 Threat of new entrants
- Threat of new entrants - Impact of key factors in 2023 and 2028
- 5.5 Threat of substitutes
- Threat of substitutes - Impact of key factors in 2023 and 2028
- 5.6 Threat of rivalry
- Threat of rivalry - Impact of key factors in 2023 and 2028
- 5.7 Market condition
- Chart on Market condition - Five forces 2023 and 2028
6 Market Segmentation by Product Type
- 6.1 Market segments
- Chart on Product Type - Market share 2023-2028 (%)
- Data Table on Product Type - Market share 2023-2028 (%)
- 6.2 Comparison by Product Type
- Chart on Comparison by Product Type
- Data Table on Comparison by Product Type
- 6.3 PC-based - Market size and forecast 2023-2028
- Chart on PC-based - Market size and forecast 2023-2028 ($ million)
- Data Table on PC-based - Market size and forecast 2023-2028 ($ million)
- Chart on PC-based - Year-over-year growth 2023-2028 (%)
- Data Table on PC-based - Year-over-year growth 2023-2028 (%)
- 6.4 Smart camera - Market size and forecast 2023-2028
- Chart on Smart camera - Market size and forecast 2023-2028 ($ million)
- Data Table on Smart camera - Market size and forecast 2023-2028 ($ million)
- Chart on Smart camera - Year-over-year growth 2023-2028 (%)
- Data Table on Smart camera - Year-over-year growth 2023-2028 (%)
- 6.5 Market opportunity by Product Type
- Market opportunity by Product Type ($ million)
- Data Table on Market opportunity by Product Type ($ million)
7 Market Segmentation by Component
- 7.1 Market segments
- Chart on Component - Market share 2023-2028 (%)
- Data Table on Component - Market share 2023-2028 (%)
- 7.2 Comparison by Component
- Chart on Comparison by Component
- Data Table on Comparison by Component
- 7.3 Hardware - Market size and forecast 2023-2028
- Chart on Hardware - Market size and forecast 2023-2028 ($ million)
- Data Table on Hardware - Market size and forecast 2023-2028 ($ million)
- Chart on Hardware - Year-over-year growth 2023-2028 (%)
- Data Table on Hardware - Year-over-year growth 2023-2028 (%)
- 7.4 Software - Market size and forecast 2023-2028
- Chart on Software - Market size and forecast 2023-2028 ($ million)
- Data Table on Software - Market size and forecast 2023-2028 ($ million)
- Chart on Software - Year-over-year growth 2023-2028 (%)
- Data Table on Software - Year-over-year growth 2023-2028 (%)
- 7.5 Market opportunity by Component
- Market opportunity by Component ($ million)
- Data Table on Market opportunity by Component ($ million)
8 Customer Landscape
- 8.1 Customer landscape overview
- Analysis of price sensitivity, lifecycle, customer purchase basket, adoption rates, and purchase criteria
9 Geographic Landscape
- 9.1 Geographic segmentation
- Chart on Market share By Geographical Landscape 2023-2028 (%)
- Data Table on Market share By Geographical Landscape 2023-2028 (%)
- 9.2 Geographic comparison
- Chart on Geographic comparison
- Data Table on Geographic comparison
- 9.3 APAC - Market size and forecast 2023-2028
- Chart on APAC - Market size and forecast 2023-2028 ($ million)
- Data Table on APAC - Market size and forecast 2023-2028 ($ million)
- Chart on APAC - Year-over-year growth 2023-2028 (%)
- Data Table on APAC - Year-over-year growth 2023-2028 (%)
- 9.4 North America - Market size and forecast 2023-2028
- Chart on North America - Market size and forecast 2023-2028 ($ million)
- Data Table on North America - Market size and forecast 2023-2028 ($ million)
- Chart on North America - Year-over-year growth 2023-2028 (%)
- Data Table on North America - Year-over-year growth 2023-2028 (%)
- 9.5 Europe - Market size and forecast 2023-2028
- Chart on Europe - Market size and forecast 2023-2028 ($ million)
- Data Table on Europe - Market size and forecast 2023-2028 ($ million)
- Chart on Europe - Year-over-year growth 2023-2028 (%)
- Data Table on Europe - Year-over-year growth 2023-2028 (%)
- 9.6 Middle East and Africa - Market size and forecast 2023-2028
- Chart on Middle East and Africa - Market size and forecast 2023-2028 ($ million)
- Data Table on Middle East and Africa - Market size and forecast 2023-2028 ($ million)
- Chart on Middle East and Africa - Year-over-year growth 2023-2028 (%)
- Data Table on Middle East and Africa - Year-over-year growth 2023-2028 (%)
- 9.7 South America - Market size and forecast 2023-2028
- Chart on South America - Market size and forecast 2023-2028 ($ million)
- Data Table on South America - Market size and forecast 2023-2028 ($ million)
- Chart on South America - Year-over-year growth 2023-2028 (%)
- Data Table on South America - Year-over-year growth 2023-2028 (%)
- 9.8 US - Market size and forecast 2023-2028
- Chart on US - Market size and forecast 2023-2028 ($ million)
- Data Table on US - Market size and forecast 2023-2028 ($ million)
- Chart on US - Year-over-year growth 2023-2028 (%)
- Data Table on US - Year-over-year growth 2023-2028 (%)
- 9.9 Canada - Market size and forecast 2023-2028
- Chart on Canada - Market size and forecast 2023-2028 ($ million)
- Data Table on Canada - Market size and forecast 2023-2028 ($ million)
- Chart on Canada - Year-over-year growth 2023-2028 (%)
- Data Table on Canada - Year-over-year growth 2023-2028 (%)
- 9.10 China - Market size and forecast 2023-2028
- Chart on China - Market size and forecast 2023-2028 ($ million)
- Data Table on China - Market size and forecast 2023-2028 ($ million)
- Chart on China - Year-over-year growth 2023-2028 (%)
- Data Table on China - Year-over-year growth 2023-2028 (%)
- 9.11 Japan - Market size and forecast 2023-2028
- Chart on Japan - Market size and forecast 2023-2028 ($ million)
- Data Table on Japan - Market size and forecast 2023-2028 ($ million)
- Chart on Japan - Year-over-year growth 2023-2028 (%)
- Data Table on Japan - Year-over-year growth 2023-2028 (%)
- 9.12 Germany - Market size and forecast 2023-2028
- Chart on Germany - Market size and forecast 2023-2028 ($ million)
- Data Table on Germany - Market size and forecast 2023-2028 ($ million)
- Chart on Germany - Year-over-year growth 2023-2028 (%)
- Data Table on Germany - Year-over-year growth 2023-2028 (%)
- 9.13 Market opportunity By Geographical Landscape
- Market opportunity By Geographical Landscape ($ million)
- Data Tables on Market opportunity By Geographical Landscape ($ million)
10 Drivers, Challenges, and Opportunity/Restraints
- 10.1 Market drivers
- 10.2 Market challenges
- 10.3 Impact of drivers and challenges
- Impact of drivers and challenges in 2023 and 2028
- 10.4 Market opportunities/restraints
11 Competitive Landscape
- 11.1 Overview
- 11.2 Competitive Landscape
- Overview on criticality of inputs and factors of differentiation
- 11.3 Landscape disruption
- Overview on factors of disruption
- 11.4 Industry risks
- Impact of key risks on business
12 Competitive Analysis
- 12.1 Companies profiled
- Companies covered
- 12.2 Market positioning of companies
- Matrix on companies position and classification
- 12.3 Adimec Advanced Image Systems bv
- Adimec Advanced Image Systems bv - Overview
- Adimec Advanced Image Systems bv - Product / Service
- Adimec Advanced Image Systems bv - Key news
- Adimec Advanced Image Systems bv - Key offerings
- 12.4 Allied Vision Technologies GmbH
- Allied Vision Technologies GmbH - Overview
- Allied Vision Technologies GmbH - Product / Service
- Allied Vision Technologies GmbH - Key offerings
- 12.5 AOS Technologies AG
- AOS Technologies AG - Overview
- AOS Technologies AG - Product / Service
- AOS Technologies AG - Key offerings
- 12.6 Basler AG
- Basler AG - Overview
- Basler AG - Product / Service
- Basler AG - Key offerings
- 12.7 Baumer Holding AG
- Baumer Holding AG - Overview
- Baumer Holding AG - Product / Service
- Baumer Holding AG - Key offerings
- 12.8 Cognex Corp.
- Cognex Corp. - Overview
- Cognex Corp. - Product / Service
- Cognex Corp. - Key news
- Cognex Corp. - Key offerings
- 12.9 Datalogic SpA
- Datalogic SpA - Overview
- Datalogic SpA - Business segments
- Datalogic SpA - Key news
- Datalogic SpA - Key offerings
- Datalogic SpA - Segment focus
- 12.10 Edmund Optics Inc.
- Edmund Optics Inc. - Overview
- Edmund Optics Inc. - Key offerings
- 12.11 ifm electronic gmbh
- ifm electronic gmbh - Overview
- ifm electronic gmbh - Product / Service
- ifm electronic gmbh - Key offerings
- 12.12 JAI AS
- JAI AS - Overview
- JAI AS - Product / Service
- JAI AS - Key offerings
- 12.13 Keyence Corp.
- Keyence Corp. - Overview
- Keyence Corp. - Product / Service
- Keyence Corp. - Key offerings
- 12.14 OMRON Corp.
- OMRON Corp. - Overview
- OMRON Corp. - Business segments
- OMRON Corp. - Key news
- OMRON Corp. - Key offerings
- OMRON Corp. - Segment focus
- 12.15 Sony Group Corp.
- Sony Group Corp. - Overview
- Sony Group Corp. - Business segments
- Sony Group Corp. - Key news
- Sony Group Corp. - Key offerings
- Sony Group Corp. - Segment focus
- 12.16 Teledyne Technologies Inc.
- Teledyne Technologies Inc. - Overview
- Teledyne Technologies Inc. - Business segments
- Teledyne Technologies Inc. - Key news
- Teledyne Technologies Inc. - Key offerings
- Teledyne Technologies Inc. - Segment focus
- 12.17 Toshiba Corp.
- Toshiba Corp. - Overview
- Toshiba Corp. - Business segments
- Toshiba Corp. - Key news
- Toshiba Corp. - Key offerings
- Toshiba Corp. - Segment focus
13 Appendix
- 13.1 Scope of the report
- 13.2 Inclusions and exclusions checklist
- Inclusions checklist
- Exclusions checklist
- 13.3 Currency conversion rates for US$
- Currency conversion rates for US$
- 13.4 Research methodology
- Research methodology
- 13.5 Data procurement
- Information sources
- 13.6 Data validation
- Data validation
- 13.7 Validation techniques employed for market sizing
- Validation techniques employed for market sizing
- 13.8 Data synthesis
- Data synthesis
- 13.9 360 degree market analysis
- 360 degree market analysis
- 13.10 List of abbreviations
- List of abbreviations

