|
|
市場調査レポート
商品コード
1769514
リン鉱石の世界市場 2025年~2029年Global Phosphate Rock Market 2025-2029 |
||||||
|
|||||||
カスタマイズ可能
|
|||||||


| リン鉱石の世界市場 2025年~2029年 |
|
出版日: 2025年07月03日
発行: TechNavio
ページ情報: 英文 214 Pages
納期: 即納可能
|

全表示
- 概要
- 図表
- 目次
リン鉱石市場は2024年~2029年に53億3,850万米ドル、予測期間中のCAGRは4%で成長すると予測されます。
当レポートでは、リン鉱石市場の全体的な分析、市場規模・予測、動向、成長促進要因、課題、約25のベンダーを網羅したベンダー分析などを掲載しています。
現在の市場シナリオ、最新動向と促進要因、市場環境全体に関する最新分析を提供しています。リン酸肥料の需要増加、肥料産業におけるリン鉱石の需要増加、飲食品分野におけるリン鉱石の需要増加などが市場を牽引しています。
| 市場範囲 | |
|---|---|
| 基準年 | 2025年 |
| 終了年 | 2029年 |
| 予測期間 | 2025年~2029年 |
| 成長モメンタム | 加速 |
| 前年比 | 3.6% |
| CAGR | 4% |
| 増分額 | 53億3,850万米ドル |
本調査は、業界の主要参加者からのインプットを含め、一次情報と二次情報を客観的に組み合わせて実施しました。レポートには、主要企業の分析に加え、包括的な市場規模データ、地域別分析によるセグメント、ベンダー情勢が含まれています。レポートには過去データと予測データがあります。
本調査では、今後数年間のリン鉱石市場の成長を促進する主な理由の一つとして、人口の増加を挙げています。また、グリーンリン酸を使用したリン酸アンモニウムの生産と水処理薬品の需要増加が市場の大きな需要につながります。
目次
第1章 エグゼクティブサマリー
- 市場概要
第2章 Technavio分析
- 価格・ライフサイクル・顧客購入バスケット・採用率・購入基準の分析
- インプットの重要性と差別化の要因
- 混乱の要因
- 促進要因と課題の影響
第3章 市場情勢
- 市場エコシステム
- 市場の特徴
- バリューチェーン分析
第4章 市場規模
- 市場の定義
- 市場セグメント分析
- 市場規模 2024年
- 市場の見通し 2024年~2029年
第5章 市場規模実績
- リン鉱石の世界市場 2019年~2023年
- 原料別セグメント分析 2019年~2023年
- 用途別セグメント分析 2019年~2023年
- グレードタイプ別セグメント分析 2019年~2023年
- 地域別セグメント分析 2019年~2023年
- 国別セグメント分析 2019年~2023年
第6章 定性分析
- AIの影響:リン鉱石の世界市場
第7章 ファイブフォース分析
- ファイブフォースの要約
- 買い手の交渉力
- 供給企業の交渉力
- 新規参入業者の脅威
- 代替品の脅威
- 競争の脅威
- 市況
第8章 市場セグメンテーション:原料別
- 市場セグメント
- 比較:原料別
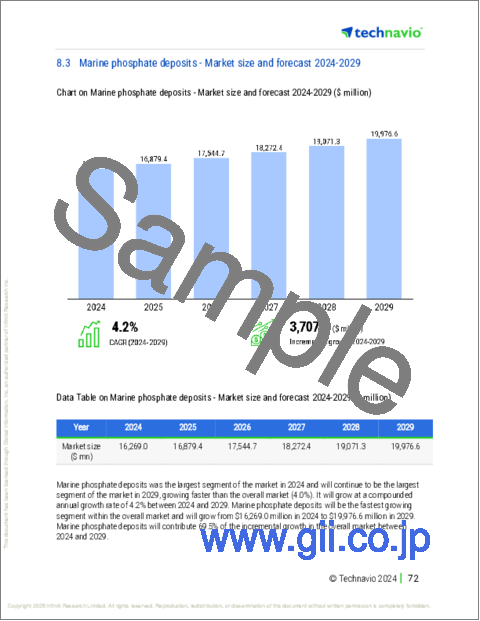
- 海洋リン酸塩鉱床:市場規模と予測 2024年~2029年
- 火成リン酸塩鉱床:市場規模と予測 2024年~2029年
- 変成岩鉱床:市場規模と予測 2024年~2029年
- 生物起源の堆積物:市場規模と予測 2024年~2029年
- 風化した堆積物:市場規模と予測 2024年~2029年
- 市場機会:原料別
第9章 市場セグメンテーション:用途別
- 市場セグメント
- 比較:用途別
- 肥料:市場規模と予測 2024年~2029年
- 動物飼料サプリメント:市場規模と予測 2024年~2029年
- その他:市場規模と予測 2024年~2029年
- 市場機会:用途別
第10章 市場セグメンテーション:グレードタイプ別
- 市場セグメント
- 比較:グレードタイプ別
- 肥料グレード:市場規模と予測 2024年~2029年
- 飼料グレード:市場規模と予測 2024年~2029年
- 工業用グレード:市場規模と予測 2024年~2029年
- 市場機会:グレードタイプ別
第11章 顧客情勢
- 顧客情勢の概要
第12章 地域別情勢
- 地域別セグメンテーション
- 地域別比較
- アジア太平洋:市場規模と予測 2024年~2029年
- 北米:市場規模と予測 2024年~2029年
- 欧州:市場規模と予測 2024年~2029年
- 南米:市場規模と予測 2024年~2029年
- 中東・アフリカ:市場規模と予測 2024年~2029年
- 米国:市場規模と予測 2024年~2029年
- 中国:市場規模と予測 2024年~2029年
- インド:市場規模と予測 2024年~2029年
- ロシア:市場規模と予測 2024年~2029年
- ベトナム:市場規模と予測 2024年~2029年
- カナダ:市場規模と予測 2024年~2029年
- ポーランド:市場規模と予測 2024年~2029年
- インドネシア:市場規模と予測 2024年~2029年
- ブラジル:市場規模と予測 2024年~2029年
- スペイン:市場規模と予測 2024年~2029年
- 市場機会:地域情勢別
第13章 促進要因・課題・機会・抑制要因
- 市場促進要因
- 市場の課題
- 促進要因と課題の影響
- 市場の機会・抑制要因
第14章 競合情勢
- 概要
- 競合情勢
- 混乱の状況
- 業界のリスク
第15章 競合分析
- 企業プロファイル
- 企業ランキング指数
- 企業の市場ポジショニング
- EuroChem Group AG
- Fertoz Ltd.
- Hubei Xingfa Chemicals Group Co. Ltd.
- Innophos Holdings Inc.
- Israel Chemicals Ltd.
- Jordan Phosphate Mines Co. PLC
- Manidharma Biotech Pvt. Ltd.
- Nutrien Ltd.
- OCP Group
- PhosAgro Group of Companies
- Saudi Arabian Mining Co.
- Solvay SA
- The Mosaic Co.
- Yunnan Phosphate Haikou Co. Ltd.
- Yuntianhua Group Co. Ltd.
第16章 付録
Exhibits:
- Exhibits1: Executive Summary - Chart on Market Overview
- Exhibits2: Executive Summary - Data Table on Market Overview
- Exhibits3: Executive Summary - Chart on Global Market Characteristics
- Exhibits4: Executive Summary - Chart on Market By Geographical Landscape
- Exhibits5: Executive Summary - Chart on Market Segmentation by Source
- Exhibits6: Executive Summary - Chart on Market Segmentation by Application
- Exhibits7: Executive Summary - Chart on Market Segmentation by Grade Type
- Exhibits8: Executive Summary - Chart on Incremental Growth
- Exhibits9: Executive Summary - Data Table on Incremental Growth
- Exhibits10: Executive Summary - Chart on Company Market Positioning
- Exhibits11: Analysis of price sensitivity, lifecycle, customer purchase basket, adoption rates, and purchase criteria
- Exhibits12: Overview on criticality of inputs and factors of differentiation
- Exhibits13: Overview on factors of disruption
- Exhibits14: Impact of drivers and challenges in 2024 and 2029
- Exhibits15: Parent Market
- Exhibits16: Data Table on - Parent Market
- Exhibits17: Market characteristics analysis
- Exhibits18: Value chain analysis
- Exhibits19: Offerings of companies included in the market definition
- Exhibits20: Market segments
- Exhibits21: Chart on Global - Market size and forecast 2024-2029 ($ million)
- Exhibits22: Data Table on Global - Market size and forecast 2024-2029 ($ million)
- Exhibits23: Chart on Global Market: Year-over-year growth 2024-2029 (%)
- Exhibits24: Data Table on Global Market: Year-over-year growth 2024-2029 (%)
- Exhibits25: Historic Market Size - Data Table on Global Phosphate Rock Market 2019 - 2023 ($ million)
- Exhibits26: Historic Market Size - Source Segment 2019 - 2023 ($ million)
- Exhibits27: Historic Market Size - Application Segment 2019 - 2023 ($ million)
- Exhibits28: Historic Market Size - Grade Type Segment 2019 - 2023 ($ million)
- Exhibits29: Historic Market Size - Geography Segment 2019 - 2023 ($ million)
- Exhibits30: Historic Market Size - Country Segment 2019 - 2023 ($ million)
- Exhibits31: Five forces analysis - Comparison between 2024 and 2029
- Exhibits32: Bargaining power of buyers - Impact of key factors 2024 and 2029
- Exhibits33: Bargaining power of suppliers - Impact of key factors in 2024 and 2029
- Exhibits34: Threat of new entrants - Impact of key factors in 2024 and 2029
- Exhibits35: Threat of substitutes - Impact of key factors in 2024 and 2029
- Exhibits36: Threat of rivalry - Impact of key factors in 2024 and 2029
- Exhibits37: Chart on Market condition - Five forces 2024 and 2029
- Exhibits38: Chart on Source - Market share 2024-2029 (%)
- Exhibits39: Data Table on Source - Market share 2024-2029 (%)
- Exhibits40: Chart on Comparison by Source
- Exhibits41: Data Table on Comparison by Source
- Exhibits42: Chart on Marine phosphate deposits - Market size and forecast 2024-2029 ($ million)
- Exhibits43: Data Table on Marine phosphate deposits - Market size and forecast 2024-2029 ($ million)
- Exhibits44: Chart on Marine phosphate deposits - Year-over-year growth 2024-2029 (%)
- Exhibits45: Data Table on Marine phosphate deposits - Year-over-year growth 2024-2029 (%)
- Exhibits46: Chart on Igneous phosphate deposits - Market size and forecast 2024-2029 ($ million)
- Exhibits47: Data Table on Igneous phosphate deposits - Market size and forecast 2024-2029 ($ million)
- Exhibits48: Chart on Igneous phosphate deposits - Year-over-year growth 2024-2029 (%)
- Exhibits49: Data Table on Igneous phosphate deposits - Year-over-year growth 2024-2029 (%)
- Exhibits50: Chart on Metamorphic deposits - Market size and forecast 2024-2029 ($ million)
- Exhibits51: Data Table on Metamorphic deposits - Market size and forecast 2024-2029 ($ million)
- Exhibits52: Chart on Metamorphic deposits - Year-over-year growth 2024-2029 (%)
- Exhibits53: Data Table on Metamorphic deposits - Year-over-year growth 2024-2029 (%)
- Exhibits54: Chart on Biogenic deposits - Market size and forecast 2024-2029 ($ million)
- Exhibits55: Data Table on Biogenic deposits - Market size and forecast 2024-2029 ($ million)
- Exhibits56: Chart on Biogenic deposits - Year-over-year growth 2024-2029 (%)
- Exhibits57: Data Table on Biogenic deposits - Year-over-year growth 2024-2029 (%)
- Exhibits58: Chart on Weathered deposits - Market size and forecast 2024-2029 ($ million)
- Exhibits59: Data Table on Weathered deposits - Market size and forecast 2024-2029 ($ million)
- Exhibits60: Chart on Weathered deposits - Year-over-year growth 2024-2029 (%)
- Exhibits61: Data Table on Weathered deposits - Year-over-year growth 2024-2029 (%)
- Exhibits62: Market opportunity by Source ($ million)
- Exhibits63: Data Table on Market opportunity by Source ($ million)
- Exhibits64: Chart on Application - Market share 2024-2029 (%)
- Exhibits65: Data Table on Application - Market share 2024-2029 (%)
- Exhibits66: Chart on Comparison by Application
- Exhibits67: Data Table on Comparison by Application
- Exhibits68: Chart on Fertilizer - Market size and forecast 2024-2029 ($ million)
- Exhibits69: Data Table on Fertilizer - Market size and forecast 2024-2029 ($ million)
- Exhibits70: Chart on Fertilizer - Year-over-year growth 2024-2029 (%)
- Exhibits71: Data Table on Fertilizer - Year-over-year growth 2024-2029 (%)
- Exhibits72: Chart on Animal feed supplement - Market size and forecast 2024-2029 ($ million)
- Exhibits73: Data Table on Animal feed supplement - Market size and forecast 2024-2029 ($ million)
- Exhibits74: Chart on Animal feed supplement - Year-over-year growth 2024-2029 (%)
- Exhibits75: Data Table on Animal feed supplement - Year-over-year growth 2024-2029 (%)
- Exhibits76: Chart on Others - Market size and forecast 2024-2029 ($ million)
- Exhibits77: Data Table on Others - Market size and forecast 2024-2029 ($ million)
- Exhibits78: Chart on Others - Year-over-year growth 2024-2029 (%)
- Exhibits79: Data Table on Others - Year-over-year growth 2024-2029 (%)
- Exhibits80: Market opportunity by Application ($ million)
- Exhibits81: Data Table on Market opportunity by Application ($ million)
- Exhibits82: Chart on Grade Type - Market share 2024-2029 (%)
- Exhibits83: Data Table on Grade Type - Market share 2024-2029 (%)
- Exhibits84: Chart on Comparison by Grade Type
- Exhibits85: Data Table on Comparison by Grade Type
- Exhibits86: Chart on Fertilizer grade - Market size and forecast 2024-2029 ($ million)
- Exhibits87: Data Table on Fertilizer grade - Market size and forecast 2024-2029 ($ million)
- Exhibits88: Chart on Fertilizer grade - Year-over-year growth 2024-2029 (%)
- Exhibits89: Data Table on Fertilizer grade - Year-over-year growth 2024-2029 (%)
- Exhibits90: Chart on Feed grade - Market size and forecast 2024-2029 ($ million)
- Exhibits91: Data Table on Feed grade - Market size and forecast 2024-2029 ($ million)
- Exhibits92: Chart on Feed grade - Year-over-year growth 2024-2029 (%)
- Exhibits93: Data Table on Feed grade - Year-over-year growth 2024-2029 (%)
- Exhibits94: Chart on Industrial grade - Market size and forecast 2024-2029 ($ million)
- Exhibits95: Data Table on Industrial grade - Market size and forecast 2024-2029 ($ million)
- Exhibits96: Chart on Industrial grade - Year-over-year growth 2024-2029 (%)
- Exhibits97: Data Table on Industrial grade - Year-over-year growth 2024-2029 (%)
- Exhibits98: Market opportunity by Grade Type ($ million)
- Exhibits99: Data Table on Market opportunity by Grade Type ($ million)
- Exhibits100: Analysis of price sensitivity, lifecycle, customer purchase basket, adoption rates, and purchase criteria
- Exhibits101: Chart on Market share By Geographical Landscape 2024-2029 (%)
- Exhibits102: Data Table on Market share By Geographical Landscape 2024-2029 (%)
- Exhibits103: Chart on Geographic comparison
- Exhibits104: Data Table on Geographic comparison
- Exhibits105: Chart on APAC - Market size and forecast 2024-2029 ($ million)
- Exhibits106: Data Table on APAC - Market size and forecast 2024-2029 ($ million)
- Exhibits107: Chart on APAC - Year-over-year growth 2024-2029 (%)
- Exhibits108: Data Table on APAC - Year-over-year growth 2024-2029 (%)
- Exhibits109: Chart on North America - Market size and forecast 2024-2029 ($ million)
- Exhibits110: Data Table on North America - Market size and forecast 2024-2029 ($ million)
- Exhibits111: Chart on North America - Year-over-year growth 2024-2029 (%)
- Exhibits112: Data Table on North America - Year-over-year growth 2024-2029 (%)
- Exhibits113: Chart on Europe - Market size and forecast 2024-2029 ($ million)
- Exhibits114: Data Table on Europe - Market size and forecast 2024-2029 ($ million)
- Exhibits115: Chart on Europe - Year-over-year growth 2024-2029 (%)
- Exhibits116: Data Table on Europe - Year-over-year growth 2024-2029 (%)
- Exhibits117: Chart on South America - Market size and forecast 2024-2029 ($ million)
- Exhibits118: Data Table on South America - Market size and forecast 2024-2029 ($ million)
- Exhibits119: Chart on South America - Year-over-year growth 2024-2029 (%)
- Exhibits120: Data Table on South America - Year-over-year growth 2024-2029 (%)
- Exhibits121: Chart on Middle East and Africa - Market size and forecast 2024-2029 ($ million)
- Exhibits122: Data Table on Middle East and Africa - Market size and forecast 2024-2029 ($ million)
- Exhibits123: Chart on Middle East and Africa - Year-over-year growth 2024-2029 (%)
- Exhibits124: Data Table on Middle East and Africa - Year-over-year growth 2024-2029 (%)
- Exhibits125: Chart on US - Market size and forecast 2024-2029 ($ million)
- Exhibits126: Data Table on US - Market size and forecast 2024-2029 ($ million)
- Exhibits127: Chart on US - Year-over-year growth 2024-2029 (%)
- Exhibits128: Data Table on US - Year-over-year growth 2024-2029 (%)
- Exhibits129: Chart on China - Market size and forecast 2024-2029 ($ million)
- Exhibits130: Data Table on China - Market size and forecast 2024-2029 ($ million)
- Exhibits131: Chart on China - Year-over-year growth 2024-2029 (%)
- Exhibits132: Data Table on China - Year-over-year growth 2024-2029 (%)
- Exhibits133: Chart on India - Market size and forecast 2024-2029 ($ million)
- Exhibits134: Data Table on India - Market size and forecast 2024-2029 ($ million)
- Exhibits135: Chart on India - Year-over-year growth 2024-2029 (%)
- Exhibits136: Data Table on India - Year-over-year growth 2024-2029 (%)
- Exhibits137: Chart on Russia - Market size and forecast 2024-2029 ($ million)
- Exhibits138: Data Table on Russia - Market size and forecast 2024-2029 ($ million)
- Exhibits139: Chart on Russia - Year-over-year growth 2024-2029 (%)
- Exhibits140: Data Table on Russia - Year-over-year growth 2024-2029 (%)
- Exhibits141: Chart on Vietnam - Market size and forecast 2024-2029 ($ million)
- Exhibits142: Data Table on Vietnam - Market size and forecast 2024-2029 ($ million)
- Exhibits143: Chart on Vietnam - Year-over-year growth 2024-2029 (%)
- Exhibits144: Data Table on Vietnam - Year-over-year growth 2024-2029 (%)
- Exhibits145: Chart on Canada - Market size and forecast 2024-2029 ($ million)
- Exhibits146: Data Table on Canada - Market size and forecast 2024-2029 ($ million)
- Exhibits147: Chart on Canada - Year-over-year growth 2024-2029 (%)
- Exhibits148: Data Table on Canada - Year-over-year growth 2024-2029 (%)
- Exhibits149: Chart on Poland - Market size and forecast 2024-2029 ($ million)
- Exhibits150: Data Table on Poland - Market size and forecast 2024-2029 ($ million)
- Exhibits151: Chart on Poland - Year-over-year growth 2024-2029 (%)
- Exhibits152: Data Table on Poland - Year-over-year growth 2024-2029 (%)
- Exhibits153: Chart on Indonesia - Market size and forecast 2024-2029 ($ million)
- Exhibits154: Data Table on Indonesia - Market size and forecast 2024-2029 ($ million)
- Exhibits155: Chart on Indonesia - Year-over-year growth 2024-2029 (%)
- Exhibits156: Data Table on Indonesia - Year-over-year growth 2024-2029 (%)
- Exhibits157: Chart on Brazil - Market size and forecast 2024-2029 ($ million)
- Exhibits158: Data Table on Brazil - Market size and forecast 2024-2029 ($ million)
- Exhibits159: Chart on Brazil - Year-over-year growth 2024-2029 (%)
- Exhibits160: Data Table on Brazil - Year-over-year growth 2024-2029 (%)
- Exhibits161: Chart on Spain - Market size and forecast 2024-2029 ($ million)
- Exhibits162: Data Table on Spain - Market size and forecast 2024-2029 ($ million)
- Exhibits163: Chart on Spain - Year-over-year growth 2024-2029 (%)
- Exhibits164: Data Table on Spain - Year-over-year growth 2024-2029 (%)
- Exhibits165: Market opportunity By Geographical Landscape ($ million)
- Exhibits166: Data Tables on Market opportunity By Geographical Landscape ($ million)
- Exhibits167: Impact of drivers and challenges in 2024 and 2029
- Exhibits168: Overview on criticality of inputs and factors of differentiation
- Exhibits169: Overview on factors of disruption
- Exhibits170: Impact of key risks on business
- Exhibits171: Companies covered
- Exhibits172: Company ranking index
- Exhibits173: Matrix on companies position and classification
- Exhibits174: EuroChem Group AG - Overview
- Exhibits175: EuroChem Group AG - Product / Service
- Exhibits176: EuroChem Group AG - Key offerings
- Exhibits177: SWOT
- Exhibits178: Fertoz Ltd. - Overview
- Exhibits179: Fertoz Ltd. - Product / Service
- Exhibits180: Fertoz Ltd. - Key offerings
- Exhibits181: SWOT
- Exhibits182: Hubei Xingfa Chemicals Group Co. Ltd. - Overview
- Exhibits183: Hubei Xingfa Chemicals Group Co. Ltd. - Product / Service
- Exhibits184: Hubei Xingfa Chemicals Group Co. Ltd. - Key offerings
- Exhibits185: SWOT
- Exhibits186: Innophos Holdings Inc. - Overview
- Exhibits187: Innophos Holdings Inc. - Product / Service
- Exhibits188: Innophos Holdings Inc. - Key offerings
- Exhibits189: SWOT
- Exhibits190: Israel Chemicals Ltd. - Overview
- Exhibits191: Israel Chemicals Ltd. - Business segments
- Exhibits192: Israel Chemicals Ltd. - Key offerings
- Exhibits193: Israel Chemicals Ltd. - Segment focus
- Exhibits194: SWOT
- Exhibits195: Jordan Phosphate Mines Co. PLC - Overview
- Exhibits196: Jordan Phosphate Mines Co. PLC - Business segments
- Exhibits197: Jordan Phosphate Mines Co. PLC - Key offerings
- Exhibits198: Jordan Phosphate Mines Co. PLC - Segment focus
- Exhibits199: SWOT
- Exhibits200: Manidharma Biotech Pvt. Ltd. - Overview
- Exhibits201: Manidharma Biotech Pvt. Ltd. - Product / Service
- Exhibits202: Manidharma Biotech Pvt. Ltd. - Key offerings
- Exhibits203: SWOT
- Exhibits204: Nutrien Ltd. - Overview
- Exhibits205: Nutrien Ltd. - Business segments
- Exhibits206: Nutrien Ltd. - Key offerings
- Exhibits207: Nutrien Ltd. - Segment focus
- Exhibits208: SWOT
- Exhibits209: OCP Group - Overview
- Exhibits210: OCP Group - Business segments
- Exhibits211: OCP Group - Key offerings
- Exhibits212: OCP Group - Segment focus
- Exhibits213: SWOT
- Exhibits214: PhosAgro Group of Companies - Overview
- Exhibits215: PhosAgro Group of Companies - Product / Service
- Exhibits216: PhosAgro Group of Companies - Key offerings
- Exhibits217: SWOT
- Exhibits218: Saudi Arabian Mining Co. - Overview
- Exhibits219: Saudi Arabian Mining Co. - Business segments
- Exhibits220: Saudi Arabian Mining Co. - Key news
- Exhibits221: Saudi Arabian Mining Co. - Key offerings
- Exhibits222: Saudi Arabian Mining Co. - Segment focus
- Exhibits223: SWOT
- Exhibits224: Solvay SA - Overview
- Exhibits225: Solvay SA - Business segments
- Exhibits226: Solvay SA - Key news
- Exhibits227: Solvay SA - Key offerings
- Exhibits228: Solvay SA - Segment focus
- Exhibits229: SWOT
- Exhibits230: The Mosaic Co. - Overview
- Exhibits231: The Mosaic Co. - Business segments
- Exhibits232: The Mosaic Co. - Key offerings
- Exhibits233: The Mosaic Co. - Segment focus
- Exhibits234: SWOT
- Exhibits235: Yunnan Phosphate Haikou Co. Ltd. - Overview
- Exhibits236: Yunnan Phosphate Haikou Co. Ltd. - Product / Service
- Exhibits237: Yunnan Phosphate Haikou Co. Ltd. - Key offerings
- Exhibits238: SWOT
- Exhibits239: Yuntianhua Group Co. Ltd. - Overview
- Exhibits240: Yuntianhua Group Co. Ltd. - Product / Service
- Exhibits241: Yuntianhua Group Co. Ltd. - Key offerings
- Exhibits242: SWOT
- Exhibits243: Inclusions checklist
- Exhibits244: Exclusions checklist
- Exhibits245: Currency conversion rates for US$
- Exhibits246: Research methodology
- Exhibits247: Information sources
- Exhibits248: Data validation
- Exhibits249: Validation techniques employed for market sizing
- Exhibits250: Data synthesis
- Exhibits251: 360 degree market analysis
- Exhibits252: List of abbreviations
The phosphate rock market is forecasted to grow by USD 5,338.5 mn during 2024-2029, accelerating at a CAGR of 4% during the forecast period. The report on the phosphate rock market provides a holistic analysis, market size and forecast, trends, growth drivers, and challenges, as well as vendor analysis covering around 25 vendors.
The report offers an up-to-date analysis regarding the current market scenario, the latest trends and drivers, and the overall market environment. The market is driven by rising demand for phosphate fertilizers, rising demand for phosphate rock in fertilizer industry, and growing demand for phosphate rock in food and beverage sector.
| Market Scope | |
|---|---|
| Base Year | 2025 |
| End Year | 2029 |
| Series Year | 2025-2029 |
| Growth Momentum | Accelerate |
| YOY 2025 | 3.6% |
| CAGR | 4% |
| Incremental Value | $5,338.5 mn |
The study was conducted using an objective combination of primary and secondary information including inputs from key participants in the industry. The report contains a comprehensive market size data, segment with regional analysis and vendor landscape in addition to an analysis of the key companies. Reports have historic and forecast data.
Technavio's phosphate rock market is segmented as below:
By Source
- Marine phosphate deposits
- Igneous phosphate deposits
- Metamorphic deposits
- Biogenic deposits
- Weathered deposits
By Application
- Fertilizer
- Animal feed supplement
- Others
By Grade Type
- Fertilizer grade
- Feed grade
- Industrial grade
By Geographical Landscape
- APAC
- North America
- Europe
- South America
- Middle East and Africa
This study identifies the increasing population as one of the prime reasons driving the phosphate rock market growth during the next few years. Also, production of ammonium phosphate using green phosphoric acid and increasing demand for water treatment chemicals will lead to sizable demand in the market.
The report on the phosphate rock market covers the following areas:
- Phosphate Rock Market sizing
- Phosphate Rock Market forecast
- Phosphate Rock Market industry analysis
The robust vendor analysis is designed to help clients improve their market position, and in line with this, this report provides a detailed analysis of several leading phosphate rock market vendors that include Deep Mineral, EuroChem Group AG, Fertoz Ltd., Guizhou Chanhen Chemical Corp., Hubei Xingfa Chemicals Group Co. Ltd., Innophos Holdings Inc., Israel Chemicals Ltd., Jordan Phosphate Mines Co. PLC, Manidharma Biotech Pvt. Ltd., Nutrien Ltd., OCP Group, Oracle Chemicals Pvt. Ltd., PhosAgro Group of Companies, Saudi Arabian Mining Co., Solanki Minerals, Solvay SA, Surya Min Chem, The Mosaic Co., Yunnan Phosphate Haikou Co. Ltd., and Yuntianhua Group Co. Ltd.. Also, the phosphate rock market analysis report includes information on upcoming trends and challenges that will influence market growth. This is to help companies strategize and leverage all forthcoming growth opportunities.
The publisher presents a detailed picture of the market by the way of study, synthesis, and summation of data from multiple sources by an analysis of key parameters such as profit, pricing, competition, and promotions. It presents various market facets by identifying the key industry influencers. The data presented is comprehensive, reliable, and a result of extensive primary and secondary research. The market research reports provide a complete competitive landscape and an in-depth vendor selection methodology and analysis using qualitative and quantitative research to forecast accurate market growth.
Table of Contents
1 Executive Summary
- 1.1 Market overview
- Executive Summary - Chart on Market Overview
- Executive Summary - Data Table on Market Overview
- Executive Summary - Chart on Global Market Characteristics
- Executive Summary - Chart on Market By Geographical Landscape
- Executive Summary - Chart on Market Segmentation by Source
- Executive Summary - Chart on Market Segmentation by Application
- Executive Summary - Chart on Market Segmentation by Grade Type
- Executive Summary - Chart on Incremental Growth
- Executive Summary - Data Table on Incremental Growth
- Executive Summary - Chart on Company Market Positioning
2 Technavio Analysis
- 2.1 Analysis of price sensitivity, lifecycle, customer purchase basket, adoption rates, and purchase criteria
- Analysis of price sensitivity, lifecycle, customer purchase basket, adoption rates, and purchase criteria
- 2.2 Criticality of inputs and Factors of differentiation
- Overview on criticality of inputs and factors of differentiation
- 2.3 Factors of disruption
- Overview on factors of disruption
- 2.4 Impact of drivers and challenges
- Impact of drivers and challenges in 2024 and 2029
3 Market Landscape
- 3.1 Market ecosystem
- Parent Market
- Data Table on - Parent Market
- 3.2 Market characteristics
- Market characteristics analysis
- 3.3 Value chain analysis
- Value chain analysis
4 Market Sizing
- 4.1 Market definition
- Offerings of companies included in the market definition
- 4.2 Market segment analysis
- Market segments
- 4.3 Market size 2024
- 4.4 Market outlook: Forecast for 2024-2029
- Chart on Global - Market size and forecast 2024-2029 ($ million)
- Data Table on Global - Market size and forecast 2024-2029 ($ million)
- Chart on Global Market: Year-over-year growth 2024-2029 (%)
- Data Table on Global Market: Year-over-year growth 2024-2029 (%)
5 Historic Market Size
- 5.1 Global Phosphate Rock Market 2019 - 2023
- Historic Market Size - Data Table on Global Phosphate Rock Market 2019 - 2023 ($ million)
- 5.2 Source segment analysis 2019 - 2023
- Historic Market Size - Source Segment 2019 - 2023 ($ million)
- 5.3 Application segment analysis 2019 - 2023
- Historic Market Size - Application Segment 2019 - 2023 ($ million)
- 5.4 Grade Type segment analysis 2019 - 2023
- Historic Market Size - Grade Type Segment 2019 - 2023 ($ million)
- 5.5 Geography segment analysis 2019 - 2023
- Historic Market Size - Geography Segment 2019 - 2023 ($ million)
- 5.6 Country segment analysis 2019 - 2023
- Historic Market Size - Country Segment 2019 - 2023 ($ million)
6 Qualitative Analysis
- 6.1 The impact of AI in the global phosphate rock market
7 Five Forces Analysis
- 7.1 Five forces summary
- Five forces analysis - Comparison between 2024 and 2029
- 7.2 Bargaining power of buyers
- Bargaining power of buyers - Impact of key factors 2024 and 2029
- 7.3 Bargaining power of suppliers
- Bargaining power of suppliers - Impact of key factors in 2024 and 2029
- 7.4 Threat of new entrants
- Threat of new entrants - Impact of key factors in 2024 and 2029
- 7.5 Threat of substitutes
- Threat of substitutes - Impact of key factors in 2024 and 2029
- 7.6 Threat of rivalry
- Threat of rivalry - Impact of key factors in 2024 and 2029
- 7.7 Market condition
- Chart on Market condition - Five forces 2024 and 2029
8 Market Segmentation by Source
- 8.1 Market segments
- Chart on Source - Market share 2024-2029 (%)
- Data Table on Source - Market share 2024-2029 (%)
- 8.2 Comparison by Source
- Chart on Comparison by Source
- Data Table on Comparison by Source
- 8.3 Marine phosphate deposits - Market size and forecast 2024-2029
- Chart on Marine phosphate deposits - Market size and forecast 2024-2029 ($ million)
- Data Table on Marine phosphate deposits - Market size and forecast 2024-2029 ($ million)
- Chart on Marine phosphate deposits - Year-over-year growth 2024-2029 (%)
- Data Table on Marine phosphate deposits - Year-over-year growth 2024-2029 (%)
- 8.4 Igneous phosphate deposits - Market size and forecast 2024-2029
- Chart on Igneous phosphate deposits - Market size and forecast 2024-2029 ($ million)
- Data Table on Igneous phosphate deposits - Market size and forecast 2024-2029 ($ million)
- Chart on Igneous phosphate deposits - Year-over-year growth 2024-2029 (%)
- Data Table on Igneous phosphate deposits - Year-over-year growth 2024-2029 (%)
- 8.5 Metamorphic deposits - Market size and forecast 2024-2029
- Chart on Metamorphic deposits - Market size and forecast 2024-2029 ($ million)
- Data Table on Metamorphic deposits - Market size and forecast 2024-2029 ($ million)
- Chart on Metamorphic deposits - Year-over-year growth 2024-2029 (%)
- Data Table on Metamorphic deposits - Year-over-year growth 2024-2029 (%)
- 8.6 Biogenic deposits - Market size and forecast 2024-2029
- Chart on Biogenic deposits - Market size and forecast 2024-2029 ($ million)
- Data Table on Biogenic deposits - Market size and forecast 2024-2029 ($ million)
- Chart on Biogenic deposits - Year-over-year growth 2024-2029 (%)
- Data Table on Biogenic deposits - Year-over-year growth 2024-2029 (%)
- 8.7 Weathered deposits - Market size and forecast 2024-2029
- Chart on Weathered deposits - Market size and forecast 2024-2029 ($ million)
- Data Table on Weathered deposits - Market size and forecast 2024-2029 ($ million)
- Chart on Weathered deposits - Year-over-year growth 2024-2029 (%)
- Data Table on Weathered deposits - Year-over-year growth 2024-2029 (%)
- 8.8 Market opportunity by Source
- Market opportunity by Source ($ million)
- Data Table on Market opportunity by Source ($ million)
9 Market Segmentation by Application
- 9.1 Market segments
- Chart on Application - Market share 2024-2029 (%)
- Data Table on Application - Market share 2024-2029 (%)
- 9.2 Comparison by Application
- Chart on Comparison by Application
- Data Table on Comparison by Application
- 9.3 Fertilizer - Market size and forecast 2024-2029
- Chart on Fertilizer - Market size and forecast 2024-2029 ($ million)
- Data Table on Fertilizer - Market size and forecast 2024-2029 ($ million)
- Chart on Fertilizer - Year-over-year growth 2024-2029 (%)
- Data Table on Fertilizer - Year-over-year growth 2024-2029 (%)
- 9.4 Animal feed supplement - Market size and forecast 2024-2029
- Chart on Animal feed supplement - Market size and forecast 2024-2029 ($ million)
- Data Table on Animal feed supplement - Market size and forecast 2024-2029 ($ million)
- Chart on Animal feed supplement - Year-over-year growth 2024-2029 (%)
- Data Table on Animal feed supplement - Year-over-year growth 2024-2029 (%)
- 9.5 Others - Market size and forecast 2024-2029
- Chart on Others - Market size and forecast 2024-2029 ($ million)
- Data Table on Others - Market size and forecast 2024-2029 ($ million)
- Chart on Others - Year-over-year growth 2024-2029 (%)
- Data Table on Others - Year-over-year growth 2024-2029 (%)
- 9.6 Market opportunity by Application
- Market opportunity by Application ($ million)
- Data Table on Market opportunity by Application ($ million)
10 Market Segmentation by Grade Type
- 10.1 Market segments
- Chart on Grade Type - Market share 2024-2029 (%)
- Data Table on Grade Type - Market share 2024-2029 (%)
- 10.2 Comparison by Grade Type
- Chart on Comparison by Grade Type
- Data Table on Comparison by Grade Type
- 10.3 Fertilizer grade - Market size and forecast 2024-2029
- Chart on Fertilizer grade - Market size and forecast 2024-2029 ($ million)
- Data Table on Fertilizer grade - Market size and forecast 2024-2029 ($ million)
- Chart on Fertilizer grade - Year-over-year growth 2024-2029 (%)
- Data Table on Fertilizer grade - Year-over-year growth 2024-2029 (%)
- 10.4 Feed grade - Market size and forecast 2024-2029
- Chart on Feed grade - Market size and forecast 2024-2029 ($ million)
- Data Table on Feed grade - Market size and forecast 2024-2029 ($ million)
- Chart on Feed grade - Year-over-year growth 2024-2029 (%)
- Data Table on Feed grade - Year-over-year growth 2024-2029 (%)
- 10.5 Industrial grade - Market size and forecast 2024-2029
- Chart on Industrial grade - Market size and forecast 2024-2029 ($ million)
- Data Table on Industrial grade - Market size and forecast 2024-2029 ($ million)
- Chart on Industrial grade - Year-over-year growth 2024-2029 (%)
- Data Table on Industrial grade - Year-over-year growth 2024-2029 (%)
- 10.6 Market opportunity by Grade Type
- Market opportunity by Grade Type ($ million)
- Data Table on Market opportunity by Grade Type ($ million)
11 Customer Landscape
- 11.1 Customer landscape overview
- Analysis of price sensitivity, lifecycle, customer purchase basket, adoption rates, and purchase criteria
12 Geographic Landscape
- 12.1 Geographic segmentation
- Chart on Market share By Geographical Landscape 2024-2029 (%)
- Data Table on Market share By Geographical Landscape 2024-2029 (%)
- 12.2 Geographic comparison
- Chart on Geographic comparison
- Data Table on Geographic comparison
- 12.3 APAC - Market size and forecast 2024-2029
- Chart on APAC - Market size and forecast 2024-2029 ($ million)
- Data Table on APAC - Market size and forecast 2024-2029 ($ million)
- Chart on APAC - Year-over-year growth 2024-2029 (%)
- Data Table on APAC - Year-over-year growth 2024-2029 (%)
- 12.4 North America - Market size and forecast 2024-2029
- Chart on North America - Market size and forecast 2024-2029 ($ million)
- Data Table on North America - Market size and forecast 2024-2029 ($ million)
- Chart on North America - Year-over-year growth 2024-2029 (%)
- Data Table on North America - Year-over-year growth 2024-2029 (%)
- 12.5 Europe - Market size and forecast 2024-2029
- Chart on Europe - Market size and forecast 2024-2029 ($ million)
- Data Table on Europe - Market size and forecast 2024-2029 ($ million)
- Chart on Europe - Year-over-year growth 2024-2029 (%)
- Data Table on Europe - Year-over-year growth 2024-2029 (%)
- 12.6 South America - Market size and forecast 2024-2029
- Chart on South America - Market size and forecast 2024-2029 ($ million)
- Data Table on South America - Market size and forecast 2024-2029 ($ million)
- Chart on South America - Year-over-year growth 2024-2029 (%)
- Data Table on South America - Year-over-year growth 2024-2029 (%)
- 12.7 Middle East and Africa - Market size and forecast 2024-2029
- Chart on Middle East and Africa - Market size and forecast 2024-2029 ($ million)
- Data Table on Middle East and Africa - Market size and forecast 2024-2029 ($ million)
- Chart on Middle East and Africa - Year-over-year growth 2024-2029 (%)
- Data Table on Middle East and Africa - Year-over-year growth 2024-2029 (%)
- 12.8 US - Market size and forecast 2024-2029
- Chart on US - Market size and forecast 2024-2029 ($ million)
- Data Table on US - Market size and forecast 2024-2029 ($ million)
- Chart on US - Year-over-year growth 2024-2029 (%)
- Data Table on US - Year-over-year growth 2024-2029 (%)
- 12.9 China - Market size and forecast 2024-2029
- Chart on China - Market size and forecast 2024-2029 ($ million)
- Data Table on China - Market size and forecast 2024-2029 ($ million)
- Chart on China - Year-over-year growth 2024-2029 (%)
- Data Table on China - Year-over-year growth 2024-2029 (%)
- 12.10 India - Market size and forecast 2024-2029
- Chart on India - Market size and forecast 2024-2029 ($ million)
- Data Table on India - Market size and forecast 2024-2029 ($ million)
- Chart on India - Year-over-year growth 2024-2029 (%)
- Data Table on India - Year-over-year growth 2024-2029 (%)
- 12.11 Russia - Market size and forecast 2024-2029
- Chart on Russia - Market size and forecast 2024-2029 ($ million)
- Data Table on Russia - Market size and forecast 2024-2029 ($ million)
- Chart on Russia - Year-over-year growth 2024-2029 (%)
- Data Table on Russia - Year-over-year growth 2024-2029 (%)
- 12.12 Vietnam - Market size and forecast 2024-2029
- Chart on Vietnam - Market size and forecast 2024-2029 ($ million)
- Data Table on Vietnam - Market size and forecast 2024-2029 ($ million)
- Chart on Vietnam - Year-over-year growth 2024-2029 (%)
- Data Table on Vietnam - Year-over-year growth 2024-2029 (%)
- 12.13 Canada - Market size and forecast 2024-2029
- Chart on Canada - Market size and forecast 2024-2029 ($ million)
- Data Table on Canada - Market size and forecast 2024-2029 ($ million)
- Chart on Canada - Year-over-year growth 2024-2029 (%)
- Data Table on Canada - Year-over-year growth 2024-2029 (%)
- 12.14 Poland - Market size and forecast 2024-2029
- Chart on Poland - Market size and forecast 2024-2029 ($ million)
- Data Table on Poland - Market size and forecast 2024-2029 ($ million)
- Chart on Poland - Year-over-year growth 2024-2029 (%)
- Data Table on Poland - Year-over-year growth 2024-2029 (%)
- 12.15 Indonesia - Market size and forecast 2024-2029
- Chart on Indonesia - Market size and forecast 2024-2029 ($ million)
- Data Table on Indonesia - Market size and forecast 2024-2029 ($ million)
- Chart on Indonesia - Year-over-year growth 2024-2029 (%)
- Data Table on Indonesia - Year-over-year growth 2024-2029 (%)
- 12.16 Brazil - Market size and forecast 2024-2029
- Chart on Brazil - Market size and forecast 2024-2029 ($ million)
- Data Table on Brazil - Market size and forecast 2024-2029 ($ million)
- Chart on Brazil - Year-over-year growth 2024-2029 (%)
- Data Table on Brazil - Year-over-year growth 2024-2029 (%)
- 12.17 Spain - Market size and forecast 2024-2029
- Chart on Spain - Market size and forecast 2024-2029 ($ million)
- Data Table on Spain - Market size and forecast 2024-2029 ($ million)
- Chart on Spain - Year-over-year growth 2024-2029 (%)
- Data Table on Spain - Year-over-year growth 2024-2029 (%)
- 12.18 Market opportunity By Geographical Landscape
- Market opportunity By Geographical Landscape ($ million)
- Data Tables on Market opportunity By Geographical Landscape ($ million)
13 Drivers, Challenges, and Opportunity/Restraints
- 13.1 Market drivers
- 13.2 Market challenges
- 13.3 Impact of drivers and challenges
- Impact of drivers and challenges in 2024 and 2029
- 13.4 Market opportunities/restraints
14 Competitive Landscape
- 14.1 Overview
- 14.2 Competitive Landscape
- Overview on criticality of inputs and factors of differentiation
- 14.3 Landscape disruption
- Overview on factors of disruption
- 14.4 Industry risks
- Impact of key risks on business
15 Competitive Analysis
- 15.1 Companies profiled
- Companies covered
- 15.2 Company ranking index
- Company ranking index
- 15.3 Market positioning of companies
- Matrix on companies position and classification
- 15.4 EuroChem Group AG
- EuroChem Group AG - Overview
- EuroChem Group AG - Product / Service
- EuroChem Group AG - Key offerings
- SWOT
- 15.5 Fertoz Ltd.
- Fertoz Ltd. - Overview
- Fertoz Ltd. - Product / Service
- Fertoz Ltd. - Key offerings
- SWOT
- 15.6 Hubei Xingfa Chemicals Group Co. Ltd.
- Hubei Xingfa Chemicals Group Co. Ltd. - Overview
- Hubei Xingfa Chemicals Group Co. Ltd. - Product / Service
- Hubei Xingfa Chemicals Group Co. Ltd. - Key offerings
- SWOT
- 15.7 Innophos Holdings Inc.
- Innophos Holdings Inc. - Overview
- Innophos Holdings Inc. - Product / Service
- Innophos Holdings Inc. - Key offerings
- SWOT
- 15.8 Israel Chemicals Ltd.
- Israel Chemicals Ltd. - Overview
- Israel Chemicals Ltd. - Business segments
- Israel Chemicals Ltd. - Key offerings
- Israel Chemicals Ltd. - Segment focus
- SWOT
- 15.9 Jordan Phosphate Mines Co. PLC
- Jordan Phosphate Mines Co. PLC - Overview
- Jordan Phosphate Mines Co. PLC - Business segments
- Jordan Phosphate Mines Co. PLC - Key offerings
- Jordan Phosphate Mines Co. PLC - Segment focus
- SWOT
- 15.10 Manidharma Biotech Pvt. Ltd.
- Manidharma Biotech Pvt. Ltd. - Overview
- Manidharma Biotech Pvt. Ltd. - Product / Service
- Manidharma Biotech Pvt. Ltd. - Key offerings
- SWOT
- 15.11 Nutrien Ltd.
- Nutrien Ltd. - Overview
- Nutrien Ltd. - Business segments
- Nutrien Ltd. - Key offerings
- Nutrien Ltd. - Segment focus
- SWOT
- 15.12 OCP Group
- OCP Group - Overview
- OCP Group - Business segments
- OCP Group - Key offerings
- OCP Group - Segment focus
- SWOT
- 15.13 PhosAgro Group of Companies
- PhosAgro Group of Companies - Overview
- PhosAgro Group of Companies - Product / Service
- PhosAgro Group of Companies - Key offerings
- SWOT
- 15.14 Saudi Arabian Mining Co.
- Saudi Arabian Mining Co. - Overview
- Saudi Arabian Mining Co. - Business segments
- Saudi Arabian Mining Co. - Key news
- Saudi Arabian Mining Co. - Key offerings
- Saudi Arabian Mining Co. - Segment focus
- SWOT
- 15.15 Solvay SA
- Solvay SA - Overview
- Solvay SA - Business segments
- Solvay SA - Key news
- Solvay SA - Key offerings
- Solvay SA - Segment focus
- SWOT
- 15.16 The Mosaic Co.
- The Mosaic Co. - Overview
- The Mosaic Co. - Business segments
- The Mosaic Co. - Key offerings
- The Mosaic Co. - Segment focus
- SWOT
- 15.17 Yunnan Phosphate Haikou Co. Ltd.
- Yunnan Phosphate Haikou Co. Ltd. - Overview
- Yunnan Phosphate Haikou Co. Ltd. - Product / Service
- Yunnan Phosphate Haikou Co. Ltd. - Key offerings
- SWOT
- 15.18 Yuntianhua Group Co. Ltd.
- Yuntianhua Group Co. Ltd. - Overview
- Yuntianhua Group Co. Ltd. - Product / Service
- Yuntianhua Group Co. Ltd. - Key offerings
- SWOT
16 Appendix
- 16.1 Scope of the report
- 16.2 Inclusions and exclusions checklist
- Inclusions checklist
- Exclusions checklist
- 16.3 Currency conversion rates for US$
- Currency conversion rates for US$
- 16.4 Research methodology
- Research methodology
- 16.5 Data procurement
- Information sources
- 16.6 Data validation
- Data validation
- 16.7 Validation techniques employed for market sizing
- Validation techniques employed for market sizing
- 16.8 Data synthesis
- Data synthesis
- 16.9 360 degree market analysis
- 360 degree market analysis
- 16.10 List of abbreviations
- List of abbreviations

