|
|
市場調査レポート
商品コード
1559416
傾斜掘りの世界市場、2024年~2028年Global Directional Drilling Market 2024-2028 |
||||||

|
|||||||
カスタマイズ可能
|
|||||||


| 傾斜掘りの世界市場、2024年~2028年 |
|
出版日: 2024年08月19日
発行: TechNavio
ページ情報: 英文 149 Pages
納期: 即納可能
|

全表示
- 概要
- 図表
- 目次
傾斜掘り市場は2023-2028年に55億6,670万米ドル、予測期間中のCAGRは9.45%で成長すると予測されます。
当レポートでは、傾斜掘り市場の全体的な分析、市場規模・予測、動向、成長促進要因、課題、約25のベンダーを網羅したベンダー分析などを掲載しています。
現在の市場シナリオ、最新動向と促進要因、市場環境全体に関する最新分析を提供しています。石油・ガスの消費拡大、石油・ガス上流部門への投資増加、非在来型石油・ガスの探査・生産活動への注目の高まりが市場を牽引しています。
| 市場範囲 | |
|---|---|
| 基準年 | 2024 |
| 終了年 | 2028 |
| 予測期間 | 2024-2028 |
| 成長モメンタム | 加速 |
| 前年比2024年 | 8.42% |
| CAGR | 9.45% |
| 増分額 | 55億6,670万米ドル |
本調査では、傾斜掘り技術の自動化が、今後数年間の傾斜掘り市場の成長を促進する主な要因の1つであると指摘しています。また、ベンダーによる戦略的提携の増加や、傾斜掘りの進歩が、市場の大きな需要につながるとしています。
目次
第1章 エグゼクティブサマリー
- 市場概要
第2章 市場情勢
- 市場エコシステム
- 市場の特徴
- バリューチェーン分析
第3章 市場規模の評価
- 市場の定義
- 市場セグメント分析
- 市場規模 2023
- 市場の見通し 2023-2028
第4章 市場規模実績
- 傾斜掘りの世界市場 2018-2022
- 用途別セグメント分析 2018-2022
- 手法別セグメント分析 2018-2022
- 地域別セグメント分析 2018-2022
- 国別セグメント分析 2018-2022
第5章 ファイブフォース分析
- ファイブフォースの要約
- 買い手の交渉力
- 供給企業の交渉力
- 新規参入業者の脅威
- 代替品の脅威
- 競争の脅威
- 市況
第6章 市場セグメンテーション:用途別
- 市場セグメンテーション
- 比較:用途別
- オンショア:市場規模と予測 2023-2028
- オフショア:市場規模と予測 2023-2028
- 市場機会:用途別
第7章 市場セグメンテーション:手法別
- 市場セグメンテーション
- 比較:手法別
- ロータリーステアラブルシステム:市場規模と予測 2023-2028
- 従来の方法:市場規模と予測 2023-2028
- 市場機会:手法別
第8章 顧客情勢
- 顧客情勢の概要
第9章 地域別情勢
- 地域別セグメンテーション
- 地域別比較
- 北米:市場規模と予測 2023-2028
- アジア太平洋:市場規模と予測 2023-2028
- 欧州:市場規模と予測 2023-2028
- 中東・アフリカ:市場規模と予測 2023-2028
- 南米:市場規模と予測 2023-2028
- 米国:市場規模と予測 2023-2028
- 中国:市場規模と予測 2023-2028
- ロシア:市場規模と予測 2023-2028
- インド:市場規模と予測 2023-2028
- 英国:市場規模と予測 2023-2028
- 市場機会:地域情勢別
第10章 促進要因・課題・機会・抑制要因
- 市場促進要因
- 市場の課題
- 促進要因と課題の影響
- 市場の機会・抑制要因
第11章 競合情勢
- 概要
- 競合情勢
- 混乱の状況
- 業界のリスク
第12章 競合分析
- 企業プロファイル
- 企業の市場ポジショニング
- Barbco Inc.
- CHTC Jove Heavy Industry Co.
- Goodeng International
- Granite Construction Inc.
- H.H. Drill Tech Drilling Machinery Co. Ltd.
- Herrenknecht AG
- Jiangsu Dilong Heavy Machinery Co. Ltd.
- Jindal Drilling and Industries Ltd.
- Prime Drilling GmbH
- Radius HDD Direct LLC
- Terra AG
- Tracto Technik GmbH and Co. KG
- Vermeer Corp.
- Xinyu FeiHu Pipeline Technical Equipment Co. Ltd.
- Xuzhou Construction Machinery Group Co. Ltd.
第13章 付録
Exhibits:
- Exhibits1: Executive Summary - Chart on Market Overview
- Exhibits2: Executive Summary - Data Table on Market Overview
- Exhibits3: Executive Summary - Chart on Global Market Characteristics
- Exhibits4: Executive Summary - Chart on Market By Geographical Landscape
- Exhibits5: Executive Summary - Chart on Market Segmentation by Application
- Exhibits6: Executive Summary - Chart on Market Segmentation by Technique
- Exhibits7: Executive Summary - Chart on Incremental Growth
- Exhibits8: Executive Summary - Data Table on Incremental Growth
- Exhibits9: Executive Summary - Chart on Company Market Positioning
- Exhibits10: Parent Market
- Exhibits11: Data Table on - Parent Market
- Exhibits12: Market characteristics analysis
- Exhibits13: Value Chain Analysis
- Exhibits14: Offerings of companies included in the market definition
- Exhibits15: Market segments
- Exhibits16: Chart on Global - Market size and forecast 2023-2028 ($ million)
- Exhibits17: Data Table on Global - Market size and forecast 2023-2028 ($ million)
- Exhibits18: Chart on Global Market: Year-over-year growth 2023-2028 (%)
- Exhibits19: Data Table on Global Market: Year-over-year growth 2023-2028 (%)
- Exhibits20: Historic Market Size - Data Table on Global Directional Drilling Market 2018 - 2022 ($ million)
- Exhibits21: Historic Market Size - Application Segment 2018 - 2022 ($ million)
- Exhibits22: Historic Market Size - Technique Segment 2018 - 2022 ($ million)
- Exhibits23: Historic Market Size - Geography Segment 2018 - 2022 ($ million)
- Exhibits24: Historic Market Size - Country Segment 2018 - 2022 ($ million)
- Exhibits25: Five forces analysis - Comparison between 2023 and 2028
- Exhibits26: Bargaining power of buyers - Impact of key factors 2023 and 2028
- Exhibits27: Bargaining power of suppliers - Impact of key factors in 2023 and 2028
- Exhibits28: Threat of new entrants - Impact of key factors in 2023 and 2028
- Exhibits29: Threat of substitutes - Impact of key factors in 2023 and 2028
- Exhibits30: Threat of rivalry - Impact of key factors in 2023 and 2028
- Exhibits31: Chart on Market condition - Five forces 2023 and 2028
- Exhibits32: Chart on Application - Market share 2023-2028 (%)
- Exhibits33: Data Table on Application - Market share 2023-2028 (%)
- Exhibits34: Chart on Comparison by Application
- Exhibits35: Data Table on Comparison by Application
- Exhibits36: Chart on Onshore - Market size and forecast 2023-2028 ($ million)
- Exhibits37: Data Table on Onshore - Market size and forecast 2023-2028 ($ million)
- Exhibits38: Chart on Onshore - Year-over-year growth 2023-2028 (%)
- Exhibits39: Data Table on Onshore - Year-over-year growth 2023-2028 (%)
- Exhibits40: Chart on Offshore - Market size and forecast 2023-2028 ($ million)
- Exhibits41: Data Table on Offshore - Market size and forecast 2023-2028 ($ million)
- Exhibits42: Chart on Offshore - Year-over-year growth 2023-2028 (%)
- Exhibits43: Data Table on Offshore - Year-over-year growth 2023-2028 (%)
- Exhibits44: Market opportunity by Application ($ million)
- Exhibits45: Data Table on Market opportunity by Application ($ million)
- Exhibits46: Chart on Technique - Market share 2023-2028 (%)
- Exhibits47: Data Table on Technique - Market share 2023-2028 (%)
- Exhibits48: Chart on Comparison by Technique
- Exhibits49: Data Table on Comparison by Technique
- Exhibits50: Chart on Rotary steerable system - Market size and forecast 2023-2028 ($ million)
- Exhibits51: Data Table on Rotary steerable system - Market size and forecast 2023-2028 ($ million)
- Exhibits52: Chart on Rotary steerable system - Year-over-year growth 2023-2028 (%)
- Exhibits53: Data Table on Rotary steerable system - Year-over-year growth 2023-2028 (%)
- Exhibits54: Chart on Conventional methods - Market size and forecast 2023-2028 ($ million)
- Exhibits55: Data Table on Conventional methods - Market size and forecast 2023-2028 ($ million)
- Exhibits56: Chart on Conventional methods - Year-over-year growth 2023-2028 (%)
- Exhibits57: Data Table on Conventional methods - Year-over-year growth 2023-2028 (%)
- Exhibits58: Market opportunity by Technique ($ million)
- Exhibits59: Data Table on Market opportunity by Technique ($ million)
- Exhibits60: Analysis of price sensitivity, lifecycle, customer purchase basket, adoption rates, and purchase criteria
- Exhibits61: Chart on Market share By Geographical Landscape 2023-2028 (%)
- Exhibits62: Data Table on Market share By Geographical Landscape 2023-2028 (%)
- Exhibits63: Chart on Geographic comparison
- Exhibits64: Data Table on Geographic comparison
- Exhibits65: Chart on North America - Market size and forecast 2023-2028 ($ million)
- Exhibits66: Data Table on North America - Market size and forecast 2023-2028 ($ million)
- Exhibits67: Chart on North America - Year-over-year growth 2023-2028 (%)
- Exhibits68: Data Table on North America - Year-over-year growth 2023-2028 (%)
- Exhibits69: Chart on APAC - Market size and forecast 2023-2028 ($ million)
- Exhibits70: Data Table on APAC - Market size and forecast 2023-2028 ($ million)
- Exhibits71: Chart on APAC - Year-over-year growth 2023-2028 (%)
- Exhibits72: Data Table on APAC - Year-over-year growth 2023-2028 (%)
- Exhibits73: Chart on Europe - Market size and forecast 2023-2028 ($ million)
- Exhibits74: Data Table on Europe - Market size and forecast 2023-2028 ($ million)
- Exhibits75: Chart on Europe - Year-over-year growth 2023-2028 (%)
- Exhibits76: Data Table on Europe - Year-over-year growth 2023-2028 (%)
- Exhibits77: Chart on Middle East and Africa - Market size and forecast 2023-2028 ($ million)
- Exhibits78: Data Table on Middle East and Africa - Market size and forecast 2023-2028 ($ million)
- Exhibits79: Chart on Middle East and Africa - Year-over-year growth 2023-2028 (%)
- Exhibits80: Data Table on Middle East and Africa - Year-over-year growth 2023-2028 (%)
- Exhibits81: Chart on South America - Market size and forecast 2023-2028 ($ million)
- Exhibits82: Data Table on South America - Market size and forecast 2023-2028 ($ million)
- Exhibits83: Chart on South America - Year-over-year growth 2023-2028 (%)
- Exhibits84: Data Table on South America - Year-over-year growth 2023-2028 (%)
- Exhibits85: Chart on US - Market size and forecast 2023-2028 ($ million)
- Exhibits86: Data Table on US - Market size and forecast 2023-2028 ($ million)
- Exhibits87: Chart on US - Year-over-year growth 2023-2028 (%)
- Exhibits88: Data Table on US - Year-over-year growth 2023-2028 (%)
- Exhibits89: Chart on China - Market size and forecast 2023-2028 ($ million)
- Exhibits90: Data Table on China - Market size and forecast 2023-2028 ($ million)
- Exhibits91: Chart on China - Year-over-year growth 2023-2028 (%)
- Exhibits92: Data Table on China - Year-over-year growth 2023-2028 (%)
- Exhibits93: Chart on Russia - Market size and forecast 2023-2028 ($ million)
- Exhibits94: Data Table on Russia - Market size and forecast 2023-2028 ($ million)
- Exhibits95: Chart on Russia - Year-over-year growth 2023-2028 (%)
- Exhibits96: Data Table on Russia - Year-over-year growth 2023-2028 (%)
- Exhibits97: Chart on India - Market size and forecast 2023-2028 ($ million)
- Exhibits98: Data Table on India - Market size and forecast 2023-2028 ($ million)
- Exhibits99: Chart on India - Year-over-year growth 2023-2028 (%)
- Exhibits100: Data Table on India - Year-over-year growth 2023-2028 (%)
- Exhibits101: Chart on UK - Market size and forecast 2023-2028 ($ million)
- Exhibits102: Data Table on UK - Market size and forecast 2023-2028 ($ million)
- Exhibits103: Chart on UK - Year-over-year growth 2023-2028 (%)
- Exhibits104: Data Table on UK - Year-over-year growth 2023-2028 (%)
- Exhibits105: Market opportunity By Geographical Landscape ($ million)
- Exhibits106: Data Tables on Market opportunity By Geographical Landscape ($ million)
- Exhibits107: Impact of drivers and challenges in 2023 and 2028
- Exhibits108: Overview on criticality of inputs and factors of differentiation
- Exhibits109: Overview on factors of disruption
- Exhibits110: Impact of key risks on business
- Exhibits111: Companies covered
- Exhibits112: Matrix on companies position and classification
- Exhibits113: Barbco Inc. - Overview
- Exhibits114: Barbco Inc. - Product / Service
- Exhibits115: Barbco Inc. - Key offerings
- Exhibits116: CHTC Jove Heavy Industry Co. - Overview
- Exhibits117: CHTC Jove Heavy Industry Co. - Product / Service
- Exhibits118: CHTC Jove Heavy Industry Co. - Key offerings
- Exhibits119: Goodeng International - Overview
- Exhibits120: Goodeng International - Product / Service
- Exhibits121: Goodeng International - Key offerings
- Exhibits122: Granite Construction Inc. - Overview
- Exhibits123: Granite Construction Inc. - Business segments
- Exhibits124: Granite Construction Inc. - Key news
- Exhibits125: Granite Construction Inc. - Key offerings
- Exhibits126: Granite Construction Inc. - Segment focus
- Exhibits127: H.H. Drill Tech Drilling Machinery Co. Ltd. - Overview
- Exhibits128: H.H. Drill Tech Drilling Machinery Co. Ltd. - Product / Service
- Exhibits129: H.H. Drill Tech Drilling Machinery Co. Ltd. - Key offerings
- Exhibits130: Herrenknecht AG - Overview
- Exhibits131: Herrenknecht AG - Product / Service
- Exhibits132: Herrenknecht AG - Key offerings
- Exhibits133: Jiangsu Dilong Heavy Machinery Co. Ltd. - Overview
- Exhibits134: Jiangsu Dilong Heavy Machinery Co. Ltd. - Product / Service
- Exhibits135: Jiangsu Dilong Heavy Machinery Co. Ltd. - Key offerings
- Exhibits136: Jindal Drilling and Industries Ltd. - Overview
- Exhibits137: Jindal Drilling and Industries Ltd. - Product / Service
- Exhibits138: Jindal Drilling and Industries Ltd. - Key offerings
- Exhibits139: Prime Drilling GmbH - Overview
- Exhibits140: Prime Drilling GmbH - Product / Service
- Exhibits141: Prime Drilling GmbH - Key offerings
- Exhibits142: Radius HDD Direct LLC - Overview
- Exhibits143: Radius HDD Direct LLC - Product / Service
- Exhibits144: Radius HDD Direct LLC - Key offerings
- Exhibits145: Terra AG - Overview
- Exhibits146: Terra AG - Product / Service
- Exhibits147: Terra AG - Key offerings
- Exhibits148: Tracto Technik GmbH and Co. KG - Overview
- Exhibits149: Tracto Technik GmbH and Co. KG - Product / Service
- Exhibits150: Tracto Technik GmbH and Co. KG - Key offerings
- Exhibits151: Vermeer Corp. - Overview
- Exhibits152: Vermeer Corp. - Product / Service
- Exhibits153: Vermeer Corp. - Key offerings
- Exhibits154: Xinyu FeiHu Pipeline Technical Equipment Co. Ltd. - Overview
- Exhibits155: Xinyu FeiHu Pipeline Technical Equipment Co. Ltd. - Product / Service
- Exhibits156: Xinyu FeiHu Pipeline Technical Equipment Co. Ltd. - Key offerings
- Exhibits157: Xuzhou Construction Machinery Group Co. Ltd. - Overview
- Exhibits158: Xuzhou Construction Machinery Group Co. Ltd. - Product / Service
- Exhibits159: Xuzhou Construction Machinery Group Co. Ltd. - Key offerings
- Exhibits160: Inclusions checklist
- Exhibits161: Exclusions checklist
- Exhibits162: Currency conversion rates for US$
- Exhibits163: Research methodology
- Exhibits164: Information sources
- Exhibits165: Data validation
- Exhibits166: Validation techniques employed for market sizing
- Exhibits167: Data synthesis
- Exhibits168: 360 degree market analysis
- Exhibits169: List of abbreviations
The directional drilling market is forecasted to grow by USD 5566.7 mn during 2023-2028, accelerating at a CAGR of 9.45% during the forecast period. The report on the directional drilling market provides a holistic analysis, market size and forecast, trends, growth drivers, and challenges, as well as vendor analysis covering around 25 vendors.
The report offers an up-to-date analysis regarding the current market scenario, the latest trends and drivers, and the overall market environment. The market is driven by growing consumption of oil and gas, rising investments in upstream oil and gas sector, and increasing focus on unconventional oil and gas exploration and production activities.
Technavio's directional drilling market is segmented as below:
| Market Scope | |
|---|---|
| Base Year | 2024 |
| End Year | 2028 |
| Series Year | 2024-2028 |
| Growth Momentum | Accelerate |
| YOY 2024 | 8.42% |
| CAGR | 9.45% |
| Incremental Value | $5566.7 mn |
By Application
- Onshore
- Offshore
By Technique
- Rotary steerable system
- Conventional methods
By Geographical Landscape
- North America
- APAC
- Europe
- Middle East and Africa
- South America
This study identifies the automation in directional drilling technique as one of the prime reasons driving the directional drilling market growth during the next few years. Also, increasing strategic alliances by vendors and growing advancement in directional drilling will lead to sizable demand in the market.
The report on the directional drilling market covers the following areas:
- Directional drilling market sizing
- Directional drilling market forecast
- Directional drilling market industry analysis
The robust vendor analysis is designed to help clients improve their market position, and in line with this, this report provides a detailed analysis of several leading directional drilling market vendors that include Barbco Inc., CHTC Jove Heavy Industry Co., Goodeng International, Granite Construction Inc., H.H. Drill Tech Drilling Machinery Co. Ltd., Halliburton Co., Herrenknecht AG, Jiangsu Dilong Heavy Machinery Co. Ltd., Jindal Drilling and Industries Ltd., Nabors Industries Ltd., NOV Inc., Prime Drilling GmbH, Radius HDD Direct LLC, Schlumberger Ltd., Scientific Drilling International, Terra AG, Tracto Technik GmbH and Co. KG, Vermeer Corp., Xinyu FeiHu Pipeline Technical Equipment Co. Ltd., and Xuzhou Construction Machinery Group Co. Ltd.. Also, the directional drilling market analysis report includes information on upcoming trends and challenges that will influence market growth. This is to help companies strategize and leverage all forthcoming growth opportunities.
The study was conducted using an objective combination of primary and secondary information including inputs from key participants in the industry. The report contains a comprehensive market and vendor landscape in addition to an analysis of the key vendors.
The publisher presents a detailed picture of the market by the way of study, synthesis, and summation of data from multiple sources by an analysis of key parameters such as profit, pricing, competition, and promotions. It presents various market facets by identifying the key industry influencers. The data presented is comprehensive, reliable, and a result of extensive research - both primary and secondary. The market research reports provide a complete competitive landscape and an in-depth vendor selection methodology and analysis using qualitative and quantitative research to forecast the accurate market growth.
Table of Contents
1 Executive Summary
- 1.1 Market overview
- Executive Summary - Chart on Market Overview
- Executive Summary - Data Table on Market Overview
- Executive Summary - Chart on Global Market Characteristics
- Executive Summary - Chart on Market By Geographical Landscape
- Executive Summary - Chart on Market Segmentation by Application
- Executive Summary - Chart on Market Segmentation by Technique
- Executive Summary - Chart on Incremental Growth
- Executive Summary - Data Table on Incremental Growth
- Executive Summary - Chart on Company Market Positioning
2 Market Landscape
- 2.1 Market ecosystem
- Parent Market
- Data Table on - Parent Market
- 2.2 Market characteristics
- Market characteristics analysis
- 2.3 Value chain analysis
- Value Chain Analysis
3 Market Sizing
- 3.1 Market definition
- Offerings of companies included in the market definition
- 3.2 Market segment analysis
- Market segments
- 3.3 Market size 2023
- 3.4 Market outlook: Forecast for 2023-2028
- Chart on Global - Market size and forecast 2023-2028 ($ million)
- Data Table on Global - Market size and forecast 2023-2028 ($ million)
- Chart on Global Market: Year-over-year growth 2023-2028 (%)
- Data Table on Global Market: Year-over-year growth 2023-2028 (%)
4 Historic Market Size
- 4.1 Global Directional Drilling Market 2018 - 2022
- Historic Market Size - Data Table on Global Directional Drilling Market 2018 - 2022 ($ million)
- 4.2 Application segment analysis 2018 - 2022
- Historic Market Size - Application Segment 2018 - 2022 ($ million)
- 4.3 Technique segment analysis 2018 - 2022
- Historic Market Size - Technique Segment 2018 - 2022 ($ million)
- 4.4 Geography segment analysis 2018 - 2022
- Historic Market Size - Geography Segment 2018 - 2022 ($ million)
- 4.5 Country segment analysis 2018 - 2022
- Historic Market Size - Country Segment 2018 - 2022 ($ million)
5 Five Forces Analysis
- 5.1 Five forces summary
- Five forces analysis - Comparison between 2023 and 2028
- 5.2 Bargaining power of buyers
- Bargaining power of buyers - Impact of key factors 2023 and 2028
- 5.3 Bargaining power of suppliers
- Bargaining power of suppliers - Impact of key factors in 2023 and 2028
- 5.4 Threat of new entrants
- Threat of new entrants - Impact of key factors in 2023 and 2028
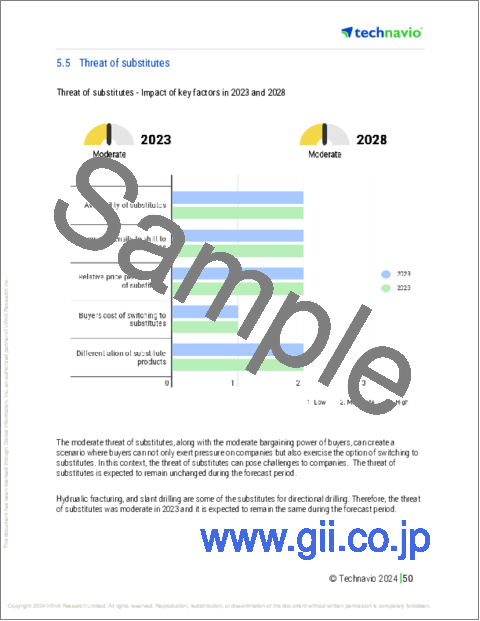
- 5.5 Threat of substitutes
- Threat of substitutes - Impact of key factors in 2023 and 2028
- 5.6 Threat of rivalry
- Threat of rivalry - Impact of key factors in 2023 and 2028
- 5.7 Market condition
- Chart on Market condition - Five forces 2023 and 2028
6 Market Segmentation by Application
- 6.1 Market segments
- Chart on Application - Market share 2023-2028 (%)
- Data Table on Application - Market share 2023-2028 (%)
- 6.2 Comparison by Application
- Chart on Comparison by Application
- Data Table on Comparison by Application
- 6.3 Onshore - Market size and forecast 2023-2028
- Chart on Onshore - Market size and forecast 2023-2028 ($ million)
- Data Table on Onshore - Market size and forecast 2023-2028 ($ million)
- Chart on Onshore - Year-over-year growth 2023-2028 (%)
- Data Table on Onshore - Year-over-year growth 2023-2028 (%)
- 6.4 Offshore - Market size and forecast 2023-2028
- Chart on Offshore - Market size and forecast 2023-2028 ($ million)
- Data Table on Offshore - Market size and forecast 2023-2028 ($ million)
- Chart on Offshore - Year-over-year growth 2023-2028 (%)
- Data Table on Offshore - Year-over-year growth 2023-2028 (%)
- 6.5 Market opportunity by Application
- Market opportunity by Application ($ million)
- Data Table on Market opportunity by Application ($ million)
7 Market Segmentation by Technique
- 7.1 Market segments
- Chart on Technique - Market share 2023-2028 (%)
- Data Table on Technique - Market share 2023-2028 (%)
- 7.2 Comparison by Technique
- Chart on Comparison by Technique
- Data Table on Comparison by Technique
- 7.3 Rotary steerable system - Market size and forecast 2023-2028
- Chart on Rotary steerable system - Market size and forecast 2023-2028 ($ million)
- Data Table on Rotary steerable system - Market size and forecast 2023-2028 ($ million)
- Chart on Rotary steerable system - Year-over-year growth 2023-2028 (%)
- Data Table on Rotary steerable system - Year-over-year growth 2023-2028 (%)
- 7.4 Conventional methods - Market size and forecast 2023-2028
- Chart on Conventional methods - Market size and forecast 2023-2028 ($ million)
- Data Table on Conventional methods - Market size and forecast 2023-2028 ($ million)
- Chart on Conventional methods - Year-over-year growth 2023-2028 (%)
- Data Table on Conventional methods - Year-over-year growth 2023-2028 (%)
- 7.5 Market opportunity by Technique
- Market opportunity by Technique ($ million)
- Data Table on Market opportunity by Technique ($ million)
8 Customer Landscape
- 8.1 Customer landscape overview
- Analysis of price sensitivity, lifecycle, customer purchase basket, adoption rates, and purchase criteria
9 Geographic Landscape
- 9.1 Geographic segmentation
- Chart on Market share By Geographical Landscape 2023-2028 (%)
- Data Table on Market share By Geographical Landscape 2023-2028 (%)
- 9.2 Geographic comparison
- Chart on Geographic comparison
- Data Table on Geographic comparison
- 9.3 North America - Market size and forecast 2023-2028
- Chart on North America - Market size and forecast 2023-2028 ($ million)
- Data Table on North America - Market size and forecast 2023-2028 ($ million)
- Chart on North America - Year-over-year growth 2023-2028 (%)
- Data Table on North America - Year-over-year growth 2023-2028 (%)
- 9.4 APAC - Market size and forecast 2023-2028
- Chart on APAC - Market size and forecast 2023-2028 ($ million)
- Data Table on APAC - Market size and forecast 2023-2028 ($ million)
- Chart on APAC - Year-over-year growth 2023-2028 (%)
- Data Table on APAC - Year-over-year growth 2023-2028 (%)
- 9.5 Europe - Market size and forecast 2023-2028
- Chart on Europe - Market size and forecast 2023-2028 ($ million)
- Data Table on Europe - Market size and forecast 2023-2028 ($ million)
- Chart on Europe - Year-over-year growth 2023-2028 (%)
- Data Table on Europe - Year-over-year growth 2023-2028 (%)
- 9.6 Middle East and Africa - Market size and forecast 2023-2028
- Chart on Middle East and Africa - Market size and forecast 2023-2028 ($ million)
- Data Table on Middle East and Africa - Market size and forecast 2023-2028 ($ million)
- Chart on Middle East and Africa - Year-over-year growth 2023-2028 (%)
- Data Table on Middle East and Africa - Year-over-year growth 2023-2028 (%)
- 9.7 South America - Market size and forecast 2023-2028
- Chart on South America - Market size and forecast 2023-2028 ($ million)
- Data Table on South America - Market size and forecast 2023-2028 ($ million)
- Chart on South America - Year-over-year growth 2023-2028 (%)
- Data Table on South America - Year-over-year growth 2023-2028 (%)
- 9.8 US - Market size and forecast 2023-2028
- Chart on US - Market size and forecast 2023-2028 ($ million)
- Data Table on US - Market size and forecast 2023-2028 ($ million)
- Chart on US - Year-over-year growth 2023-2028 (%)
- Data Table on US - Year-over-year growth 2023-2028 (%)
- 9.9 China - Market size and forecast 2023-2028
- Chart on China - Market size and forecast 2023-2028 ($ million)
- Data Table on China - Market size and forecast 2023-2028 ($ million)
- Chart on China - Year-over-year growth 2023-2028 (%)
- Data Table on China - Year-over-year growth 2023-2028 (%)
- 9.10 Russia - Market size and forecast 2023-2028
- Chart on Russia - Market size and forecast 2023-2028 ($ million)
- Data Table on Russia - Market size and forecast 2023-2028 ($ million)
- Chart on Russia - Year-over-year growth 2023-2028 (%)
- Data Table on Russia - Year-over-year growth 2023-2028 (%)
- 9.11 India - Market size and forecast 2023-2028
- Chart on India - Market size and forecast 2023-2028 ($ million)
- Data Table on India - Market size and forecast 2023-2028 ($ million)
- Chart on India - Year-over-year growth 2023-2028 (%)
- Data Table on India - Year-over-year growth 2023-2028 (%)
- 9.12 UK - Market size and forecast 2023-2028
- Chart on UK - Market size and forecast 2023-2028 ($ million)
- Data Table on UK - Market size and forecast 2023-2028 ($ million)
- Chart on UK - Year-over-year growth 2023-2028 (%)
- Data Table on UK - Year-over-year growth 2023-2028 (%)
- 9.13 Market opportunity By Geographical Landscape
- Market opportunity By Geographical Landscape ($ million)
- Data Tables on Market opportunity By Geographical Landscape ($ million)
10 Drivers, Challenges, and Opportunity/Restraints
- 10.1 Market drivers
- 10.2 Market challenges
- 10.3 Impact of drivers and challenges
- Impact of drivers and challenges in 2023 and 2028
- 10.4 Market opportunities/restraints
11 Competitive Landscape
- 11.1 Overview
- 11.2 Competitive Landscape
- Overview on criticality of inputs and factors of differentiation
- 11.3 Landscape disruption
- Overview on factors of disruption
- 11.4 Industry risks
- Impact of key risks on business
12 Competitive Analysis
- 12.1 Companies profiled
- Companies covered
- 12.2 Market positioning of companies
- Matrix on companies position and classification
- 12.3 Barbco Inc.
- Barbco Inc. - Overview
- Barbco Inc. - Product / Service
- Barbco Inc. - Key offerings
- 12.4 CHTC Jove Heavy Industry Co.
- CHTC Jove Heavy Industry Co. - Overview
- CHTC Jove Heavy Industry Co. - Product / Service
- CHTC Jove Heavy Industry Co. - Key offerings
- 12.5 Goodeng International
- Goodeng International - Overview
- Goodeng International - Product / Service
- Goodeng International - Key offerings
- 12.6 Granite Construction Inc.
- Granite Construction Inc. - Overview
- Granite Construction Inc. - Business segments
- Granite Construction Inc. - Key news
- Granite Construction Inc. - Key offerings
- Granite Construction Inc. - Segment focus
- 12.7 H.H. Drill Tech Drilling Machinery Co. Ltd.
- H.H. Drill Tech Drilling Machinery Co. Ltd. - Overview
- H.H. Drill Tech Drilling Machinery Co. Ltd. - Product / Service
- H.H. Drill Tech Drilling Machinery Co. Ltd. - Key offerings
- 12.8 Herrenknecht AG
- Herrenknecht AG - Overview
- Herrenknecht AG - Product / Service
- Herrenknecht AG - Key offerings
- 12.9 Jiangsu Dilong Heavy Machinery Co. Ltd.
- Jiangsu Dilong Heavy Machinery Co. Ltd. - Overview
- Jiangsu Dilong Heavy Machinery Co. Ltd. - Product / Service
- Jiangsu Dilong Heavy Machinery Co. Ltd. - Key offerings
- 12.10 Jindal Drilling and Industries Ltd.
- Jindal Drilling and Industries Ltd. - Overview
- Jindal Drilling and Industries Ltd. - Product / Service
- Jindal Drilling and Industries Ltd. - Key offerings
- 12.11 Prime Drilling GmbH
- Prime Drilling GmbH - Overview
- Prime Drilling GmbH - Product / Service
- Prime Drilling GmbH - Key offerings
- 12.12 Radius HDD Direct LLC
- Radius HDD Direct LLC - Overview
- Radius HDD Direct LLC - Product / Service
- Radius HDD Direct LLC - Key offerings
- 12.13 Terra AG
- Terra AG - Overview
- Terra AG - Product / Service
- Terra AG - Key offerings
- 12.14 Tracto Technik GmbH and Co. KG
- Tracto Technik GmbH and Co. KG - Overview
- Tracto Technik GmbH and Co. KG - Product / Service
- Tracto Technik GmbH and Co. KG - Key offerings
- 12.15 Vermeer Corp.
- Vermeer Corp. - Overview
- Vermeer Corp. - Product / Service
- Vermeer Corp. - Key offerings
- 12.16 Xinyu FeiHu Pipeline Technical Equipment Co. Ltd.
- Xinyu FeiHu Pipeline Technical Equipment Co. Ltd. - Overview
- Xinyu FeiHu Pipeline Technical Equipment Co. Ltd. - Product / Service
- Xinyu FeiHu Pipeline Technical Equipment Co. Ltd. - Key offerings
- 12.17 Xuzhou Construction Machinery Group Co. Ltd.
- Xuzhou Construction Machinery Group Co. Ltd. - Overview
- Xuzhou Construction Machinery Group Co. Ltd. - Product / Service
- Xuzhou Construction Machinery Group Co. Ltd. - Key offerings
13 Appendix
- 13.1 Scope of the report
- 13.2 Inclusions and exclusions checklist
- Inclusions checklist
- Exclusions checklist
- 13.3 Currency conversion rates for US$
- Currency conversion rates for US$
- 13.4 Research methodology
- Research methodology
- 13.5 Data procurement
- Information sources
- 13.6 Data validation
- Data validation
- 13.7 Validation techniques employed for market sizing
- Validation techniques employed for market sizing
- 13.8 Data synthesis
- Data synthesis
- 13.9 360 degree market analysis
- 360 degree market analysis
- 13.10 List of abbreviations
- List of abbreviations

