|
|
市場調査レポート
商品コード
1634392
製薬機器の世界市場(2025年~2029年)Global Pharmaceutical Equipment Market 2025-2029 |
||||||

|
|||||||
カスタマイズ可能
|
|||||||


| 製薬機器の世界市場(2025年~2029年) |
|
出版日: 2025年01月08日
発行: TechNavio
ページ情報: 英文 208 Pages
納期: 即納可能
|

全表示
- 概要
- 図表
- 目次
製薬機器市場(2025年~2029年)
製薬機器市場は2024年~2029年に63億8,130万米ドル、予測期間中のCAGRは6.9%で成長すると予測されます。この調査レポートは、製薬機器市場の全体分析、市場規模・予測、動向、成長促進要因、課題、約25のベンダーを網羅したベンダー分析などを掲載しています。
現在の市場シナリオ、最新動向と促進要因、市場環境全体に関する最新分析を提供しています。市場は、疾病の蔓延と医薬品需要の増加、ジェネリック医薬品需要の増加、医薬品製造に関連する厳しい規制遵守によって牽引されています。
| 市場範囲 | |
|---|---|
| 基準年 | 2025年 |
| 終了年 | 2029年 |
| 予測期間 | 2025年~2029年 |
| 成長モメンタム | 加速 |
| 前年比2025年 | 6.5% |
| CAGR | 6.9% |
| 増分額 | 63億8,130万米ドル |
本調査では、製薬機器全体の標準化が、今後数年間の製薬機器市場の成長を促進する主な要因の1つであるとしています。また、製薬機器の技術進歩や、ポータブルオンサイト検査装置の需要拡大も、市場の大きな需要につながります。
目次
第1章 エグゼクティブサマリー
- 市場概要
第2章 Technavioによる分析
- 価格・ライフサイクル・顧客購入バスケット・採用率・購入基準の分析
- インプットの重要性と差別化の要因
- 混乱の要因
- 促進要因と課題の影響
第3章 市場情勢
- 市場エコシステム
- 市場の特徴
- バリューチェーン分析
第4章 市場規模
- 市場の定義
- 市場セグメント分析
- 市場規模(2024年)
- 市場の見通し(2024年~2029年)
第5章 市場規模実績
- 製薬機器の世界市場(2019年~2023年)
- 製品タイプセグメント分析(2019年~2023年)
- タイプセグメント分析(2019年~2023年)
- 地域別セグメント分析(2019年~2023年)
- 国別セグメント分析(2019年~2023年)
第6章 定性分析
- AIの影響:製薬機器の世界市場
第7章 ファイブフォース分析
- ファイブフォースの要約
- 買い手の交渉力
- 供給企業の交渉力
- 新規参入業者の脅威
- 代替品の脅威
- 競争の脅威
- 市況
第8章 市場セグメンテーション:製品タイプ別
- 市場セグメント
- 比較:製品タイプ別
- 固体:市場規模と予測(2024年~2029年)
- 液体:市場規模と予測(2024年~2029年)
- 市場機会:製品タイプ別
第9章 市場セグメンテーション:タイプ別
- 市場セグメント
- 比較:タイプ別
- 包装機器:市場規模と予測(2024年~2029年)
- 造粒装置:市場規模と予測(2024年~2029年)
- スプレー乾燥装置:市場規模と予測(2024年~2029年)
- ファイリングマシン:市場規模と予測(2024年~2029年)
- その他:市場規模と予測(2024年~2029年)
- 市場機会:タイプ別
第10章 顧客情勢
- 顧客情勢の概要
第11章 地域別情勢
- 地域別セグメンテーション
- 地域別比較
- 北米:市場規模と予測(2024年~2029年)
- 欧州:市場規模と予測(2024年~2029年)
- アジア:市場規模と予測(2024年~2029年)
- 世界のその他の地域:市場規模と予測(2024年~2029年)
- 米国:市場規模と予測(2024年~2029年)
- 中国:市場規模と予測(2024年~2029年)
- インド:市場規模と予測(2024年~2029年)
- ドイツ:市場規模と予測(2024年~2029年)
- カナダ:市場規模と予測(2024年~2029年)
- 英国:市場規模と予測(2024年~2029年)
- フランス:市場規模と予測(2024年~2029年)
- イタリア:市場規模と予測(2024年~2029年)
- ブラジル:市場規模と予測(2024年~2029年)
- 日本:市場規模と予測(2024年~2029年)
- 市場機会:地域情勢別
第12章 促進要因・課題・機会・抑制要因
- 市場促進要因
- 市場の課題
- 促進要因と課題の影響
- 市場の機会・抑制要因
第13章 競合情勢
- 概要
- 競合情勢
- 混乱の状況
- 業界のリスク
第14章 競合分析
- 企業プロファイル
- 企業ランキング指数
- 企業の市場ポジショニング
- ACG
- ACIC Pharmaceuticals Inc.
- Alfa Laval AB
- Antares Vision S.p.A
- Bausch plus Strobel Maschinenfabrik Ilshofen GmbH plus Co. KG SE
- GEA Group AG
- IMA Industria Macchine Automatiche Spa
- Koerber AG
- Maquinaria Industrial Dara SL
- Marchesini Group Spa
- Merck KGaA
- Romaco Holding GmbH
- Silverson Machines Inc.
- Syntegon Technology GmbH
- Thermo Fisher Scientific Inc.
第15章 付録
Exhibits:
- Exhibits1: Executive Summary - Chart on Market Overview
- Exhibits2: Executive Summary - Data Table on Market Overview
- Exhibits3: Executive Summary - Chart on Global Market Characteristics
- Exhibits4: Executive Summary - Chart on Market By Geographical Landscape
- Exhibits5: Executive Summary - Chart on Market Segmentation by Product Type
- Exhibits6: Executive Summary - Chart on Market Segmentation by Type
- Exhibits7: Executive Summary - Chart on Incremental Growth
- Exhibits8: Executive Summary - Data Table on Incremental Growth
- Exhibits9: Executive Summary - Chart on Company Market Positioning
- Exhibits10: Analysis of price sensitivity, lifecycle, customer purchase basket, adoption rates, and purchase criteria
- Exhibits11: Overview on criticality of inputs and factors of differentiation
- Exhibits12: Overview on factors of disruption
- Exhibits13: Impact of drivers and challenges in 2024 and 2029
- Exhibits14: Parent Market
- Exhibits15: Data Table on - Parent Market
- Exhibits16: Market characteristics analysis
- Exhibits17: Value chain analysis
- Exhibits18: Offerings of companies included in the market definition
- Exhibits19: Market segments
- Exhibits20: Chart on Global - Market size and forecast 2024-2029 ($ million)
- Exhibits21: Data Table on Global - Market size and forecast 2024-2029 ($ million)
- Exhibits22: Chart on Global Market: Year-over-year growth 2024-2029 (%)
- Exhibits23: Data Table on Global Market: Year-over-year growth 2024-2029 (%)
- Exhibits24: Historic Market Size - Data Table on Global Pharmaceutical Equipment Market 2019 - 2023 ($ million)
- Exhibits25: Historic Market Size - Product Type Segment 2019 - 2023 ($ million)
- Exhibits26: Historic Market Size - Type Segment 2019 - 2023 ($ million)
- Exhibits27: Historic Market Size - Geography Segment 2019 - 2023 ($ million)
- Exhibits28: Historic Market Size - Country Segment 2019 - 2023 ($ million)
- Exhibits29: Five forces analysis - Comparison between 2024 and 2029
- Exhibits30: Bargaining power of buyers - Impact of key factors 2024 and 2029
- Exhibits31: Bargaining power of suppliers - Impact of key factors in 2024 and 2029
- Exhibits32: Threat of new entrants - Impact of key factors in 2024 and 2029
- Exhibits33: Threat of substitutes - Impact of key factors in 2024 and 2029
- Exhibits34: Threat of rivalry - Impact of key factors in 2024 and 2029
- Exhibits35: Chart on Market condition - Five forces 2024 and 2029
- Exhibits36: Chart on Product Type - Market share 2024-2029 (%)
- Exhibits37: Data Table on Product Type - Market share 2024-2029 (%)
- Exhibits38: Chart on Comparison by Product Type
- Exhibits39: Data Table on Comparison by Product Type
- Exhibits40: Chart on Solid - Market size and forecast 2024-2029 ($ million)
- Exhibits41: Data Table on Solid - Market size and forecast 2024-2029 ($ million)
- Exhibits42: Chart on Solid - Year-over-year growth 2024-2029 (%)
- Exhibits43: Data Table on Solid - Year-over-year growth 2024-2029 (%)
- Exhibits44: Chart on Liquid - Market size and forecast 2024-2029 ($ million)
- Exhibits45: Data Table on Liquid - Market size and forecast 2024-2029 ($ million)
- Exhibits46: Chart on Liquid - Year-over-year growth 2024-2029 (%)
- Exhibits47: Data Table on Liquid - Year-over-year growth 2024-2029 (%)
- Exhibits48: Market opportunity by Product Type ($ million)
- Exhibits49: Data Table on Market opportunity by Product Type ($ million)
- Exhibits50: Chart on Type - Market share 2024-2029 (%)
- Exhibits51: Data Table on Type - Market share 2024-2029 (%)
- Exhibits52: Chart on Comparison by Type
- Exhibits53: Data Table on Comparison by Type
- Exhibits54: Chart on Packaging equipment - Market size and forecast 2024-2029 ($ million)
- Exhibits55: Data Table on Packaging equipment - Market size and forecast 2024-2029 ($ million)
- Exhibits56: Chart on Packaging equipment - Year-over-year growth 2024-2029 (%)
- Exhibits57: Data Table on Packaging equipment - Year-over-year growth 2024-2029 (%)
- Exhibits58: Chart on Granulating equipment - Market size and forecast 2024-2029 ($ million)
- Exhibits59: Data Table on Granulating equipment - Market size and forecast 2024-2029 ($ million)
- Exhibits60: Chart on Granulating equipment - Year-over-year growth 2024-2029 (%)
- Exhibits61: Data Table on Granulating equipment - Year-over-year growth 2024-2029 (%)
- Exhibits62: Chart on Spray drying equipment - Market size and forecast 2024-2029 ($ million)
- Exhibits63: Data Table on Spray drying equipment - Market size and forecast 2024-2029 ($ million)
- Exhibits64: Chart on Spray drying equipment - Year-over-year growth 2024-2029 (%)
- Exhibits65: Data Table on Spray drying equipment - Year-over-year growth 2024-2029 (%)
- Exhibits66: Chart on Filing machines - Market size and forecast 2024-2029 ($ million)
- Exhibits67: Data Table on Filing machines - Market size and forecast 2024-2029 ($ million)
- Exhibits68: Chart on Filing machines - Year-over-year growth 2024-2029 (%)
- Exhibits69: Data Table on Filing machines - Year-over-year growth 2024-2029 (%)
- Exhibits70: Chart on Others - Market size and forecast 2024-2029 ($ million)
- Exhibits71: Data Table on Others - Market size and forecast 2024-2029 ($ million)
- Exhibits72: Chart on Others - Year-over-year growth 2024-2029 (%)
- Exhibits73: Data Table on Others - Year-over-year growth 2024-2029 (%)
- Exhibits74: Market opportunity by Type ($ million)
- Exhibits75: Data Table on Market opportunity by Type ($ million)
- Exhibits76: Analysis of price sensitivity, lifecycle, customer purchase basket, adoption rates, and purchase criteria
- Exhibits77: Chart on Market share By Geographical Landscape 2024-2029 (%)
- Exhibits78: Data Table on Market share By Geographical Landscape 2024-2029 (%)
- Exhibits79: Chart on Geographic comparison
- Exhibits80: Data Table on Geographic comparison
- Exhibits81: Chart on North America - Market size and forecast 2024-2029 ($ million)
- Exhibits82: Data Table on North America - Market size and forecast 2024-2029 ($ million)
- Exhibits83: Chart on North America - Year-over-year growth 2024-2029 (%)
- Exhibits84: Data Table on North America - Year-over-year growth 2024-2029 (%)
- Exhibits85: Chart on Europe - Market size and forecast 2024-2029 ($ million)
- Exhibits86: Data Table on Europe - Market size and forecast 2024-2029 ($ million)
- Exhibits87: Chart on Europe - Year-over-year growth 2024-2029 (%)
- Exhibits88: Data Table on Europe - Year-over-year growth 2024-2029 (%)
- Exhibits89: Chart on Asia - Market size and forecast 2024-2029 ($ million)
- Exhibits90: Data Table on Asia - Market size and forecast 2024-2029 ($ million)
- Exhibits91: Chart on Asia - Year-over-year growth 2024-2029 (%)
- Exhibits92: Data Table on Asia - Year-over-year growth 2024-2029 (%)
- Exhibits93: Chart on Rest of World (ROW) - Market size and forecast 2024-2029 ($ million)
- Exhibits94: Data Table on Rest of World (ROW) - Market size and forecast 2024-2029 ($ million)
- Exhibits95: Chart on Rest of World (ROW) - Year-over-year growth 2024-2029 (%)
- Exhibits96: Data Table on Rest of World (ROW) - Year-over-year growth 2024-2029 (%)
- Exhibits97: Chart on US - Market size and forecast 2024-2029 ($ million)
- Exhibits98: Data Table on US - Market size and forecast 2024-2029 ($ million)
- Exhibits99: Chart on US - Year-over-year growth 2024-2029 (%)
- Exhibits100: Data Table on US - Year-over-year growth 2024-2029 (%)
- Exhibits101: Chart on China - Market size and forecast 2024-2029 ($ million)
- Exhibits102: Data Table on China - Market size and forecast 2024-2029 ($ million)
- Exhibits103: Chart on China - Year-over-year growth 2024-2029 (%)
- Exhibits104: Data Table on China - Year-over-year growth 2024-2029 (%)
- Exhibits105: Chart on India - Market size and forecast 2024-2029 ($ million)
- Exhibits106: Data Table on India - Market size and forecast 2024-2029 ($ million)
- Exhibits107: Chart on India - Year-over-year growth 2024-2029 (%)
- Exhibits108: Data Table on India - Year-over-year growth 2024-2029 (%)
- Exhibits109: Chart on Germany - Market size and forecast 2024-2029 ($ million)
- Exhibits110: Data Table on Germany - Market size and forecast 2024-2029 ($ million)
- Exhibits111: Chart on Germany - Year-over-year growth 2024-2029 (%)
- Exhibits112: Data Table on Germany - Year-over-year growth 2024-2029 (%)
- Exhibits113: Chart on Canada - Market size and forecast 2024-2029 ($ million)
- Exhibits114: Data Table on Canada - Market size and forecast 2024-2029 ($ million)
- Exhibits115: Chart on Canada - Year-over-year growth 2024-2029 (%)
- Exhibits116: Data Table on Canada - Year-over-year growth 2024-2029 (%)
- Exhibits117: Chart on UK - Market size and forecast 2024-2029 ($ million)
- Exhibits118: Data Table on UK - Market size and forecast 2024-2029 ($ million)
- Exhibits119: Chart on UK - Year-over-year growth 2024-2029 (%)
- Exhibits120: Data Table on UK - Year-over-year growth 2024-2029 (%)
- Exhibits121: Chart on France - Market size and forecast 2024-2029 ($ million)
- Exhibits122: Data Table on France - Market size and forecast 2024-2029 ($ million)
- Exhibits123: Chart on France - Year-over-year growth 2024-2029 (%)
- Exhibits124: Data Table on France - Year-over-year growth 2024-2029 (%)
- Exhibits125: Chart on Italy - Market size and forecast 2024-2029 ($ million)
- Exhibits126: Data Table on Italy - Market size and forecast 2024-2029 ($ million)
- Exhibits127: Chart on Italy - Year-over-year growth 2024-2029 (%)
- Exhibits128: Data Table on Italy - Year-over-year growth 2024-2029 (%)
- Exhibits129: Chart on Brazil - Market size and forecast 2024-2029 ($ million)
- Exhibits130: Data Table on Brazil - Market size and forecast 2024-2029 ($ million)
- Exhibits131: Chart on Brazil - Year-over-year growth 2024-2029 (%)
- Exhibits132: Data Table on Brazil - Year-over-year growth 2024-2029 (%)
- Exhibits133: Chart on Japan - Market size and forecast 2024-2029 ($ million)
- Exhibits134: Data Table on Japan - Market size and forecast 2024-2029 ($ million)
- Exhibits135: Chart on Japan - Year-over-year growth 2024-2029 (%)
- Exhibits136: Data Table on Japan - Year-over-year growth 2024-2029 (%)
- Exhibits137: Market opportunity By Geographical Landscape ($ million)
- Exhibits138: Data Tables on Market opportunity By Geographical Landscape ($ million)
- Exhibits139: Impact of drivers and challenges in 2024 and 2029
- Exhibits140: Overview on criticality of inputs and factors of differentiation
- Exhibits141: Overview on factors of disruption
- Exhibits142: Impact of key risks on business
- Exhibits143: Companies covered
- Exhibits144: Company ranking index
- Exhibits145: Matrix on companies position and classification
- Exhibits146: ACG - Overview
- Exhibits147: ACG - Product / Service
- Exhibits148: ACG - Key offerings
- Exhibits149: SWOT
- Exhibits150: ACIC Pharmaceuticals Inc. - Overview
- Exhibits151: ACIC Pharmaceuticals Inc. - Product / Service
- Exhibits152: ACIC Pharmaceuticals Inc. - Key offerings
- Exhibits153: SWOT
- Exhibits154: Alfa Laval AB - Overview
- Exhibits155: Alfa Laval AB - Business segments
- Exhibits156: Alfa Laval AB - Key news
- Exhibits157: Alfa Laval AB - Key offerings
- Exhibits158: Alfa Laval AB - Segment focus
- Exhibits159: SWOT
- Exhibits160: Antares Vision S.p.A - Overview
- Exhibits161: Antares Vision S.p.A - Product / Service
- Exhibits162: Antares Vision S.p.A - Key offerings
- Exhibits163: SWOT
- Exhibits164: Bausch plus Strobel Maschinenfabrik Ilshofen GmbH plus Co. KG SE - Overview
- Exhibits165: Bausch plus Strobel Maschinenfabrik Ilshofen GmbH plus Co. KG SE - Product / Service
- Exhibits166: Bausch plus Strobel Maschinenfabrik Ilshofen GmbH plus Co. KG SE - Key offerings
- Exhibits167: SWOT
- Exhibits168: GEA Group AG - Overview
- Exhibits169: GEA Group AG - Business segments
- Exhibits170: GEA Group AG - Key offerings
- Exhibits171: GEA Group AG - Segment focus
- Exhibits172: SWOT
- Exhibits173: IMA Industria Macchine Automatiche Spa - Overview
- Exhibits174: IMA Industria Macchine Automatiche Spa - Product / Service
- Exhibits175: IMA Industria Macchine Automatiche Spa - Key offerings
- Exhibits176: SWOT
- Exhibits177: Koerber AG - Overview
- Exhibits178: Koerber AG - Product / Service
- Exhibits179: Koerber AG - Key offerings
- Exhibits180: SWOT
- Exhibits181: Maquinaria Industrial Dara SL - Overview
- Exhibits182: Maquinaria Industrial Dara SL - Product / Service
- Exhibits183: Maquinaria Industrial Dara SL - Key offerings
- Exhibits184: SWOT
- Exhibits185: Marchesini Group Spa - Overview
- Exhibits186: Marchesini Group Spa - Product / Service
- Exhibits187: Marchesini Group Spa - Key offerings
- Exhibits188: SWOT
- Exhibits189: Merck KGaA - Overview
- Exhibits190: Merck KGaA - Business segments
- Exhibits191: Merck KGaA - Key news
- Exhibits192: Merck KGaA - Key offerings
- Exhibits193: Merck KGaA - Segment focus
- Exhibits194: SWOT
- Exhibits195: Romaco Holding GmbH - Overview
- Exhibits196: Romaco Holding GmbH - Product / Service
- Exhibits197: Romaco Holding GmbH - Key offerings
- Exhibits198: SWOT
- Exhibits199: Silverson Machines Inc. - Overview
- Exhibits200: Silverson Machines Inc. - Product / Service
- Exhibits201: Silverson Machines Inc. - Key offerings
- Exhibits202: SWOT
- Exhibits203: Syntegon Technology GmbH - Overview
- Exhibits204: Syntegon Technology GmbH - Product / Service
- Exhibits205: Syntegon Technology GmbH - Key offerings
- Exhibits206: SWOT
- Exhibits207: Thermo Fisher Scientific Inc. - Overview
- Exhibits208: Thermo Fisher Scientific Inc. - Business segments
- Exhibits209: Thermo Fisher Scientific Inc. - Key news
- Exhibits210: Thermo Fisher Scientific Inc. - Key offerings
- Exhibits211: Thermo Fisher Scientific Inc. - Segment focus
- Exhibits212: SWOT
- Exhibits213: Inclusions checklist
- Exhibits214: Exclusions checklist
- Exhibits215: Currency conversion rates for US$
- Exhibits216: Research methodology
- Exhibits217: Information sources
- Exhibits218: Data validation
- Exhibits219: Validation techniques employed for market sizing
- Exhibits220: Data synthesis
- Exhibits221: 360 degree market analysis
- Exhibits222: List of abbreviations
Pharmaceutical Equipment Market 2025-2029
The pharmaceutical equipment market is forecasted to grow by $ 6381.3 mn during 2024-2029, accelerating at a CAGR of 6.9% during the forecast period. The report on the pharmaceutical equipment market provides a holistic analysis, market size and forecast, trends, growth drivers, and challenges, as well as vendor analysis covering around 25 vendors.
The report offers an up-to-date analysis regarding the current market scenario, the latest trends and drivers, and the overall market environment. The market is driven by rising prevalence of diseases and increasing demand for pharmaceuticals, increasing demand for generic drugs, and stringent regulatory compliance associated with manufacturing of pharmaceuticals.
| Market Scope | |
|---|---|
| Base Year | 2025 |
| End Year | 2029 |
| Series Year | 2025-2029 |
| Growth Momentum | Accelerate |
| YOY 2025 | 6.5% |
| CAGR | 6.9% |
| Incremental Value | $6381.3 mn |
Technavio's pharmaceutical equipment market is segmented as below:
By Product Type
- Solid
- Liquid
By Type
- Packaging equipment
- Granulating equipment
- Spray drying equipment
- Filing machines
- Others
By Geographical Landscape
- North America
- Europe
- Asia
- Rest of World (ROW)
This study identifies the standardization across pharmaceutical equipment as one of the prime reasons driving the pharmaceutical equipment market growth during the next few years. Also, technological advances in pharmaceutical equipment and growing demand for portable and on-site testing equipment will lead to sizable demand in the market.
The report on the pharmaceutical equipment market covers the following areas:
- Pharmaceutical Equipment Market sizing
- Pharmaceutical Equipment Market forecast
- Pharmaceutical Equipment Market industry analysis
The robust vendor analysis is designed to help clients improve their market position, and in line with this, this report provides a detailed analysis of several leading pharmaceutical equipment market vendors that include ACG, ACIC Pharmaceuticals Inc., Alfa Laval AB, Antares Vision S.p.A, Astro Machine Works Inc., Bausch plus Strobel Maschinenfabrik Ilshofen GmbH plus Co. KG SE, Coesia SpA, Freund Corp., GEA Group AG, Hillenbrand Inc., IDEX Corp., IMA Industria Macchine Automatiche Spa, Koerber AG, Maquinaria Industrial Dara SL, Marchesini Group Spa, Merck KGaA, Romaco Holding GmbH, Silverson Machines Inc., Syntegon Technology GmbH, and Thermo Fisher Scientific Inc.. Also, the pharmaceutical equipment market analysis report includes information on upcoming trends and challenges that will influence market growth. This is to help companies strategize and leverage all forthcoming growth opportunities.
The study was conducted using an objective combination of primary and secondary information including inputs from key participants in the industry. The report contains a comprehensive market and vendor landscape in addition to an analysis of the key vendors.
The publisher presents a detailed picture of the market by the way of study, synthesis, and summation of data from multiple sources by an analysis of key parameters such as profit, pricing, competition, and promotions. It presents various market facets by identifying the key industry influencers. The data presented is comprehensive, reliable, and a result of extensive primary and secondary research. The market research reports provide a complete competitive landscape and an in-depth vendor selection methodology and analysis using qualitative and quantitative research to forecast accurate market growth.
Table of Contents
1 Executive Summary
- 1.1 Market overview
- Executive Summary - Chart on Market Overview
- Executive Summary - Data Table on Market Overview
- Executive Summary - Chart on Global Market Characteristics
- Executive Summary - Chart on Market By Geographical Landscape
- Executive Summary - Chart on Market Segmentation by Product Type
- Executive Summary - Chart on Market Segmentation by Type
- Executive Summary - Chart on Incremental Growth
- Executive Summary - Data Table on Incremental Growth
- Executive Summary - Chart on Company Market Positioning
2 Technavio Analysis
- 2.1 Analysis of price sensitivity, lifecycle, customer purchase basket, adoption rates, and purchase criteria
- Analysis of price sensitivity, lifecycle, customer purchase basket, adoption rates, and purchase criteria
- 2.2 Criticality of inputs and Factors of differentiation
- Overview on criticality of inputs and factors of differentiation
- 2.3 Factors of disruption
- Overview on factors of disruption
- 2.4 Impact of drivers and challenges
- Impact of drivers and challenges in 2024 and 2029
3 Market Landscape
- 3.1 Market ecosystem
- Parent Market
- Data Table on - Parent Market
- 3.2 Market characteristics
- Market characteristics analysis
- 3.3 Value chain analysis
- Value chain analysis
4 Market Sizing
- 4.1 Market definition
- Offerings of companies included in the market definition
- 4.2 Market segment analysis
- Market segments
- 4.3 Market size 2024
- 4.4 Market outlook: Forecast for 2024-2029
- Chart on Global - Market size and forecast 2024-2029 ($ million)
- Data Table on Global - Market size and forecast 2024-2029 ($ million)
- Chart on Global Market: Year-over-year growth 2024-2029 (%)
- Data Table on Global Market: Year-over-year growth 2024-2029 (%)
5 Historic Market Size
- 5.1 Global Pharmaceutical Equipment Market 2019 - 2023
- Historic Market Size - Data Table on Global Pharmaceutical Equipment Market 2019 - 2023 ($ million)
- 5.2 Product Type segment analysis 2019 - 2023
- Historic Market Size - Product Type Segment 2019 - 2023 ($ million)
- 5.3 Type segment analysis 2019 - 2023
- Historic Market Size - Type Segment 2019 - 2023 ($ million)
- 5.4 Geography segment analysis 2019 - 2023
- Historic Market Size - Geography Segment 2019 - 2023 ($ million)
- 5.5 Country segment analysis 2019 - 2023
- Historic Market Size - Country Segment 2019 - 2023 ($ million)
6 Qualitative Analysis
- 6.1 The AI impact on Global Pharmaceutical Equipment Market
7 Five Forces Analysis
- 7.1 Five forces summary
- Five forces analysis - Comparison between 2024 and 2029
- 7.2 Bargaining power of buyers
- Bargaining power of buyers - Impact of key factors 2024 and 2029
- 7.3 Bargaining power of suppliers
- Bargaining power of suppliers - Impact of key factors in 2024 and 2029
- 7.4 Threat of new entrants
- Threat of new entrants - Impact of key factors in 2024 and 2029
- 7.5 Threat of substitutes
- Threat of substitutes - Impact of key factors in 2024 and 2029
- 7.6 Threat of rivalry
- Threat of rivalry - Impact of key factors in 2024 and 2029
- 7.7 Market condition
- Chart on Market condition - Five forces 2024 and 2029
8 Market Segmentation by Product Type
- 8.1 Market segments
- Chart on Product Type - Market share 2024-2029 (%)
- Data Table on Product Type - Market share 2024-2029 (%)
- 8.2 Comparison by Product Type
- Chart on Comparison by Product Type
- Data Table on Comparison by Product Type
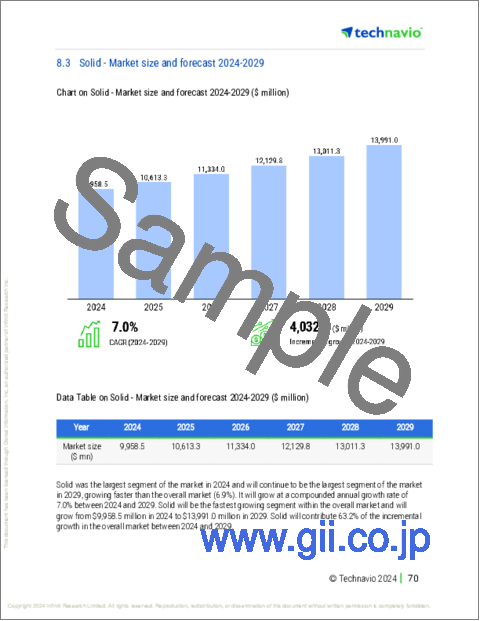
- 8.3 Solid - Market size and forecast 2024-2029
- Chart on Solid - Market size and forecast 2024-2029 ($ million)
- Data Table on Solid - Market size and forecast 2024-2029 ($ million)
- Chart on Solid - Year-over-year growth 2024-2029 (%)
- Data Table on Solid - Year-over-year growth 2024-2029 (%)
- 8.4 Liquid - Market size and forecast 2024-2029
- Chart on Liquid - Market size and forecast 2024-2029 ($ million)
- Data Table on Liquid - Market size and forecast 2024-2029 ($ million)
- Chart on Liquid - Year-over-year growth 2024-2029 (%)
- Data Table on Liquid - Year-over-year growth 2024-2029 (%)
- 8.5 Market opportunity by Product Type
- Market opportunity by Product Type ($ million)
- Data Table on Market opportunity by Product Type ($ million)
9 Market Segmentation by Type
- 9.1 Market segments
- Chart on Type - Market share 2024-2029 (%)
- Data Table on Type - Market share 2024-2029 (%)
- 9.2 Comparison by Type
- Chart on Comparison by Type
- Data Table on Comparison by Type
- 9.3 Packaging equipment - Market size and forecast 2024-2029
- Chart on Packaging equipment - Market size and forecast 2024-2029 ($ million)
- Data Table on Packaging equipment - Market size and forecast 2024-2029 ($ million)
- Chart on Packaging equipment - Year-over-year growth 2024-2029 (%)
- Data Table on Packaging equipment - Year-over-year growth 2024-2029 (%)
- 9.4 Granulating equipment - Market size and forecast 2024-2029
- Chart on Granulating equipment - Market size and forecast 2024-2029 ($ million)
- Data Table on Granulating equipment - Market size and forecast 2024-2029 ($ million)
- Chart on Granulating equipment - Year-over-year growth 2024-2029 (%)
- Data Table on Granulating equipment - Year-over-year growth 2024-2029 (%)
- 9.5 Spray drying equipment - Market size and forecast 2024-2029
- Chart on Spray drying equipment - Market size and forecast 2024-2029 ($ million)
- Data Table on Spray drying equipment - Market size and forecast 2024-2029 ($ million)
- Chart on Spray drying equipment - Year-over-year growth 2024-2029 (%)
- Data Table on Spray drying equipment - Year-over-year growth 2024-2029 (%)
- 9.6 Filing machines - Market size and forecast 2024-2029
- Chart on Filing machines - Market size and forecast 2024-2029 ($ million)
- Data Table on Filing machines - Market size and forecast 2024-2029 ($ million)
- Chart on Filing machines - Year-over-year growth 2024-2029 (%)
- Data Table on Filing machines - Year-over-year growth 2024-2029 (%)
- 9.7 Others - Market size and forecast 2024-2029
- Chart on Others - Market size and forecast 2024-2029 ($ million)
- Data Table on Others - Market size and forecast 2024-2029 ($ million)
- Chart on Others - Year-over-year growth 2024-2029 (%)
- Data Table on Others - Year-over-year growth 2024-2029 (%)
- 9.8 Market opportunity by Type
- Market opportunity by Type ($ million)
- Data Table on Market opportunity by Type ($ million)
10 Customer Landscape
- 10.1 Customer landscape overview
- Analysis of price sensitivity, lifecycle, customer purchase basket, adoption rates, and purchase criteria
11 Geographic Landscape
- 11.1 Geographic segmentation
- Chart on Market share By Geographical Landscape 2024-2029 (%)
- Data Table on Market share By Geographical Landscape 2024-2029 (%)
- 11.2 Geographic comparison
- Chart on Geographic comparison
- Data Table on Geographic comparison
- 11.3 North America - Market size and forecast 2024-2029
- Chart on North America - Market size and forecast 2024-2029 ($ million)
- Data Table on North America - Market size and forecast 2024-2029 ($ million)
- Chart on North America - Year-over-year growth 2024-2029 (%)
- Data Table on North America - Year-over-year growth 2024-2029 (%)
- 11.4 Europe - Market size and forecast 2024-2029
- Chart on Europe - Market size and forecast 2024-2029 ($ million)
- Data Table on Europe - Market size and forecast 2024-2029 ($ million)
- Chart on Europe - Year-over-year growth 2024-2029 (%)
- Data Table on Europe - Year-over-year growth 2024-2029 (%)
- 11.5 Asia - Market size and forecast 2024-2029
- Chart on Asia - Market size and forecast 2024-2029 ($ million)
- Data Table on Asia - Market size and forecast 2024-2029 ($ million)
- Chart on Asia - Year-over-year growth 2024-2029 (%)
- Data Table on Asia - Year-over-year growth 2024-2029 (%)
- 11.6 Rest of World (ROW) - Market size and forecast 2024-2029
- Chart on Rest of World (ROW) - Market size and forecast 2024-2029 ($ million)
- Data Table on Rest of World (ROW) - Market size and forecast 2024-2029 ($ million)
- Chart on Rest of World (ROW) - Year-over-year growth 2024-2029 (%)
- Data Table on Rest of World (ROW) - Year-over-year growth 2024-2029 (%)
- 11.7 US - Market size and forecast 2024-2029
- Chart on US - Market size and forecast 2024-2029 ($ million)
- Data Table on US - Market size and forecast 2024-2029 ($ million)
- Chart on US - Year-over-year growth 2024-2029 (%)
- Data Table on US - Year-over-year growth 2024-2029 (%)
- 11.8 China - Market size and forecast 2024-2029
- Chart on China - Market size and forecast 2024-2029 ($ million)
- Data Table on China - Market size and forecast 2024-2029 ($ million)
- Chart on China - Year-over-year growth 2024-2029 (%)
- Data Table on China - Year-over-year growth 2024-2029 (%)
- 11.9 India - Market size and forecast 2024-2029
- Chart on India - Market size and forecast 2024-2029 ($ million)
- Data Table on India - Market size and forecast 2024-2029 ($ million)
- Chart on India - Year-over-year growth 2024-2029 (%)
- Data Table on India - Year-over-year growth 2024-2029 (%)
- 11.10 Germany - Market size and forecast 2024-2029
- Chart on Germany - Market size and forecast 2024-2029 ($ million)
- Data Table on Germany - Market size and forecast 2024-2029 ($ million)
- Chart on Germany - Year-over-year growth 2024-2029 (%)
- Data Table on Germany - Year-over-year growth 2024-2029 (%)
- 11.11 Canada - Market size and forecast 2024-2029
- Chart on Canada - Market size and forecast 2024-2029 ($ million)
- Data Table on Canada - Market size and forecast 2024-2029 ($ million)
- Chart on Canada - Year-over-year growth 2024-2029 (%)
- Data Table on Canada - Year-over-year growth 2024-2029 (%)
- 11.12 UK - Market size and forecast 2024-2029
- Chart on UK - Market size and forecast 2024-2029 ($ million)
- Data Table on UK - Market size and forecast 2024-2029 ($ million)
- Chart on UK - Year-over-year growth 2024-2029 (%)
- Data Table on UK - Year-over-year growth 2024-2029 (%)
- 11.13 France - Market size and forecast 2024-2029
- Chart on France - Market size and forecast 2024-2029 ($ million)
- Data Table on France - Market size and forecast 2024-2029 ($ million)
- Chart on France - Year-over-year growth 2024-2029 (%)
- Data Table on France - Year-over-year growth 2024-2029 (%)
- 11.14 Italy - Market size and forecast 2024-2029
- Chart on Italy - Market size and forecast 2024-2029 ($ million)
- Data Table on Italy - Market size and forecast 2024-2029 ($ million)
- Chart on Italy - Year-over-year growth 2024-2029 (%)
- Data Table on Italy - Year-over-year growth 2024-2029 (%)
- 11.15 Brazil - Market size and forecast 2024-2029
- Chart on Brazil - Market size and forecast 2024-2029 ($ million)
- Data Table on Brazil - Market size and forecast 2024-2029 ($ million)
- Chart on Brazil - Year-over-year growth 2024-2029 (%)
- Data Table on Brazil - Year-over-year growth 2024-2029 (%)
- 11.16 Japan - Market size and forecast 2024-2029
- Chart on Japan - Market size and forecast 2024-2029 ($ million)
- Data Table on Japan - Market size and forecast 2024-2029 ($ million)
- Chart on Japan - Year-over-year growth 2024-2029 (%)
- Data Table on Japan - Year-over-year growth 2024-2029 (%)
- 11.17 Market opportunity By Geographical Landscape
- Market opportunity By Geographical Landscape ($ million)
- Data Tables on Market opportunity By Geographical Landscape ($ million)
12 Drivers, Challenges, and Opportunity/Restraints
- 12.1 Market drivers
- 12.2 Market challenges
- 12.3 Impact of drivers and challenges
- Impact of drivers and challenges in 2024 and 2029
- 12.4 Market opportunities/restraints
13 Competitive Landscape
- 13.1 Overview
- 13.2 Competitive Landscape
- Overview on criticality of inputs and factors of differentiation
- 13.3 Landscape disruption
- Overview on factors of disruption
- 13.4 Industry risks
- Impact of key risks on business
14 Competitive Analysis
- 14.1 Companies profiled
- Companies covered
- 14.2 Company ranking index
- Company ranking index
- 14.3 Market positioning of companies
- Matrix on companies position and classification
- 14.4 ACG
- ACG - Overview
- ACG - Product / Service
- ACG - Key offerings
- SWOT
- 14.5 ACIC Pharmaceuticals Inc.
- ACIC Pharmaceuticals Inc. - Overview
- ACIC Pharmaceuticals Inc. - Product / Service
- ACIC Pharmaceuticals Inc. - Key offerings
- SWOT
- 14.6 Alfa Laval AB
- Alfa Laval AB - Overview
- Alfa Laval AB - Business segments
- Alfa Laval AB - Key news
- Alfa Laval AB - Key offerings
- Alfa Laval AB - Segment focus
- SWOT
- 14.7 Antares Vision S.p.A
- Antares Vision S.p.A - Overview
- Antares Vision S.p.A - Product / Service
- Antares Vision S.p.A - Key offerings
- SWOT
- 14.8 Bausch plus Strobel Maschinenfabrik Ilshofen GmbH plus Co. KG SE
- Bausch plus Strobel Maschinenfabrik Ilshofen GmbH plus Co. KG SE - Overview
- Bausch plus Strobel Maschinenfabrik Ilshofen GmbH plus Co. KG SE - Product / Service
- Bausch plus Strobel Maschinenfabrik Ilshofen GmbH plus Co. KG SE - Key offerings
- SWOT
- 14.9 GEA Group AG
- GEA Group AG - Overview
- GEA Group AG - Business segments
- GEA Group AG - Key offerings
- GEA Group AG - Segment focus
- SWOT
- 14.10 IMA Industria Macchine Automatiche Spa
- IMA Industria Macchine Automatiche Spa - Overview
- IMA Industria Macchine Automatiche Spa - Product / Service
- IMA Industria Macchine Automatiche Spa - Key offerings
- SWOT
- 14.11 Koerber AG
- Koerber AG - Overview
- Koerber AG - Product / Service
- Koerber AG - Key offerings
- SWOT
- 14.12 Maquinaria Industrial Dara SL
- Maquinaria Industrial Dara SL - Overview
- Maquinaria Industrial Dara SL - Product / Service
- Maquinaria Industrial Dara SL - Key offerings
- SWOT
- 14.13 Marchesini Group Spa
- Marchesini Group Spa - Overview
- Marchesini Group Spa - Product / Service
- Marchesini Group Spa - Key offerings
- SWOT
- 14.14 Merck KGaA
- Merck KGaA - Overview
- Merck KGaA - Business segments
- Merck KGaA - Key news
- Merck KGaA - Key offerings
- Merck KGaA - Segment focus
- SWOT
- 14.15 Romaco Holding GmbH
- Romaco Holding GmbH - Overview
- Romaco Holding GmbH - Product / Service
- Romaco Holding GmbH - Key offerings
- SWOT
- 14.16 Silverson Machines Inc.
- Silverson Machines Inc. - Overview
- Silverson Machines Inc. - Product / Service
- Silverson Machines Inc. - Key offerings
- SWOT
- 14.17 Syntegon Technology GmbH
- Syntegon Technology GmbH - Overview
- Syntegon Technology GmbH - Product / Service
- Syntegon Technology GmbH - Key offerings
- SWOT
- 14.18 Thermo Fisher Scientific Inc.
- Thermo Fisher Scientific Inc. - Overview
- Thermo Fisher Scientific Inc. - Business segments
- Thermo Fisher Scientific Inc. - Key news
- Thermo Fisher Scientific Inc. - Key offerings
- Thermo Fisher Scientific Inc. - Segment focus
- SWOT
15 Appendix
- 15.1 Scope of the report
- 15.2 Inclusions and exclusions checklist
- Inclusions checklist
- Exclusions checklist
- 15.3 Currency conversion rates for US$
- Currency conversion rates for US$
- 15.4 Research methodology
- Research methodology
- 15.5 Data procurement
- Information sources
- 15.6 Data validation
- Data validation
- 15.7 Validation techniques employed for market sizing
- Validation techniques employed for market sizing
- 15.8 Data synthesis
- Data synthesis
- 15.9 360 degree market analysis
- 360 degree market analysis
- 15.10 List of abbreviations
- List of abbreviations

