|
|
市場調査レポート
商品コード
1544521
精製触媒の世界市場、2024~2028年Global Refining Catalyst Market 2024-2028 |
||||||
|
|||||||
カスタマイズ可能
|
|||||||

| 精製触媒の世界市場、2024~2028年 |
|
出版日: 2024年07月12日
発行: TechNavio
ページ情報: 英文 191 Pages
納期: 即納可能
|

全表示
- 概要
- 図表
- 目次
精製触媒市場は2023~2028年に16億690万米ドル、予測期間中のCAGRは4.36%で成長すると予測されます。
当レポートでは、精製触媒市場の全体的な分析、市場規模・予測、動向、成長促進要因、課題、約25のベンダーを網羅したベンダー分析などを掲載しています。
現在の市場シナリオ、最新動向と促進要因、市場環境全体に関する最新分析を提供しています。市場は、FCCプロセスの採用の増加、よりクリーンな燃料への需要の増加、新製品投入に注力するベンダーの増加によって牽引されています。
| 市場範囲 | |
|---|---|
| 基準年 | 2024年 |
| 終了年 | 2028年 |
| 予測期間 | 2024~2028年 |
| 成長モメンタム | 加速 |
| 前年比[2024年] | 4.11% |
| CAGR | 4.36% |
| 増分額 | 16億690万米ドル |
本調査では、今後数年間の精製触媒市場の成長を促進する主要要因の1つとして、デジタル化と高度分析の導入増加を挙げています。また、再生可能なバイオベース原料へのシフトと高オクタン価燃料の需要増加が市場の大きな需要につながります。
目次
第1章 エグゼクティブサマリー
- 市場概要
第2章 市場情勢
- 市場エコシステム
- 市場の特徴
- バリューチェーン分析
第3章 市場規模の評価
- 市場の定義
- 市場セグメント分析
- 市場規模 2023年
- 市場の展望 2023~2028年
第4章 市場規模実績
- 精製触媒の世界市場 2018~2022年
- 製品別セグメント分析 2018~2022年
- タイプ別セグメント分析 2018~2022年
- 地域別セグメント分析 2018~2022年
- 国別セグメント分析 2018~2022年
第5章 ファイブフォース分析
- ファイブフォースの要約
- 買い手の交渉力
- 供給企業の交渉力
- 新規参入業者の脅威
- 代替品の脅威
- 競争の脅威
- 市況
第6章 市場セグメンテーション:製品別
- 市場セグメンテーション
- 比較:製品別
- FCC触媒:市場規模と予測 2023~2028年
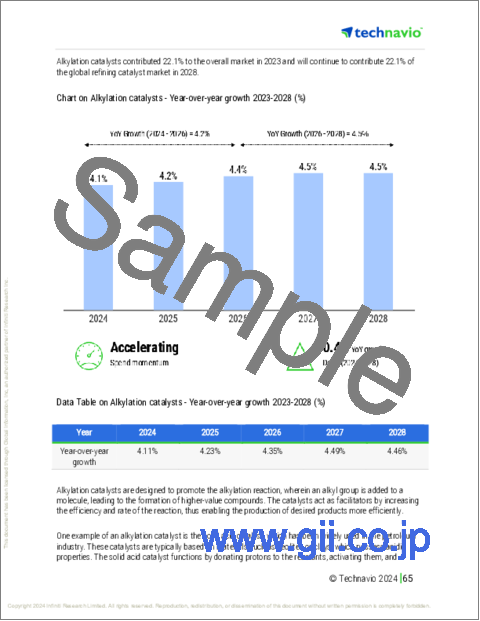
- アルキル化触媒:市場規模と予測 2023~2028年
- 水素化処理触媒:市場規模と予測 2023~2028年
- 水素化分解触媒:市場規模と予測 2023~2028年
- 接触改質触媒:市場規模と予測 2023~2028年
- 市場機会:製品別
第7章 市場セグメンテーション:タイプ別
- 市場セグメンテーション
- 比較:タイプ別
- ゼオライト:市場規模と予測 2023~2028年
- 金属:市場規模と予測 2023~2028年
- 化合物:市場規模と予測 2023~2028年
- 市場機会:タイプ別
第8章 顧客情勢
- 顧客情勢概要
第9章 地域別情勢
- 地域別セグメンテーション
- 比較:地域別
- アジア太平洋:市場規模と予測 2023~2028年
- 北米:市場規模と予測 2023~2028年
- 欧州:市場規模と予測 2023~2028年
- 中東・アフリカ:市場規模と予測 2023~2028年
- 南米:市場規模と予測 2023~2028年
- 中国:市場規模と予測 2023~2028年
- 米国:市場規模と予測 2023~2028年
- ドイツ:市場規模と予測 2023~2028年
- フランス:市場規模と予測 2023~2028年
- インド:市場規模と予測 2023~2028年
- 市場機会:地域情勢別
第10章 促進要因・課題・機会・抑制要因
- 市場促進要因
- 市場課題
- 促進要因と課題の影響
- 市場の機会・抑制要因
第11章 競合情勢
- 概要
- 競合情勢
- 混乱の状況
- 業界のリスク
第12章 競合分析
- 企業プロファイル
- 企業の市場ポジショニング
- Albemarle Corp.
- Axens
- BASF SE
- Chevron Corp.
- Clariant International Ltd.
- Dorf Ketal Chemicals I Pvt. Ltd.
- Evonik Industries AG
- Exxon Mobil Corp.
- Honeywell International Inc.
- Johnson Matthey Plc
- KNT Group
- Shell plc
- Sinopec Shanghai Petrochemical Co. Ltd.
- Topsoes AS
- W. R. Grace and Co.
第13章 付録
Exhibits:
- Exhibits1: Executive Summary - Chart on Market Overview
- Exhibits2: Executive Summary - Data Table on Market Overview
- Exhibits3: Executive Summary - Chart on Global Market Characteristics
- Exhibits4: Executive Summary - Chart on Market By Geographical Landscape
- Exhibits5: Executive Summary - Chart on Market Segmentation by Product
- Exhibits6: Executive Summary - Chart on Market Segmentation by Type
- Exhibits7: Executive Summary - Chart on Incremental Growth
- Exhibits8: Executive Summary - Data Table on Incremental Growth
- Exhibits9: Executive Summary - Chart on Company Market Positioning
- Exhibits10: Parent Market
- Exhibits11: Data Table on - Parent Market
- Exhibits12: Market characteristics analysis
- Exhibits13: Value Chain Analysis
- Exhibits14: Offerings of companies included in the market definition
- Exhibits15: Market segments
- Exhibits16: Chart on Global - Market size and forecast 2023-2028 ($ million)
- Exhibits17: Data Table on Global - Market size and forecast 2023-2028 ($ million)
- Exhibits18: Chart on Global Market: Year-over-year growth 2023-2028 (%)
- Exhibits19: Data Table on Global Market: Year-over-year growth 2023-2028 (%)
- Exhibits20: Historic Market Size - Data Table on Global Refining Catalyst Market 2018 - 2022 ($ million)
- Exhibits21: Historic Market Size - Product Segment 2018 - 2022 ($ million)
- Exhibits22: Historic Market Size - Type Segment 2018 - 2022 ($ million)
- Exhibits23: Historic Market Size - Geography Segment 2018 - 2022 ($ million)
- Exhibits24: Historic Market Size - Country Segment 2018 - 2022 ($ million)
- Exhibits25: Five forces analysis - Comparison between 2023 and 2028
- Exhibits26: Bargaining power of buyers - Impact of key factors 2023 and 2028
- Exhibits27: Bargaining power of suppliers - Impact of key factors in 2023 and 2028
- Exhibits28: Threat of new entrants - Impact of key factors in 2023 and 2028
- Exhibits29: Threat of substitutes - Impact of key factors in 2023 and 2028
- Exhibits30: Threat of rivalry - Impact of key factors in 2023 and 2028
- Exhibits31: Chart on Market condition - Five forces 2023 and 2028
- Exhibits32: Chart on Product - Market share 2023-2028 (%)
- Exhibits33: Data Table on Product - Market share 2023-2028 (%)
- Exhibits34: Chart on Comparison by Product
- Exhibits35: Data Table on Comparison by Product
- Exhibits36: Chart on FCC catalysts - Market size and forecast 2023-2028 ($ million)
- Exhibits37: Data Table on FCC catalysts - Market size and forecast 2023-2028 ($ million)
- Exhibits38: Chart on FCC catalysts - Year-over-year growth 2023-2028 (%)
- Exhibits39: Data Table on FCC catalysts - Year-over-year growth 2023-2028 (%)
- Exhibits40: Chart on Alkylation catalysts - Market size and forecast 2023-2028 ($ million)
- Exhibits41: Data Table on Alkylation catalysts - Market size and forecast 2023-2028 ($ million)
- Exhibits42: Chart on Alkylation catalysts - Year-over-year growth 2023-2028 (%)
- Exhibits43: Data Table on Alkylation catalysts - Year-over-year growth 2023-2028 (%)
- Exhibits44: Chart on Hydrotreating catalysts - Market size and forecast 2023-2028 ($ million)
- Exhibits45: Data Table on Hydrotreating catalysts - Market size and forecast 2023-2028 ($ million)
- Exhibits46: Chart on Hydrotreating catalysts - Year-over-year growth 2023-2028 (%)
- Exhibits47: Data Table on Hydrotreating catalysts - Year-over-year growth 2023-2028 (%)
- Exhibits48: Chart on Hydrocracking catalysts - Market size and forecast 2023-2028 ($ million)
- Exhibits49: Data Table on Hydrocracking catalysts - Market size and forecast 2023-2028 ($ million)
- Exhibits50: Chart on Hydrocracking catalysts - Year-over-year growth 2023-2028 (%)
- Exhibits51: Data Table on Hydrocracking catalysts - Year-over-year growth 2023-2028 (%)
- Exhibits52: Chart on Catalytic reforming catalysts - Market size and forecast 2023-2028 ($ million)
- Exhibits53: Data Table on Catalytic reforming catalysts - Market size and forecast 2023-2028 ($ million)
- Exhibits54: Chart on Catalytic reforming catalysts - Year-over-year growth 2023-2028 (%)
- Exhibits55: Data Table on Catalytic reforming catalysts - Year-over-year growth 2023-2028 (%)
- Exhibits56: Market opportunity by Product ($ million)
- Exhibits57: Data Table on Market opportunity by Product ($ million)
- Exhibits58: Chart on Type - Market share 2023-2028 (%)
- Exhibits59: Data Table on Type - Market share 2023-2028 (%)
- Exhibits60: Chart on Comparison by Type
- Exhibits61: Data Table on Comparison by Type
- Exhibits62: Chart on Zeolites - Market size and forecast 2023-2028 ($ million)
- Exhibits63: Data Table on Zeolites - Market size and forecast 2023-2028 ($ million)
- Exhibits64: Chart on Zeolites - Year-over-year growth 2023-2028 (%)
- Exhibits65: Data Table on Zeolites - Year-over-year growth 2023-2028 (%)
- Exhibits66: Chart on Metals - Market size and forecast 2023-2028 ($ million)
- Exhibits67: Data Table on Metals - Market size and forecast 2023-2028 ($ million)
- Exhibits68: Chart on Metals - Year-over-year growth 2023-2028 (%)
- Exhibits69: Data Table on Metals - Year-over-year growth 2023-2028 (%)
- Exhibits70: Chart on Chemical compounds - Market size and forecast 2023-2028 ($ million)
- Exhibits71: Data Table on Chemical compounds - Market size and forecast 2023-2028 ($ million)
- Exhibits72: Chart on Chemical compounds - Year-over-year growth 2023-2028 (%)
- Exhibits73: Data Table on Chemical compounds - Year-over-year growth 2023-2028 (%)
- Exhibits74: Market opportunity by Type ($ million)
- Exhibits75: Data Table on Market opportunity by Type ($ million)
- Exhibits76: Analysis of price sensitivity, lifecycle, customer purchase basket, adoption rates, and purchase criteria
- Exhibits77: Chart on Market share By Geographical Landscape 2023-2028 (%)
- Exhibits78: Data Table on Market share By Geographical Landscape 2023-2028 (%)
- Exhibits79: Chart on Geographic comparison
- Exhibits80: Data Table on Geographic comparison
- Exhibits81: Chart on APAC - Market size and forecast 2023-2028 ($ million)
- Exhibits82: Data Table on APAC - Market size and forecast 2023-2028 ($ million)
- Exhibits83: Chart on APAC - Year-over-year growth 2023-2028 (%)
- Exhibits84: Data Table on APAC - Year-over-year growth 2023-2028 (%)
- Exhibits85: Chart on North America - Market size and forecast 2023-2028 ($ million)
- Exhibits86: Data Table on North America - Market size and forecast 2023-2028 ($ million)
- Exhibits87: Chart on North America - Year-over-year growth 2023-2028 (%)
- Exhibits88: Data Table on North America - Year-over-year growth 2023-2028 (%)
- Exhibits89: Chart on Europe - Market size and forecast 2023-2028 ($ million)
- Exhibits90: Data Table on Europe - Market size and forecast 2023-2028 ($ million)
- Exhibits91: Chart on Europe - Year-over-year growth 2023-2028 (%)
- Exhibits92: Data Table on Europe - Year-over-year growth 2023-2028 (%)
- Exhibits93: Chart on Middle East and Africa - Market size and forecast 2023-2028 ($ million)
- Exhibits94: Data Table on Middle East and Africa - Market size and forecast 2023-2028 ($ million)
- Exhibits95: Chart on Middle East and Africa - Year-over-year growth 2023-2028 (%)
- Exhibits96: Data Table on Middle East and Africa - Year-over-year growth 2023-2028 (%)
- Exhibits97: Chart on South America - Market size and forecast 2023-2028 ($ million)
- Exhibits98: Data Table on South America - Market size and forecast 2023-2028 ($ million)
- Exhibits99: Chart on South America - Year-over-year growth 2023-2028 (%)
- Exhibits100: Data Table on South America - Year-over-year growth 2023-2028 (%)
- Exhibits101: Chart on China - Market size and forecast 2023-2028 ($ million)
- Exhibits102: Data Table on China - Market size and forecast 2023-2028 ($ million)
- Exhibits103: Chart on China - Year-over-year growth 2023-2028 (%)
- Exhibits104: Data Table on China - Year-over-year growth 2023-2028 (%)
- Exhibits105: Chart on US - Market size and forecast 2023-2028 ($ million)
- Exhibits106: Data Table on US - Market size and forecast 2023-2028 ($ million)
- Exhibits107: Chart on US - Year-over-year growth 2023-2028 (%)
- Exhibits108: Data Table on US - Year-over-year growth 2023-2028 (%)
- Exhibits109: Chart on Germany - Market size and forecast 2023-2028 ($ million)
- Exhibits110: Data Table on Germany - Market size and forecast 2023-2028 ($ million)
- Exhibits111: Chart on Germany - Year-over-year growth 2023-2028 (%)
- Exhibits112: Data Table on Germany - Year-over-year growth 2023-2028 (%)
- Exhibits113: Chart on France - Market size and forecast 2023-2028 ($ million)
- Exhibits114: Data Table on France - Market size and forecast 2023-2028 ($ million)
- Exhibits115: Chart on France - Year-over-year growth 2023-2028 (%)
- Exhibits116: Data Table on France - Year-over-year growth 2023-2028 (%)
- Exhibits117: Chart on India - Market size and forecast 2023-2028 ($ million)
- Exhibits118: Data Table on India - Market size and forecast 2023-2028 ($ million)
- Exhibits119: Chart on India - Year-over-year growth 2023-2028 (%)
- Exhibits120: Data Table on India - Year-over-year growth 2023-2028 (%)
- Exhibits121: Market opportunity By Geographical Landscape ($ million)
- Exhibits122: Data Tables on Market opportunity By Geographical Landscape ($ million)
- Exhibits123: Impact of drivers and challenges in 2023 and 2028
- Exhibits124: Overview on criticality of inputs and factors of differentiation
- Exhibits125: Overview on factors of disruption
- Exhibits126: Impact of key risks on business
- Exhibits127: Companies covered
- Exhibits128: Matrix on companies position and classification
- Exhibits129: Albemarle Corp. - Overview
- Exhibits130: Albemarle Corp. - Business segments
- Exhibits131: Albemarle Corp. - Key news
- Exhibits132: Albemarle Corp. - Key offerings
- Exhibits133: Albemarle Corp. - Segment focus
- Exhibits134: Axens - Overview
- Exhibits135: Axens - Product / Service
- Exhibits136: Axens - Key news
- Exhibits137: Axens - Key offerings
- Exhibits138: BASF SE - Overview
- Exhibits139: BASF SE - Business segments
- Exhibits140: BASF SE - Key news
- Exhibits141: BASF SE - Key offerings
- Exhibits142: BASF SE - Segment focus
- Exhibits143: Chevron Corp. - Overview
- Exhibits144: Chevron Corp. - Business segments
- Exhibits145: Chevron Corp. - Key news
- Exhibits146: Chevron Corp. - Key offerings
- Exhibits147: Chevron Corp. - Segment focus
- Exhibits148: Clariant International Ltd. - Overview
- Exhibits149: Clariant International Ltd. - Business segments
- Exhibits150: Clariant International Ltd. - Key news
- Exhibits151: Clariant International Ltd. - Key offerings
- Exhibits152: Clariant International Ltd. - Segment focus
- Exhibits153: Dorf Ketal Chemicals I Pvt. Ltd. - Overview
- Exhibits154: Dorf Ketal Chemicals I Pvt. Ltd. - Product / Service
- Exhibits155: Dorf Ketal Chemicals I Pvt. Ltd. - Key offerings
- Exhibits156: Evonik Industries AG - Overview
- Exhibits157: Evonik Industries AG - Business segments
- Exhibits158: Evonik Industries AG - Key news
- Exhibits159: Evonik Industries AG - Key offerings
- Exhibits160: Evonik Industries AG - Segment focus
- Exhibits161: Exxon Mobil Corp. - Overview
- Exhibits162: Exxon Mobil Corp. - Business segments
- Exhibits163: Exxon Mobil Corp. - Key news
- Exhibits164: Exxon Mobil Corp. - Key offerings
- Exhibits165: Exxon Mobil Corp. - Segment focus
- Exhibits166: Honeywell International Inc. - Overview
- Exhibits167: Honeywell International Inc. - Business segments
- Exhibits168: Honeywell International Inc. - Key news
- Exhibits169: Honeywell International Inc. - Key offerings
- Exhibits170: Honeywell International Inc. - Segment focus
- Exhibits171: Johnson Matthey Plc - Overview
- Exhibits172: Johnson Matthey Plc - Business segments
- Exhibits173: Johnson Matthey Plc - Key news
- Exhibits174: Johnson Matthey Plc - Key offerings
- Exhibits175: Johnson Matthey Plc - Segment focus
- Exhibits176: KNT Group - Overview
- Exhibits177: KNT Group - Product / Service
- Exhibits178: KNT Group - Key offerings
- Exhibits179: Shell plc - Overview
- Exhibits180: Shell plc - Business segments
- Exhibits181: Shell plc - Key news
- Exhibits182: Shell plc - Key offerings
- Exhibits183: Shell plc - Segment focus
- Exhibits184: Sinopec Shanghai Petrochemical Co. Ltd. - Overview
- Exhibits185: Sinopec Shanghai Petrochemical Co. Ltd. - Business segments
- Exhibits186: Sinopec Shanghai Petrochemical Co. Ltd. - Key news
- Exhibits187: Sinopec Shanghai Petrochemical Co. Ltd. - Key offerings
- Exhibits188: Sinopec Shanghai Petrochemical Co. Ltd. - Segment focus
- Exhibits189: Topsoes AS - Overview
- Exhibits190: Topsoes AS - Product / Service
- Exhibits191: Topsoes AS - Key offerings
- Exhibits192: W. R. Grace and Co. - Overview
- Exhibits193: W. R. Grace and Co. - Product / Service
- Exhibits194: W. R. Grace and Co. - Key offerings
- Exhibits195: Inclusions checklist
- Exhibits196: Exclusions checklist
- Exhibits197: Currency conversion rates for US$
- Exhibits198: Research methodology
- Exhibits199: Information sources
- Exhibits200: Data validation
- Exhibits201: Validation techniques employed for market sizing
- Exhibits202: Data synthesis
- Exhibits203: 360 degree market analysis
- Exhibits204: List of abbreviations
The refining catalyst market is forecasted to grow by USD 1606.9 mn during 2023-2028, accelerating at a CAGR of 4.36% during the forecast period. The report on the refining catalyst market provides a holistic analysis, market size and forecast, trends, growth drivers, and challenges, as well as vendor analysis covering around 25 vendors.
The report offers an up-to-date analysis regarding the current market scenario, the latest trends and drivers, and the overall market environment. The market is driven by increasing adoption of FCC processes, increasing demand for cleaner fuels, and increasing focus of vendors on new product launches.
Technavio's refining catalyst market is segmented as below:
| Market Scope | |
|---|---|
| Base Year | 2024 |
| End Year | 2028 |
| Series Year | 2024-2028 |
| Growth Momentum | Accelerate |
| YOY 2024 | 4.11% |
| CAGR | 4.36% |
| Incremental Value | $1606.9 mn |
By Product
- FCC catalysts
- Alkylation catalysts
- Hydrotreating catalysts
- Hydrocracking catalysts
- Catalytic reforming catalysts
By Type
- Zeolites
- Metals
- Chemical compounds
By Geographical Landscape
- APAC
- North America
- Europe
- Middle East and Africa
- South America
This study identifies the rise in adoption of digitalization and advanced analytics as one of the prime reasons driving the refining catalyst market growth during the next few years. Also, shift toward renewable and bio-based feedstocks and rise demand for fuel with high octane number will lead to sizable demand in the market.
The report on the refining catalyst market covers the following areas:
- Refining catalyst market sizing
- Refining catalyst market forecast
- Refining catalyst market industry analysis
The robust vendor analysis is designed to help clients improve their market position, and in line with this, this report provides a detailed analysis of several leading refining catalyst market vendors that include Albemarle Corp., Arkema SA, Axens, BASF SE, Chevron Corp., Clariant International Ltd., Dorf Ketal Chemicals I Pvt. Ltd., DuPont de Nemours Inc., Evonik Industries AG, Exxon Mobil Corp., Honeywell International Inc., Johnson Matthey PLC, KNT Group, Lummus Technology LLC, McDermott International Ltd., Shell PLC, Sinopec Shanghai Petrochemical Co. Ltd., TechnipFMC PLC, Topsoes AS, and W. R. Grace and Co.. Also, the refining catalyst market analysis report includes information on upcoming trends and challenges that will influence market growth. This is to help companies strategize and leverage all forthcoming growth opportunities.
The study was conducted using an objective combination of primary and secondary information including inputs from key participants in the industry. The report contains a comprehensive market and vendor landscape in addition to an analysis of the key vendors.
The publisher presents a detailed picture of the market by the way of study, synthesis, and summation of data from multiple sources by an analysis of key parameters such as profit, pricing, competition, and promotions. It presents various market facets by identifying the key industry influencers. The data presented is comprehensive, reliable, and a result of extensive research - both primary and secondary. The market research reports provide a complete competitive landscape and an in-depth vendor selection methodology and analysis using qualitative and quantitative research to forecast the accurate market growth.
Table of Contents
1 Executive Summary
- 1.1 Market overview
- Executive Summary - Chart on Market Overview
- Executive Summary - Data Table on Market Overview
- Executive Summary - Chart on Global Market Characteristics
- Executive Summary - Chart on Market By Geographical Landscape
- Executive Summary - Chart on Market Segmentation by Product
- Executive Summary - Chart on Market Segmentation by Type
- Executive Summary - Chart on Incremental Growth
- Executive Summary - Data Table on Incremental Growth
- Executive Summary - Chart on Company Market Positioning
2 Market Landscape
- 2.1 Market ecosystem
- Parent Market
- Data Table on - Parent Market
- 2.2 Market characteristics
- Market characteristics analysis
- 2.3 Value chain analysis
- Value Chain Analysis
3 Market Sizing
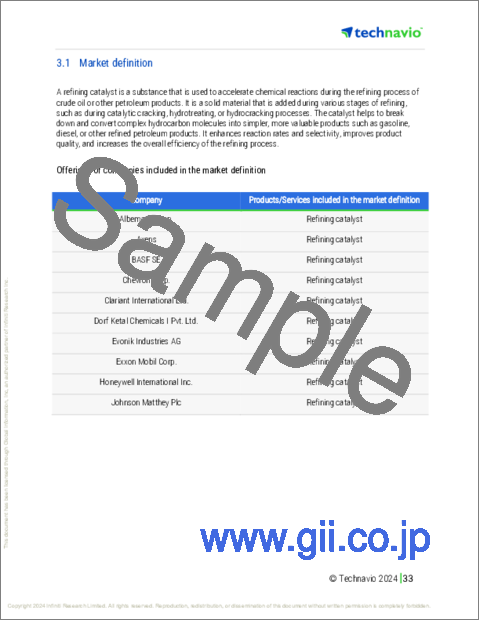
- 3.1 Market definition
- Offerings of companies included in the market definition
- 3.2 Market segment analysis
- Market segments
- 3.3 Market size 2023
- 3.4 Market outlook: Forecast for 2023-2028
- Chart on Global - Market size and forecast 2023-2028 ($ million)
- Data Table on Global - Market size and forecast 2023-2028 ($ million)
- Chart on Global Market: Year-over-year growth 2023-2028 (%)
- Data Table on Global Market: Year-over-year growth 2023-2028 (%)
4 Historic Market Size
- 4.1 Global Refining Catalyst Market 2018 - 2022
- Historic Market Size - Data Table on Global Refining Catalyst Market 2018 - 2022 ($ million)
- 4.2 Product segment analysis 2018 - 2022
- Historic Market Size - Product Segment 2018 - 2022 ($ million)
- 4.3 Type segment analysis 2018 - 2022
- Historic Market Size - Type Segment 2018 - 2022 ($ million)
- 4.4 Geography segment analysis 2018 - 2022
- Historic Market Size - Geography Segment 2018 - 2022 ($ million)
- 4.5 Country segment analysis 2018 - 2022
- Historic Market Size - Country Segment 2018 - 2022 ($ million)
5 Five Forces Analysis
- 5.1 Five forces summary
- Five forces analysis - Comparison between 2023 and 2028
- 5.2 Bargaining power of buyers
- Bargaining power of buyers - Impact of key factors 2023 and 2028
- 5.3 Bargaining power of suppliers
- Bargaining power of suppliers - Impact of key factors in 2023 and 2028
- 5.4 Threat of new entrants
- Threat of new entrants - Impact of key factors in 2023 and 2028
- 5.5 Threat of substitutes
- Threat of substitutes - Impact of key factors in 2023 and 2028
- 5.6 Threat of rivalry
- Threat of rivalry - Impact of key factors in 2023 and 2028
- 5.7 Market condition
- Chart on Market condition - Five forces 2023 and 2028
6 Market Segmentation by Product
- 6.1 Market segments
- Chart on Product - Market share 2023-2028 (%)
- Data Table on Product - Market share 2023-2028 (%)
- 6.2 Comparison by Product
- Chart on Comparison by Product
- Data Table on Comparison by Product
- 6.3 FCC catalysts - Market size and forecast 2023-2028
- Chart on FCC catalysts - Market size and forecast 2023-2028 ($ million)
- Data Table on FCC catalysts - Market size and forecast 2023-2028 ($ million)
- Chart on FCC catalysts - Year-over-year growth 2023-2028 (%)
- Data Table on FCC catalysts - Year-over-year growth 2023-2028 (%)
- 6.4 Alkylation catalysts - Market size and forecast 2023-2028
- Chart on Alkylation catalysts - Market size and forecast 2023-2028 ($ million)
- Data Table on Alkylation catalysts - Market size and forecast 2023-2028 ($ million)
- Chart on Alkylation catalysts - Year-over-year growth 2023-2028 (%)
- Data Table on Alkylation catalysts - Year-over-year growth 2023-2028 (%)
- 6.5 Hydrotreating catalysts - Market size and forecast 2023-2028
- Chart on Hydrotreating catalysts - Market size and forecast 2023-2028 ($ million)
- Data Table on Hydrotreating catalysts - Market size and forecast 2023-2028 ($ million)
- Chart on Hydrotreating catalysts - Year-over-year growth 2023-2028 (%)
- Data Table on Hydrotreating catalysts - Year-over-year growth 2023-2028 (%)
- 6.6 Hydrocracking catalysts - Market size and forecast 2023-2028
- Chart on Hydrocracking catalysts - Market size and forecast 2023-2028 ($ million)
- Data Table on Hydrocracking catalysts - Market size and forecast 2023-2028 ($ million)
- Chart on Hydrocracking catalysts - Year-over-year growth 2023-2028 (%)
- Data Table on Hydrocracking catalysts - Year-over-year growth 2023-2028 (%)
- 6.7 Catalytic reforming catalysts - Market size and forecast 2023-2028
- Chart on Catalytic reforming catalysts - Market size and forecast 2023-2028 ($ million)
- Data Table on Catalytic reforming catalysts - Market size and forecast 2023-2028 ($ million)
- Chart on Catalytic reforming catalysts - Year-over-year growth 2023-2028 (%)
- Data Table on Catalytic reforming catalysts - Year-over-year growth 2023-2028 (%)
- 6.8 Market opportunity by Product
- Market opportunity by Product ($ million)
- Data Table on Market opportunity by Product ($ million)
7 Market Segmentation by Type
- 7.1 Market segments
- Chart on Type - Market share 2023-2028 (%)
- Data Table on Type - Market share 2023-2028 (%)
- 7.2 Comparison by Type
- Chart on Comparison by Type
- Data Table on Comparison by Type
- 7.3 Zeolites - Market size and forecast 2023-2028
- Chart on Zeolites - Market size and forecast 2023-2028 ($ million)
- Data Table on Zeolites - Market size and forecast 2023-2028 ($ million)
- Chart on Zeolites - Year-over-year growth 2023-2028 (%)
- Data Table on Zeolites - Year-over-year growth 2023-2028 (%)
- 7.4 Metals - Market size and forecast 2023-2028
- Chart on Metals - Market size and forecast 2023-2028 ($ million)
- Data Table on Metals - Market size and forecast 2023-2028 ($ million)
- Chart on Metals - Year-over-year growth 2023-2028 (%)
- Data Table on Metals - Year-over-year growth 2023-2028 (%)
- 7.5 Chemical compounds - Market size and forecast 2023-2028
- Chart on Chemical compounds - Market size and forecast 2023-2028 ($ million)
- Data Table on Chemical compounds - Market size and forecast 2023-2028 ($ million)
- Chart on Chemical compounds - Year-over-year growth 2023-2028 (%)
- Data Table on Chemical compounds - Year-over-year growth 2023-2028 (%)
- 7.6 Market opportunity by Type
- Market opportunity by Type ($ million)
- Data Table on Market opportunity by Type ($ million)
8 Customer Landscape
- 8.1 Customer landscape overview
- Analysis of price sensitivity, lifecycle, customer purchase basket, adoption rates, and purchase criteria
9 Geographic Landscape
- 9.1 Geographic segmentation
- Chart on Market share By Geographical Landscape 2023-2028 (%)
- Data Table on Market share By Geographical Landscape 2023-2028 (%)
- 9.2 Geographic comparison
- Chart on Geographic comparison
- Data Table on Geographic comparison
- 9.3 APAC - Market size and forecast 2023-2028
- Chart on APAC - Market size and forecast 2023-2028 ($ million)
- Data Table on APAC - Market size and forecast 2023-2028 ($ million)
- Chart on APAC - Year-over-year growth 2023-2028 (%)
- Data Table on APAC - Year-over-year growth 2023-2028 (%)
- 9.4 North America - Market size and forecast 2023-2028
- Chart on North America - Market size and forecast 2023-2028 ($ million)
- Data Table on North America - Market size and forecast 2023-2028 ($ million)
- Chart on North America - Year-over-year growth 2023-2028 (%)
- Data Table on North America - Year-over-year growth 2023-2028 (%)
- 9.5 Europe - Market size and forecast 2023-2028
- Chart on Europe - Market size and forecast 2023-2028 ($ million)
- Data Table on Europe - Market size and forecast 2023-2028 ($ million)
- Chart on Europe - Year-over-year growth 2023-2028 (%)
- Data Table on Europe - Year-over-year growth 2023-2028 (%)
- 9.6 Middle East and Africa - Market size and forecast 2023-2028
- Chart on Middle East and Africa - Market size and forecast 2023-2028 ($ million)
- Data Table on Middle East and Africa - Market size and forecast 2023-2028 ($ million)
- Chart on Middle East and Africa - Year-over-year growth 2023-2028 (%)
- Data Table on Middle East and Africa - Year-over-year growth 2023-2028 (%)
- 9.7 South America - Market size and forecast 2023-2028
- Chart on South America - Market size and forecast 2023-2028 ($ million)
- Data Table on South America - Market size and forecast 2023-2028 ($ million)
- Chart on South America - Year-over-year growth 2023-2028 (%)
- Data Table on South America - Year-over-year growth 2023-2028 (%)
- 9.8 China - Market size and forecast 2023-2028
- Chart on China - Market size and forecast 2023-2028 ($ million)
- Data Table on China - Market size and forecast 2023-2028 ($ million)
- Chart on China - Year-over-year growth 2023-2028 (%)
- Data Table on China - Year-over-year growth 2023-2028 (%)
- 9.9 US - Market size and forecast 2023-2028
- Chart on US - Market size and forecast 2023-2028 ($ million)
- Data Table on US - Market size and forecast 2023-2028 ($ million)
- Chart on US - Year-over-year growth 2023-2028 (%)
- Data Table on US - Year-over-year growth 2023-2028 (%)
- 9.10 Germany - Market size and forecast 2023-2028
- Chart on Germany - Market size and forecast 2023-2028 ($ million)
- Data Table on Germany - Market size and forecast 2023-2028 ($ million)
- Chart on Germany - Year-over-year growth 2023-2028 (%)
- Data Table on Germany - Year-over-year growth 2023-2028 (%)
- 9.11 France - Market size and forecast 2023-2028
- Chart on France - Market size and forecast 2023-2028 ($ million)
- Data Table on France - Market size and forecast 2023-2028 ($ million)
- Chart on France - Year-over-year growth 2023-2028 (%)
- Data Table on France - Year-over-year growth 2023-2028 (%)
- 9.12 India - Market size and forecast 2023-2028
- Chart on India - Market size and forecast 2023-2028 ($ million)
- Data Table on India - Market size and forecast 2023-2028 ($ million)
- Chart on India - Year-over-year growth 2023-2028 (%)
- Data Table on India - Year-over-year growth 2023-2028 (%)
- 9.13 Market opportunity By Geographical Landscape
- Market opportunity By Geographical Landscape ($ million)
- Data Tables on Market opportunity By Geographical Landscape ($ million)
10 Drivers, Challenges, and Opportunity/Restraints
- 10.1 Market drivers
- 10.2 Market challenges
- 10.3 Impact of drivers and challenges
- Impact of drivers and challenges in 2023 and 2028
- 10.4 Market opportunities/restraints
11 Competitive Landscape
- 11.1 Overview
- 11.2 Competitive Landscape
- Overview on criticality of inputs and factors of differentiation
- 11.3 Landscape disruption
- Overview on factors of disruption
- 11.4 Industry risks
- Impact of key risks on business
12 Competitive Analysis
- 12.1 Companies profiled
- Companies covered
- 12.2 Market positioning of companies
- Matrix on companies position and classification
- 12.3 Albemarle Corp.
- Albemarle Corp. - Overview
- Albemarle Corp. - Business segments
- Albemarle Corp. - Key news
- Albemarle Corp. - Key offerings
- Albemarle Corp. - Segment focus
- 12.4 Axens
- Axens - Overview
- Axens - Product / Service
- Axens - Key news
- Axens - Key offerings
- 12.5 BASF SE
- BASF SE - Overview
- BASF SE - Business segments
- BASF SE - Key news
- BASF SE - Key offerings
- BASF SE - Segment focus
- 12.6 Chevron Corp.
- Chevron Corp. - Overview
- Chevron Corp. - Business segments
- Chevron Corp. - Key news
- Chevron Corp. - Key offerings
- Chevron Corp. - Segment focus
- 12.7 Clariant International Ltd.
- Clariant International Ltd. - Overview
- Clariant International Ltd. - Business segments
- Clariant International Ltd. - Key news
- Clariant International Ltd. - Key offerings
- Clariant International Ltd. - Segment focus
- 12.8 Dorf Ketal Chemicals I Pvt. Ltd.
- Dorf Ketal Chemicals I Pvt. Ltd. - Overview
- Dorf Ketal Chemicals I Pvt. Ltd. - Product / Service
- Dorf Ketal Chemicals I Pvt. Ltd. - Key offerings
- 12.9 Evonik Industries AG
- Evonik Industries AG - Overview
- Evonik Industries AG - Business segments
- Evonik Industries AG - Key news
- Evonik Industries AG - Key offerings
- Evonik Industries AG - Segment focus
- 12.10 Exxon Mobil Corp.
- Exxon Mobil Corp. - Overview
- Exxon Mobil Corp. - Business segments
- Exxon Mobil Corp. - Key news
- Exxon Mobil Corp. - Key offerings
- Exxon Mobil Corp. - Segment focus
- 12.11 Honeywell International Inc.
- Honeywell International Inc. - Overview
- Honeywell International Inc. - Business segments
- Honeywell International Inc. - Key news
- Honeywell International Inc. - Key offerings
- Honeywell International Inc. - Segment focus
- 12.12 Johnson Matthey Plc
- Johnson Matthey Plc - Overview
- Johnson Matthey Plc - Business segments
- Johnson Matthey Plc - Key news
- Johnson Matthey Plc - Key offerings
- Johnson Matthey Plc - Segment focus
- 12.13 KNT Group
- KNT Group - Overview
- KNT Group - Product / Service
- KNT Group - Key offerings
- 12.14 Shell plc
- Shell plc - Overview
- Shell plc - Business segments
- Shell plc - Key news
- Shell plc - Key offerings
- Shell plc - Segment focus
- 12.15 Sinopec Shanghai Petrochemical Co. Ltd.
- Sinopec Shanghai Petrochemical Co. Ltd. - Overview
- Sinopec Shanghai Petrochemical Co. Ltd. - Business segments
- Sinopec Shanghai Petrochemical Co. Ltd. - Key news
- Sinopec Shanghai Petrochemical Co. Ltd. - Key offerings
- Sinopec Shanghai Petrochemical Co. Ltd. - Segment focus
- 12.16 Topsoes AS
- Topsoes AS - Overview
- Topsoes AS - Product / Service
- Topsoes AS - Key offerings
- 12.17 W. R. Grace and Co.
- W. R. Grace and Co. - Overview
- W. R. Grace and Co. - Product / Service
- W. R. Grace and Co. - Key offerings
13 Appendix
- 13.1 Scope of the report
- 13.2 Inclusions and exclusions checklist
- Inclusions checklist
- Exclusions checklist
- 13.3 Currency conversion rates for US$
- Currency conversion rates for US$
- 13.4 Research methodology
- Research methodology
- 13.5 Data procurement
- Information sources
- 13.6 Data validation
- Data validation
- 13.7 Validation techniques employed for market sizing
- Validation techniques employed for market sizing
- 13.8 Data synthesis
- Data synthesis
- 360 degree market analysis
- 360 degree market analysis
- 13.10 List of abbreviations
- List of abbreviations
