|
|
市場調査レポート
商品コード
1681263
ベンチャーキャピタル投資の世界市場、2025-2029年Global Venture Capital Investment Market 2025-2029 |
||||||

|
|||||||
カスタマイズ可能
|
|||||||


| ベンチャーキャピタル投資の世界市場、2025-2029年 |
|
出版日: 2025年03月01日
発行: TechNavio
ページ情報: 英文 211 Pages
納期: 即納可能
|

全表示
- 概要
- 目次
ベンチャーキャピタル投資市場は2024-2029年に2兆9,202億米ドル、予測期間中のCAGRで37.9%の成長が予測されています。
当レポートでは、ベンチャーキャピタル投資市場の全体的な分析、市場規模・予測、動向、成長促進要因、課題、約25のベンダーを網羅したベンダー分析などを掲載しています。
現在の市場シナリオ、最新動向と促進要因、市場環境全体に関する最新分析を提供しています。市場は、バイオテクノロジー企業へのVC投資の増加、高い潜在的リターンに対する需要の高まり、世界化と国境を越えた投資の拡大によって牽引されています。
| 市場範囲 | |
|---|---|
| 基準年 | 2025 |
| 終了年 | 2029 |
| 予測期間 | 2025-2029 |
| 成長モメンタム | 加速 |
| 前年比2025年 | 29.3% |
| CAGR | 37.9% |
| 増分額 | 2兆9,202億米ドル |
本調査は、業界の主要参加者からのインプットを含め、一次情報と二次情報を客観的に組み合わせて実施しました。本レポートには、主要企業の分析に加え、包括的な市場規模データ、地域分析によるセグメント、ベンダー情勢が含まれています。レポートには過去データと予測データがあります。
本調査では、今後数年間のベンチャーキャピタル投資市場の成長を促進する主な理由の一つとして、世界の富裕層(HNWI)の増加を挙げています。また、デジタル化と新興企業の出現が市場に大きな需要をもたらすでしょう。
目次
第1章 エグゼクティブサマリー
- 市場概要
第2章 Technavio分析
- 価格・ライフサイクル・顧客購入バスケット・採用率・購入基準の分析
- インプットの重要性と差別化の要因
- 混乱の要因
- 促進要因と課題の影響
第3章 市場情勢
- 市場エコシステム
- 市場の特徴
- バリューチェーン分析
第4章 市場規模
- 市場の定義
- 市場セグメント分析
- 市場規模 2024
- 市場の見通し 2024-2029
第5章 市場規模実績
- 世界のベンチャーキャピタル投資市場 2019-2023
- セクター別セグメント分析 2019-2023
- タイプ別セグメント分析 2019-2023
- バリアント別セグメント分析 2019-2023
- 地域別セグメント分析 2019-2023
- 国別セグメント分析 2019-2023
第6章 定性分析
- AIの影響:世界のベンチャーキャピタル投資市場
第7章 ファイブフォース分析
- ファイブフォースの要約
- 買い手の交渉力
- 供給企業の交渉力
- 新規参入業者の脅威
- 代替品の脅威
- 競争の脅威
- 市況
第8章 市場セグメンテーション:セクター別
- 市場セグメント
- 比較:セクター別
- ソフトウェア:市場規模と予測 2024-2029
- 製薬・バイオテクノロジー:市場規模と予測 2024-2029
- メディア・エンターテインメント:市場規模と予測 2024-2029
- 医療機器:市場規模と予測 2024-2029
- その他:市場規模と予測 2024-2029
- 市場機会セクター別
第9章 市場セグメンテーション:タイプ別
- 市場セグメント
- 比較:タイプ別
- 初回ベンチャー資金:市場規模と予測 2024-2029
- 追加ベンチャー資金:市場規模と予測 2024-2029
- 市場機会:タイプ別
第10章 市場セグメンテーション:バリアント別
- 市場セグメント
- 比較:バリアント別
- 機関投資家:市場規模と予測 2024-2029
- コーポレートベンチャーキャピタル:市場規模と予測 2024-2029
- プライベートエクイティファーム:市場規模と予測 2024-2029
- エンジェル投資家:市場規模と予測 2024-2029
- その他:市場規模と予測 2024-2029
- 市場機会バリアント別
第11章 顧客情勢
- 顧客情勢の概要
第12章 地域別情勢
- 地域別セグメンテーション
- 地域別比較
- 北米:市場規模と予測 2024-2029
- 欧州:市場規模と予測 2024-2029
- アジア太平洋:市場規模と予測 2024-2029
- 南米:市場規模と予測 2024-2029
- 中東・アフリカ:市場規模と予測 2024-2029
- 米国:市場規模と予測 2024-2029
- カナダ:市場規模と予測 2024-2029
- 英国:市場規模と予測 2024-2029
- ドイツ:市場規模と予測 2024-2029
- 中国:市場規模と予測 2024-2029
- フランス:市場規模と予測 2024-2029
- イタリア:市場規模と予測 2024-2029
- オランダ:市場規模と予測 2024-2029
- インド:市場規模と予測 2024-2029
- 日本:市場規模と予測 2024-2029
- 市場機会:地域情勢別
第13章 促進要因・課題・機会・抑制要因
- 市場促進要因
- 市場の課題
- 促進要因と課題の影響
- 市場の機会・抑制要因
第14章 競合情勢
- 概要
- 競合情勢
- 混乱の状況
- 業界のリスク
第15章 競合分析
- 企業プロファイル
- 企業ランキング指数
- 企業の市場ポジショニング
- Accel
- Agoranov
- AH Capital Management LLC
- Balderton Capital UK LLP
- Battery Ventures
- Bessemer Venture Partners
- Caixa Capital Risc SGEIC S.A.
- Cherry Ventures Management GmbH
- First Round Capital
- Founders Fund
- GGV Capital
- Index Ventures UK LLP
- Sequoia Capital Operations LLC
- Target Global
- Union Square Ventures
第16章 付録
The venture capital investment market is forecasted to grow by USD 2920.2 billion during 2024-2029, accelerating at a CAGR of 37.9% during the forecast period. The report on the venture capital investment market provides a holistic analysis, market size and forecast, trends, growth drivers, and challenges, as well as vendor analysis covering around 25 vendors.
The report offers an up-to-date analysis regarding the current market scenario, the latest trends and drivers, and the overall market environment. The market is driven by increasing vc investment in biotech companies, growing demand for high potential returns, and growing globalization and cross-border investments.
| Market Scope | |
|---|---|
| Base Year | 2025 |
| End Year | 2029 |
| Series Year | 2025-2029 |
| Growth Momentum | Accelerate |
| YOY 2025 | 29.3% |
| CAGR | 37.9% |
| Incremental Value | $2920.2 bn |
The study was conducted using an objective combination of primary and secondary information including inputs from key participants in the industry. The report contains a comprehensive market size data, segment with regional analysis and vendor landscape in addition to an analysis of the key companies. Reports have historic and forecast data.
Technavio's venture capital investment market is segmented as below:
By Sector
- Software
- Pharmaceutical and biotechnology
- Media and entertainment
- Medical devices and equipments
- Others
By Type
- First-time venture funding
- Follow-on venture funding
By Variant
- Institutional Investors
- Corporate venture capital
- Private equity firms
- Angel investors
- Others
By Geographical Landscape
- North America
- Europe
- APAC
- South America
- Middle East and Africa
This study identifies the rising number of high-net-worth individuals (HNWIs) globally as one of the prime reasons driving the venture capital investment market growth during the next few years. Also, positive influence of digitalization and emergence of startups will lead to sizable demand in the market.
The report on the venture capital investment market covers the following areas:
- Venture Capital Investment Market sizing
- Venture Capital Investment Market forecast
- Venture Capital Investment Market industry analysis
The robust vendor analysis is designed to help clients improve their market position, and in line with this, this report provides a detailed analysis of several leading venture capital investment market vendors that include Accel, Agoranov, AH Capital Management LLC, Balderton Capital UK LLP, Battery Ventures, Bessemer Venture Partners, Caixa Capital Risc SGEIC S.A., Cherry Ventures Management GmbH, First Round Capital, Founders Fund, GGV Capital, Greylock Partners, Hoxton Ventures LLP, Index Ventures UK LLP, Lakestar Advisors GmbH, Seedcamp Investment Management LLP, Sequoia Capital Operations LLC, Target Global, and Union Square Ventures. Also, the venture capital investment market analysis report includes information on upcoming trends and challenges that will influence market growth. This is to help companies strategize and leverage all forthcoming growth opportunities.
The publisher presents a detailed picture of the market by the way of study, synthesis, and summation of data from multiple sources by an analysis of key parameters such as profit, pricing, competition, and promotions. It presents various market facets by identifying the key industry influencers. The data presented is comprehensive, reliable, and a result of extensive primary and secondary research. The market research reports provide a complete competitive landscape and an in-depth vendor selection methodology and analysis using qualitative and quantitative research to forecast accurate market growth.
Table of Contents
1 Executive Summary
- 1.1 Market overview
- Executive Summary - Chart on Market Overview
- Executive Summary - Data Table on Market Overview
- Executive Summary - Chart on Global Market Characteristics
- Executive Summary - Chart on Market By Geographical Landscape
- Executive Summary - Chart on Market Segmentation by Sector
- Executive Summary - Chart on Market Segmentation by Type
- Executive Summary - Chart on Market Segmentation by Variant
- Executive Summary - Chart on Incremental Growth
- Executive Summary - Data Table on Incremental Growth
- Executive Summary - Chart on Company Market Positioning
2 Technavio Analysis
- 2.1 Analysis of price sensitivity, lifecycle, customer purchase basket, adoption rates, and purchase criteria
- Analysis of price sensitivity, lifecycle, customer purchase basket, adoption rates, and purchase criteria
- 2.2 Criticality of inputs and Factors of differentiation
- Overview on criticality of inputs and factors of differentiation
- 2.3 Factors of disruption
- Overview on factors of disruption
- 2.4 Impact of drivers and challenges
- Impact of drivers and challenges in 2024 and 2029
3 Market Landscape
- 3.1 Market ecosystem
- Parent Market
- Data Table on - Parent Market
- 3.2 Market characteristics
- Market characteristics analysis
- 3.3 Value chain analysis
- Value chain analysis
4 Market Sizing
- 4.1 Market definition
- Offerings of companies included in the market definition
- 4.2 Market segment analysis
- Market segments
- 4.3 Market size 2024
- 4.4 Market outlook: Forecast for 2024-2029
- Chart on Global - Market size and forecast 2024-2029 ($ billion)
- Data Table on Global - Market size and forecast 2024-2029 ($ billion)
- Chart on Global Market: Year-over-year growth 2024-2029 (%)
- Data Table on Global Market: Year-over-year growth 2024-2029 (%)
5 Historic Market Size
- 5.1 Global Venture Capital Investment Market 2019 - 2023
- Historic Market Size - Data Table on Global Venture Capital Investment Market 2019 - 2023 ($ billion)
- 5.2 Sector segment analysis 2019 - 2023
- Historic Market Size - Sector Segment 2019 - 2023 ($ billion)
- 5.3 Type segment analysis 2019 - 2023
- Historic Market Size - Type Segment 2019 - 2023 ($ billion)
- 5.4 Variant segment analysis 2019 - 2023
- Historic Market Size - Variant Segment 2019 - 2023 ($ billion)
- 5.5 Geography segment analysis 2019 - 2023
- Historic Market Size - Geography Segment 2019 - 2023 ($ billion)
- 5.6 Country segment analysis 2019 - 2023
- Historic Market Size - Country Segment 2019 - 2023 ($ billion)
6 Qualitative Analysis
- 6.1 Impact of AI on Global Venture Capital Investment Market
7 Five Forces Analysis
- 7.1 Five forces summary
- Five forces analysis - Comparison between 2024 and 2029
- 7.2 Bargaining power of buyers
- Bargaining power of buyers - Impact of key factors 2024 and 2029
- 7.3 Bargaining power of suppliers
- Bargaining power of suppliers - Impact of key factors in 2024 and 2029
- 7.4 Threat of new entrants
- Threat of new entrants - Impact of key factors in 2024 and 2029
- 7.5 Threat of substitutes
- Threat of substitutes - Impact of key factors in 2024 and 2029
- 7.6 Threat of rivalry
- Threat of rivalry - Impact of key factors in 2024 and 2029
- 7.7 Market condition
- Chart on Market condition - Five forces 2024 and 2029
8 Market Segmentation by Sector
- 8.1 Market segments
- Chart on Sector - Market share 2024-2029 (%)
- Data Table on Sector - Market share 2024-2029 (%)
- 8.2 Comparison by Sector
- Chart on Comparison by Sector
- Data Table on Comparison by Sector
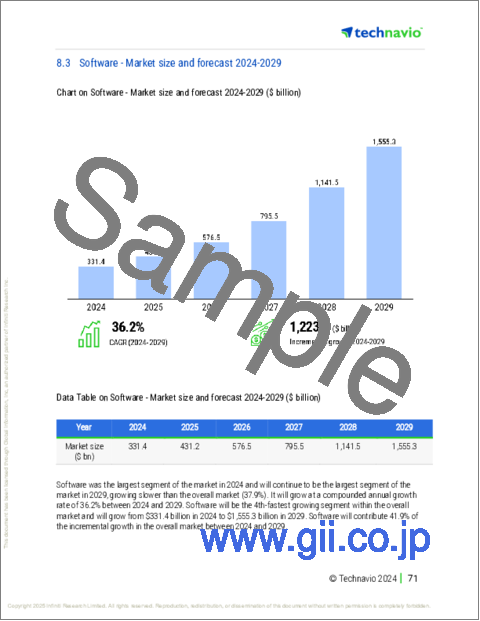
- 8.3 Software - Market size and forecast 2024-2029
- Chart on Software - Market size and forecast 2024-2029 ($ billion)
- Data Table on Software - Market size and forecast 2024-2029 ($ billion)
- Chart on Software - Year-over-year growth 2024-2029 (%)
- Data Table on Software - Year-over-year growth 2024-2029 (%)
- 8.4 Pharmaceutical and biotechnology - Market size and forecast 2024-2029
- Chart on Pharmaceutical and biotechnology - Market size and forecast 2024-2029 ($ billion)
- Data Table on Pharmaceutical and biotechnology - Market size and forecast 2024-2029 ($ billion)
- Chart on Pharmaceutical and biotechnology - Year-over-year growth 2024-2029 (%)
- Data Table on Pharmaceutical and biotechnology - Year-over-year growth 2024-2029 (%)
- 8.5 Media and entertainment - Market size and forecast 2024-2029
- Chart on Media and entertainment - Market size and forecast 2024-2029 ($ billion)
- Data Table on Media and entertainment - Market size and forecast 2024-2029 ($ billion)
- Chart on Media and entertainment - Year-over-year growth 2024-2029 (%)
- Data Table on Media and entertainment - Year-over-year growth 2024-2029 (%)
- 8.6 Medical devices and equipments - Market size and forecast 2024-2029
- Chart on Medical devices and equipments - Market size and forecast 2024-2029 ($ billion)
- Data Table on Medical devices and equipments - Market size and forecast 2024-2029 ($ billion)
- Chart on Medical devices and equipments - Year-over-year growth 2024-2029 (%)
- Data Table on Medical devices and equipments - Year-over-year growth 2024-2029 (%)
- 8.7 Others - Market size and forecast 2024-2029
- Chart on Others - Market size and forecast 2024-2029 ($ billion)
- Data Table on Others - Market size and forecast 2024-2029 ($ billion)
- Chart on Others - Year-over-year growth 2024-2029 (%)
- Data Table on Others - Year-over-year growth 2024-2029 (%)
- 8.8 Market opportunity by Sector
- Market opportunity by Sector ($ billion)
- Data Table on Market opportunity by Sector ($ billion)
9 Market Segmentation by Type
- 9.1 Market segments
- Chart on Type - Market share 2024-2029 (%)
- Data Table on Type - Market share 2024-2029 (%)
- 9.2 Comparison by Type
- Chart on Comparison by Type
- Data Table on Comparison by Type
- 9.3 First-time venture funding - Market size and forecast 2024-2029
- Chart on First-time venture funding - Market size and forecast 2024-2029 ($ billion)
- Data Table on First-time venture funding - Market size and forecast 2024-2029 ($ billion)
- Chart on First-time venture funding - Year-over-year growth 2024-2029 (%)
- Data Table on First-time venture funding - Year-over-year growth 2024-2029 (%)
- 9.4 Follow-on venture funding - Market size and forecast 2024-2029
- Chart on Follow-on venture funding - Market size and forecast 2024-2029 ($ billion)
- Data Table on Follow-on venture funding - Market size and forecast 2024-2029 ($ billion)
- Chart on Follow-on venture funding - Year-over-year growth 2024-2029 (%)
- Data Table on Follow-on venture funding - Year-over-year growth 2024-2029 (%)
- 9.5 Market opportunity by Type
- Market opportunity by Type ($ billion)
- Data Table on Market opportunity by Type ($ billion)
10 Market Segmentation by Variant
- 10.1 Market segments
- Chart on Variant - Market share 2024-2029 (%)
- Data Table on Variant - Market share 2024-2029 (%)
- 10.2 Comparison by Variant
- Chart on Comparison by Variant
- Data Table on Comparison by Variant
- 10.3 Institutional Investors - Market size and forecast 2024-2029
- Chart on Institutional Investors - Market size and forecast 2024-2029 ($ billion)
- Data Table on Institutional Investors - Market size and forecast 2024-2029 ($ billion)
- Chart on Institutional Investors - Year-over-year growth 2024-2029 (%)
- Data Table on Institutional Investors - Year-over-year growth 2024-2029 (%)
- 10.4 Corporate venture capital - Market size and forecast 2024-2029
- Chart on Corporate venture capital - Market size and forecast 2024-2029 ($ billion)
- Data Table on Corporate venture capital - Market size and forecast 2024-2029 ($ billion)
- Chart on Corporate venture capital - Year-over-year growth 2024-2029 (%)
- Data Table on Corporate venture capital - Year-over-year growth 2024-2029 (%)
- 10.5 Private equity firms - Market size and forecast 2024-2029
- Chart on Private equity firms - Market size and forecast 2024-2029 ($ billion)
- Data Table on Private equity firms - Market size and forecast 2024-2029 ($ billion)
- Chart on Private equity firms - Year-over-year growth 2024-2029 (%)
- Data Table on Private equity firms - Year-over-year growth 2024-2029 (%)
- 10.6 Angel investors - Market size and forecast 2024-2029
- Chart on Angel investors - Market size and forecast 2024-2029 ($ billion)
- Data Table on Angel investors - Market size and forecast 2024-2029 ($ billion)
- Chart on Angel investors - Year-over-year growth 2024-2029 (%)
- Data Table on Angel investors - Year-over-year growth 2024-2029 (%)
- 10.7 Others - Market size and forecast 2024-2029
- Chart on Others - Market size and forecast 2024-2029 ($ billion)
- Data Table on Others - Market size and forecast 2024-2029 ($ billion)
- Chart on Others - Year-over-year growth 2024-2029 (%)
- Data Table on Others - Year-over-year growth 2024-2029 (%)
- 10.8 Market opportunity by Variant
- Market opportunity by Variant ($ billion)
- Data Table on Market opportunity by Variant ($ billion)
11 Customer Landscape
- 11.1 Customer landscape overview
- Analysis of price sensitivity, lifecycle, customer purchase basket, adoption rates, and purchase criteria
12 Geographic Landscape
- 12.1 Geographic segmentation
- Chart on Market share By Geographical Landscape 2024-2029 (%)
- Data Table on Market share By Geographical Landscape 2024-2029 (%)
- 12.2 Geographic comparison
- Chart on Geographic comparison
- Data Table on Geographic comparison
- 12.3 North America - Market size and forecast 2024-2029
- Chart on North America - Market size and forecast 2024-2029 ($ billion)
- Data Table on North America - Market size and forecast 2024-2029 ($ billion)
- Chart on North America - Year-over-year growth 2024-2029 (%)
- Data Table on North America - Year-over-year growth 2024-2029 (%)
- 12.4 Europe - Market size and forecast 2024-2029
- Chart on Europe - Market size and forecast 2024-2029 ($ billion)
- Data Table on Europe - Market size and forecast 2024-2029 ($ billion)
- Chart on Europe - Year-over-year growth 2024-2029 (%)
- Data Table on Europe - Year-over-year growth 2024-2029 (%)
- 12.5 APAC - Market size and forecast 2024-2029
- Chart on APAC - Market size and forecast 2024-2029 ($ billion)
- Data Table on APAC - Market size and forecast 2024-2029 ($ billion)
- Chart on APAC - Year-over-year growth 2024-2029 (%)
- Data Table on APAC - Year-over-year growth 2024-2029 (%)
- 12.6 South America - Market size and forecast 2024-2029
- Chart on South America - Market size and forecast 2024-2029 ($ billion)
- Data Table on South America - Market size and forecast 2024-2029 ($ billion)
- Chart on South America - Year-over-year growth 2024-2029 (%)
- Data Table on South America - Year-over-year growth 2024-2029 (%)
- 12.7 Middle East and Africa - Market size and forecast 2024-2029
- Chart on Middle East and Africa - Market size and forecast 2024-2029 ($ billion)
- Data Table on Middle East and Africa - Market size and forecast 2024-2029 ($ billion)
- Chart on Middle East and Africa - Year-over-year growth 2024-2029 (%)
- Data Table on Middle East and Africa - Year-over-year growth 2024-2029 (%)
- 12.8 US - Market size and forecast 2024-2029
- Chart on US - Market size and forecast 2024-2029 ($ billion)
- Data Table on US - Market size and forecast 2024-2029 ($ billion)
- Chart on US - Year-over-year growth 2024-2029 (%)
- Data Table on US - Year-over-year growth 2024-2029 (%)
- 12.9 Canada - Market size and forecast 2024-2029
- Chart on Canada - Market size and forecast 2024-2029 ($ billion)
- Data Table on Canada - Market size and forecast 2024-2029 ($ billion)
- Chart on Canada - Year-over-year growth 2024-2029 (%)
- Data Table on Canada - Year-over-year growth 2024-2029 (%)
- 12.10 UK - Market size and forecast 2024-2029
- Chart on UK - Market size and forecast 2024-2029 ($ billion)
- Data Table on UK - Market size and forecast 2024-2029 ($ billion)
- Chart on UK - Year-over-year growth 2024-2029 (%)
- Data Table on UK - Year-over-year growth 2024-2029 (%)
- 12.11 Germany - Market size and forecast 2024-2029
- Chart on Germany - Market size and forecast 2024-2029 ($ billion)
- Data Table on Germany - Market size and forecast 2024-2029 ($ billion)
- Chart on Germany - Year-over-year growth 2024-2029 (%)
- Data Table on Germany - Year-over-year growth 2024-2029 (%)
- 12.12 China - Market size and forecast 2024-2029
- Chart on China - Market size and forecast 2024-2029 ($ billion)
- Data Table on China - Market size and forecast 2024-2029 ($ billion)
- Chart on China - Year-over-year growth 2024-2029 (%)
- Data Table on China - Year-over-year growth 2024-2029 (%)
- 12.13 France - Market size and forecast 2024-2029
- Chart on France - Market size and forecast 2024-2029 ($ billion)
- Data Table on France - Market size and forecast 2024-2029 ($ billion)
- Chart on France - Year-over-year growth 2024-2029 (%)
- Data Table on France - Year-over-year growth 2024-2029 (%)
- 12.14 Italy - Market size and forecast 2024-2029
- Chart on Italy - Market size and forecast 2024-2029 ($ billion)
- Data Table on Italy - Market size and forecast 2024-2029 ($ billion)
- Chart on Italy - Year-over-year growth 2024-2029 (%)
- Data Table on Italy - Year-over-year growth 2024-2029 (%)
- 12.15 The Netherlands - Market size and forecast 2024-2029
- Chart on The Netherlands - Market size and forecast 2024-2029 ($ billion)
- Data Table on The Netherlands - Market size and forecast 2024-2029 ($ billion)
- Chart on The Netherlands - Year-over-year growth 2024-2029 (%)
- Data Table on The Netherlands - Year-over-year growth 2024-2029 (%)
- 12.16 India - Market size and forecast 2024-2029
- Chart on India - Market size and forecast 2024-2029 ($ billion)
- Data Table on India - Market size and forecast 2024-2029 ($ billion)
- Chart on India - Year-over-year growth 2024-2029 (%)
- Data Table on India - Year-over-year growth 2024-2029 (%)
- 12.17 Japan - Market size and forecast 2024-2029
- Chart on Japan - Market size and forecast 2024-2029 ($ billion)
- Data Table on Japan - Market size and forecast 2024-2029 ($ billion)
- Chart on Japan - Year-over-year growth 2024-2029 (%)
- Data Table on Japan - Year-over-year growth 2024-2029 (%)
- 12.18 Market opportunity By Geographical Landscape
- Market opportunity By Geographical Landscape ($ billion)
- Data Tables on Market opportunity By Geographical Landscape ($ billion)
13 Drivers, Challenges, and Opportunity/Restraints
- 13.1 Market drivers
- 13.2 Market challenges
- 13.3 Impact of drivers and challenges
- Impact of drivers and challenges in 2024 and 2029
- 13.4 Market opportunities/restraints
14 Competitive Landscape
- 14.1 Overview
- 14.2 Competitive Landscape
- Overview on criticality of inputs and factors of differentiation
- 14.3 Landscape disruption
- Overview on factors of disruption
- 14.4 Industry risks
- Impact of key risks on business
15 Competitive Analysis
- 15.1 Companies profiled
- Companies covered
- 15.2 Company ranking index
- Company ranking index
- 15.3 Market positioning of companies
- Matrix on companies position and classification
- 15.4 Accel
- Accel - Overview
- Accel - Product / Service
- Accel - Key offerings
- SWOT
- 15.5 Agoranov
- Agoranov - Overview
- Agoranov - Product / Service
- Agoranov - Key offerings
- SWOT
- 15.6 AH Capital Management LLC
- AH Capital Management LLC - Overview
- AH Capital Management LLC - Product / Service
- AH Capital Management LLC - Key offerings
- SWOT
- 15.7 Balderton Capital UK LLP
- Balderton Capital UK LLP - Overview
- Balderton Capital UK LLP - Product / Service
- Balderton Capital UK LLP - Key offerings
- SWOT
- 15.8 Battery Ventures
- Battery Ventures - Overview
- Battery Ventures - Product / Service
- Battery Ventures - Key offerings
- SWOT
- 15.9 Bessemer Venture Partners
- Bessemer Venture Partners - Overview
- Bessemer Venture Partners - Product / Service
- Bessemer Venture Partners - Key offerings
- SWOT
- 15.10 Caixa Capital Risc SGEIC S.A.
- Caixa Capital Risc SGEIC S.A. - Overview
- Caixa Capital Risc SGEIC S.A. - Product / Service
- Caixa Capital Risc SGEIC S.A. - Key offerings
- SWOT
- 15.11 Cherry Ventures Management GmbH
- Cherry Ventures Management GmbH - Overview
- Cherry Ventures Management GmbH - Product / Service
- Cherry Ventures Management GmbH - Key offerings
- SWOT
- 15.12 First Round Capital
- First Round Capital - Overview
- First Round Capital - Product / Service
- First Round Capital - Key offerings
- SWOT
- 15.13 Founders Fund
- Founders Fund - Overview
- Founders Fund - Product / Service
- Founders Fund - Key offerings
- SWOT
- 15.14 GGV Capital
- GGV Capital - Overview
- GGV Capital - Product / Service
- GGV Capital - Key offerings
- SWOT
- 15.15 Index Ventures UK LLP
- Index Ventures UK LLP - Overview
- Index Ventures UK LLP - Product / Service
- Index Ventures UK LLP - Key offerings
- SWOT
- 15.16 Sequoia Capital Operations LLC
- Sequoia Capital Operations LLC - Overview
- Sequoia Capital Operations LLC - Product / Service
- Sequoia Capital Operations LLC - Key offerings
- SWOT
- 15.17 Target Global
- Target Global - Overview
- Target Global - Product / Service
- Target Global - Key offerings
- SWOT
- 15.18 Union Square Ventures
- Union Square Ventures - Overview
- Union Square Ventures - Product / Service
- Union Square Ventures - Key offerings
- SWOT
16 Appendix
- 16.1 Scope of the report
- 16.2 Inclusions and exclusions checklist
- Inclusions checklist
- Exclusions checklist
- 16.3 Currency conversion rates for US$
- Currency conversion rates for US$
- 16.4 Research methodology
- Research methodology
- 16.5 Data procurement
- Information sources
- 16.6 Data validation
- Data validation
- 16.7 Validation techniques employed for market sizing
- Validation techniques employed for market sizing
- 16.8 Data synthesis
- Data synthesis
- 16.9 360 degree market analysis
- 360 degree market analysis
- 16.10 List of abbreviations
- List of abbreviations

